
Abstract
Rapid, sensitive, and automatic detection platforms are among the major approaches of controlling viral diseases in aquaculture. An efficient detection platform permits the monitoring of pathogen spread and helps to enhance the economic benefits of commercial aquaculture. Nervous necrosis virus (NNV), the cause of viral encephalopathy and retinopathy, is among the most devastating aquaculture viruses that infect marine fish species worldwide. In the present study, a highly sensitive magnetoreduction assay was developed for detecting target biomolecules with a primary focus on NNV antigens. A standard curve of the different NNV concentrations that were isolated from infected Malabar grouper (Epinephelus malabaricus) was established before experiments were conducted. The test solution was prepared by homogeneous dispersion of magnetic nanoparticles coated with rabbit anti-NNV antibody. The magnetic nanoparticles in the solution were oscillated by magnetic interaction with multiple externally applied, alternating current magnetic fields. The assay’s limit of detection was approximately 2 × 101 TCID50/ml for NNV. Moreover, the immunomagnetic reduction readings for other aquatic viruses (i.e., 1 × 10⁷ TCID50/ml for Infectious pancreatic necrosis virus and 1 × 106.5 TCID50/ml for grouper iridovirus) were below the background noise in the NNV solution, demonstrating the specificity of the new detection platform.
Introduction
Nervous necrosis virus (NNV) belongs to the Nodaviridae family, which has a genome of 2 positive-stranded RNA molecules encoding 3 major proteins: a 3.1-kb RNA1 encoding an RNA-dependent RNA polymerase, a 1.4-kb RNA2 encoding the viral capsid protein, and a subgenomic B2 protein that has novel functions involving inhibition of RNA interference machinery.3,7,20 Nervous necrosis virus infects more than 30 fish species, causing mass mortality in aquaculture hatcheries worldwide. Infection by NNV leads to abnormal swimming, anorexia, and dark coloration, with mortality rates exceeding 95% in severe outbreaks. Histologically, NNV infection results in vacuolations in the brain and retina in larvae and juvenile fish.9,22,27
Systematic monitoring and diagnosis of NNV infections was first initiated in Japan in 1992. 1 Two cell lines, the striped snakehead fish (Channa striatus) cell line (SSN-1) and the spotted grouper (Epinephelus coioides) fin cell line (GF-1), can be used for NNV propagation.5,15 Several diagnostic tests, such as fluorescent antibody test and enzyme-linked immunosorbent assay (ELISA) can be used to differentiate NNV from other fish viruses.7,25,29 Standard reverse transcription polymerase chain reaction (RT-PCR) methods have been applied for the detection of NNV,17,21 including a NNV-specific primer pair recommended by the World Health Organization. 30 Real-time RT-PCR methods have also been developed for the detection and quantification of NNV.8,19
The principle behind the immunomagnetic reduction (IMR) assay is the measurement of the alternating-current magnetic susceptibility of magnetic nanoparticles coated with surfactants (dextran) and bioprobes such as antibodies.10,11 When subjected to multiple external alternating current (ac) magnetic fields, the magnetic nanoparticles oscillate via magnetic interaction, giving the reagent a specific magnetic property, herein referred to as multiple-frequency ac magnetic susceptibility (χac; Fig. 1a). In the presence of the targeted biomolecules, the nanoparticle-bound antibodies bind to the biomolecules forming clusters, which are less motile than unbound magnetic nanoparticles. The χac of the solution in the absence of biomolecules should be larger than the χac in the presence of biomolecules, as shown in Figure 1b. As a result, the reduction of the χac of the magnetic reagent can be evaluated and serve as a measure of the concentration of target biomolecules in the sample.
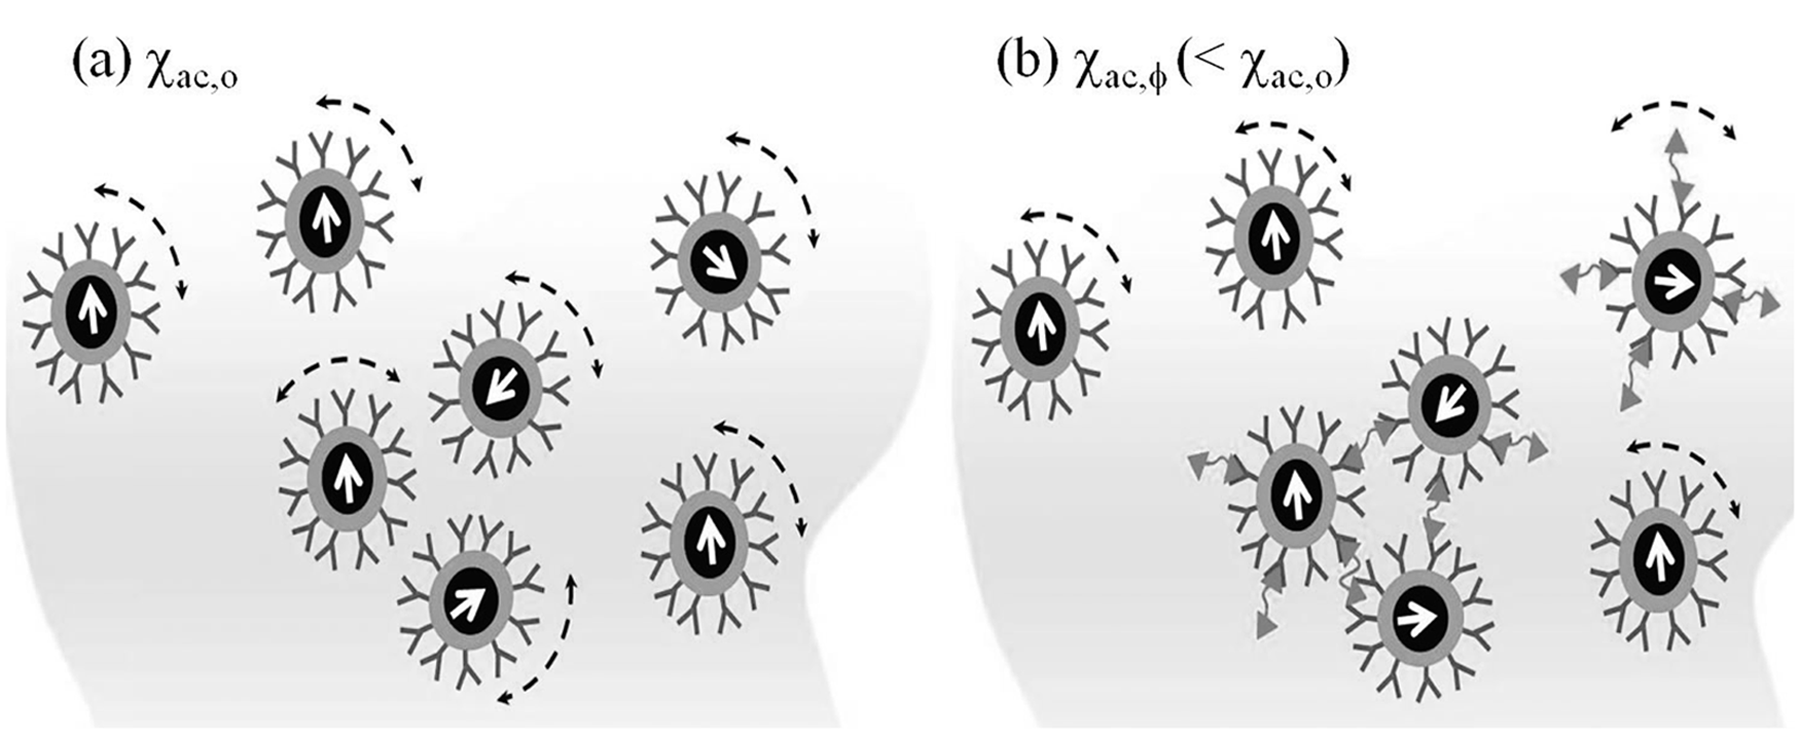
Illustration of the mechanism of the immunomagnetic reduction assay (
According to the above description, IMR exhibits several unique characteristics. First, IMR is simple because the unbound, yet-to-be-detected biomolecules and magnetic nanoparticles can remain in the reaction mixture and do not necessarily need to be removed. Second, this assay requires only a single antibody. Third, IMR is a direct and homogeneous assay that usually exhibits high reliability and sensitivity.31,32 Lastly, the concentration of the biomolecules can be measured quantitatively because the amount by which χac is reduced corresponds to the concentration of the biomolecules. The present study describes a rapid, novel IMR method that can be used to detect NNV quantitatively and specifically.
Materials and methods
Cell and virus
Grouper fin cells (GF-1) 4 for the cell culture were grown in L15 medium a supplemented with 5% fetal bovine serum, 100 IU/ml of penicillin, and 0.1 mg/ml of streptomycin at 28°C to propagate NNV previously isolated from diseased Malabar grouper (Epinephelus malabaricus) from a hatchery in southern Taiwan. Virus titration was performed on monolayers of cells grown in a 96-well plate. Ten-fold dilutions of the virus were performed from 10-1 to 10−9, and then 4 wells of the plate were inoculated with 50 µl of each dilution. Cultures were incubated at 28°C and scored for cytopathic effects after 7 days. The final titer, expressed as TCID50/ml, was estimated using the end-point titration method. 23
Anti–Nervous necrosis virus antibody
Escherichia coli expressing virus-like particles (VLPs) of NNV were produced according to previously published protocols. 18 Briefly, the NNV RNA2 was extracted from a virus suspension and amplified by RT-PCR. The amplified RNA2 was cloned into the pQE30 protein expression vector. b After isopropyl β-D-1-thiogalactopyranoside induction, the VLPs were purified by sucrose and cesium chloride centrifugation. New Zealand rabbits of approximately 12 weeks of age (in duplicate) were immunized with purified VLPs. Immunogen emulsions were prepared by repeatedly passing this mixture through a narrow bore cylindrical Pyrex c block drilled at each end to accommodate 2 syringes. The first immunization solution consisted of 500 μl of phosphate buffered saline (PBS), which contained 1 mg of immunogen emulsified in 500 μl of complete Freund adjuvant. Subsequent booster injections of 100 µg of VLP in incomplete Freund adjuvant were given every 2 weeks for 2 months. Rabbits were bled after each injection. The sera antibody titers were determined by indirect ELISA.
Nervous necrosis virus–specific ELISA
Ninety-six-well microtiter plates c were coated with 50 μl of purified NNV (5 μg ml-1) per well and incubated overnight at 4°C. The plates were washed with PBS and blocked using 3% bovine serum albumin (BSA) in PBS with 2-hr incubation at 37°C. The plates were then reacted with rabbit anti-NNV antibody and incubated for 1 hr at 37°C. This was followed by subsequent incubation for 1 hr at 37°C with horseradish peroxidase–conjugated goat anti-rabbit immunoglobulin G antibody. d After 3 washes with PBS-Tween, 50 µl of 3,3′,5,5′-tetramethylbenzidine solution e was then added prior to incubation at room temperature under dark condition for 12 min. The reaction was stopped with the addition of 50 μl of 2 M H2SO4; absorbance (optical density) was read at 450 nm using a plate reader.
Magnetic reagent preparation
Magnetic nanoparticles were formulated using Fe3O4 coated with dextran. f The mean diameter of the magnetic nanoparticles was approximately 64 nm. To magnetically label NNV, 10 ml of magnetic particles were oxidized by NaIO4 to create aldehyde group (-CHO) on dextran, then incubated with over-saturated rabbit anti-NNV antibody. Antibody was then covalently conjugated on the magnetic particles through the formation of -CH=N- intramolecular bonds. 12 Free anti-NNV was removed from the solution through magnetic separation. The anti-NNV magnetic nanoparticles were dispersed in the PBS solution to a concentration of 0.1 electromagnetic unit (emu)/g with a pH of 7.4.
Virus sample preparation
For the standard curve, NNV cell culture supernatants were diluted with PBS (pH 7.4) to 5 and 1 × 101–1 × 10⁷ TCID50/ml. Three replicates of diluted NNV solution for each concentration were performed to obtain the average IMR signal. Forty microliters of the magnetic reagent were mixed with 60 µl of the diluted NNV solution in each reaction mixture
For the effect of pH and salinity on IMR signal, hydrochloric acid (5N) and sodium hydroxide (5N) solutions were prepared and used for pH adjustment of the NNV solutions to a pH range of 5–10; NNV solutions of 1 × 10⁵ TCID50/ml were then adjusted with sodium chloride (NaCl) to different salinities (0–5%). The pH of the magnetic reagent was 7.4.
The specificity of IMR for NNV was investigated using Infectious pancreatic necrosis virus (IPNV) and iridovirus (IRIDO), 2 major aquatic viruses. Three concentrations of NNV solution, 105, 103, and 0 TCID50/ml, were prepared. To investigate the interference of IPNV and IRIDO, 3 samples were prepared for each concentration of NNV solution: NNV only, NNV with 107 TCID50/ml IPNV, and NNV with 106.5 TCID50/ml IRIDO. These 3 types of samples were used in the IMR assay with an anti-NNV biofunctionalized magnetic reagent.
Immunomagnetic reduction measurement
A magnetic immunoassay analyzer g was used for the IMR measurements. The magnetic immunoassay analyzer generates magnetic fields with frequencies of tens of kilohertz to rotate magnetic nanoparticles in the reaction mixture. The χac was determined using a copper-wire pick-up coil that conducted the selected χac signals to amplifiers. The magnetic immunoassay analyzer recorded the time-dependent mixed-frequency χac (i.e., χac – t curve) after the magnetic reagent and sample were mixed. With the χac – t curve, the reduction in χac due to the association between magnetic nanoparticles and NNV can be determined.
Results
Real-time ac magnetic susceptibility signal
The time-dependent χac of IMR on NNV was detected using 101 TCID50/ml NNV solution. As shown in Figure 2, at the beginning of the real-time χac measurement, the χac signal (χac,o) of the mixture remained nearly constant (approximately 55.75). The χac signal (χac,φ) decreased to another constant (approximately 55.24) at 160 min. Furthermore, the IMR signal was calculated to be 0.96%, based on the formula IMR (%) = (χac − χac,φ)/χac,o × 100%. When 3 individual NNV solutions of the same concentration (101 TCID50/ml) were used for the time-dependent χac measurements, an IMR signal of 1.02 ± 0.06% was produced. The coefficient of variation of the IMR signal was determined to be 5.88%.
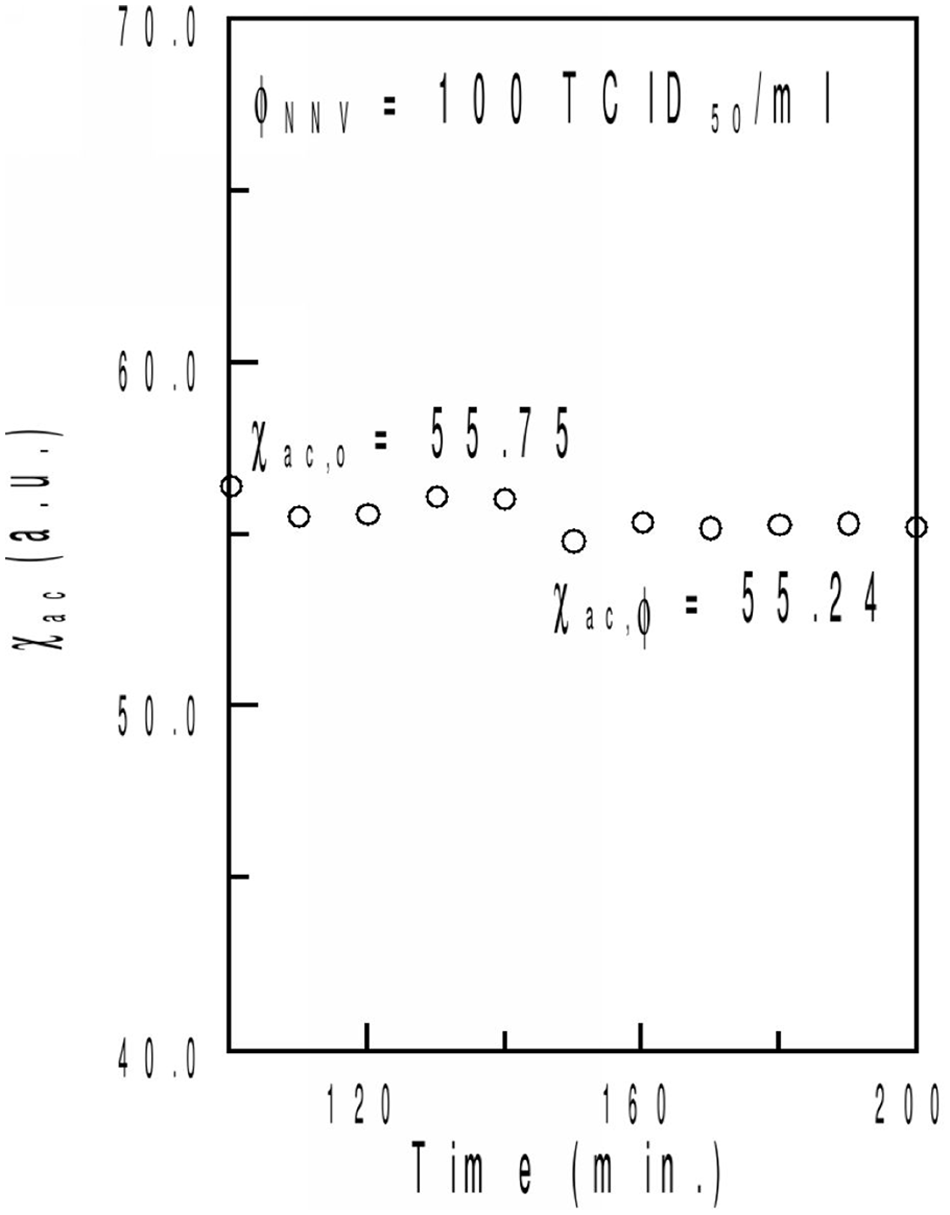
Time-dependent, alternating current magnetic susceptibility (χac) signal of the mixture of the magnetic reagent and 102 Nervous necrosis virus (NNV) TCID50/ml NNV solution at 22°C.
Immunomagnetic reduction signal versus Nervous necrosis virus concentration
The results shown in Figure 3 revealed the IMR measurements for different concentrations of NNV solutions with IMR signals. The detected NNV solutions ranged from 5–107 TCID50/ml with IMR signals increasing from 0.84% to 3.04%. The relationship between IMR signals and NNV concentration, shown in Figure 3, was found to follow a typical sigmoidal curve according to the following logistic function (eq. (1)):

where A, B, φ, and ρ are fitting parameters, and φ denotes the NNV concentration. By substituting the experimental data in Figure 3 into equation (1), A, B, φo, and ρ were determined to be 0.64, 3.41, 26684, and 0.31, respectively. The correlation factor R2 between the experimental data and equation (1) was 0.994. It is worth noting that IMR equals A at very low NNV concentrations (i.e., φ = 0). This result revealed that A in equation (1) corresponds to the noise level of the IMR signal. For the other extreme cases with very high φ values, IMR equals B. Thus, B denotes the saturated value for the concentration-dependent IMR signal.
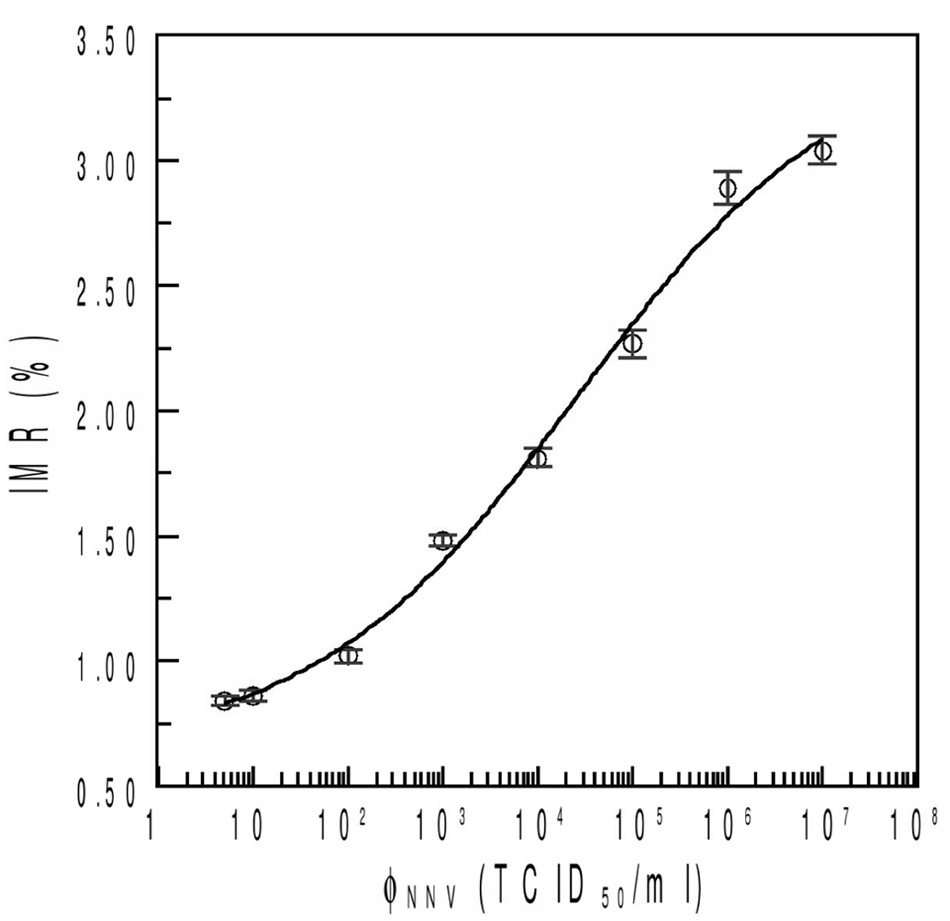
Experimental data for the relationship between immunomagnetic reduction (IMR) signal and Nervous necrosis virus (NNV) concentration. The data are fitted to the logistic function shown by the solid line.
As the NNV concentration φ is φo, the IMR in equation (1) equals (A + B)/2. This means that φo corresponds to the concentration that shows IMR at the middle point between noise level A and saturated value B. The ρ value in equation (1) relates to the collective association between magnetic nanoparticles and biomolecules. Based on this standard curve, the viral concentration could be obtained by the IMR signal.
Effects of IPNV and IRIDO on immunomagnetic reduction
When various concentrations of NNV were tested alone or in the presence of IPNV and IRIDO, those 2 viruses did not interfere with the detection of NNV (Fig. 4). It is worth noting that for the 3 samples without NNV, the IMR signals were detected to be (0.70 ± 0.04)% for solution without virus, (0.71 ± 0.04) % for 107 TCID50/ml IPNV solution, and (0.69 ± 0.05)% for 106.5 TCID50/ml IRIDO solution.
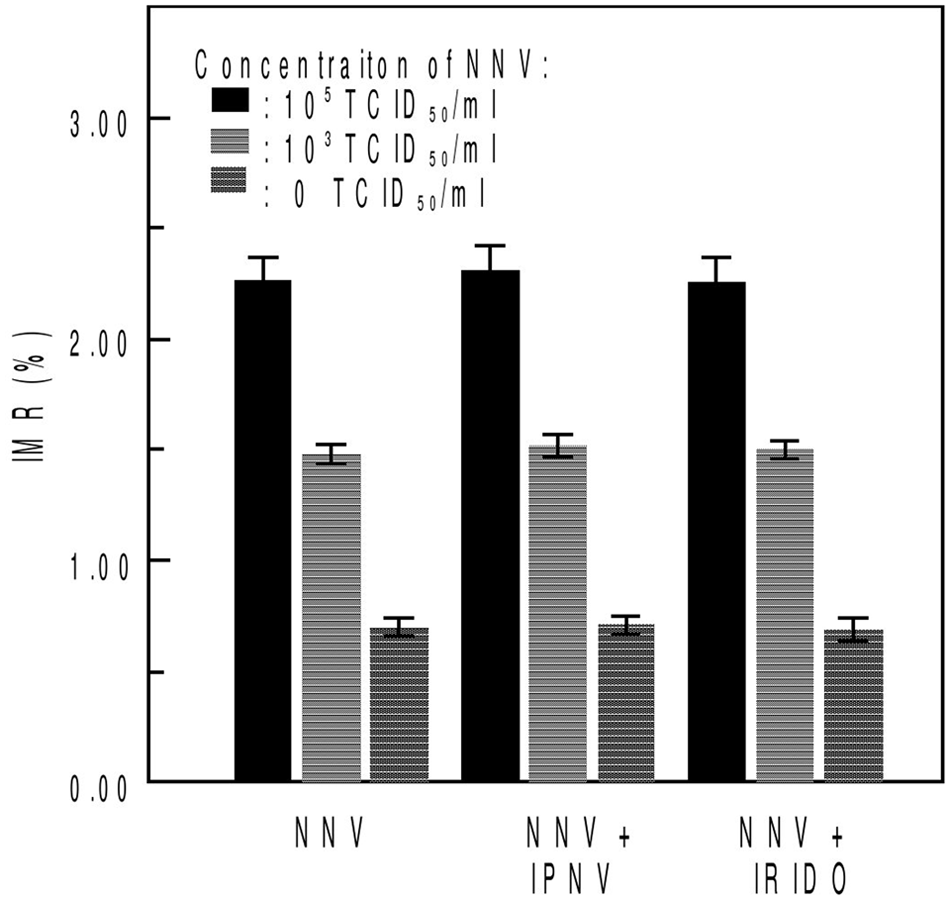
Immunomagnetic reduction (IMR) signals for Nervous necrosis virus (NNV) solution without interference of other viruses, NNV solution containing Infectious pancreatic necrosis virus (IPNV), and NNV solution containing iridovirus (IRIDO). Three concentrations of 105 TCID50/ml, 103 TCID50/ml, and 0 TCID50/ml NNV were mixed with 107 TCID50/ml IPNV and 106.5 TCID50/ml IRIDO separately.
Effects of pH and salinity on immunomagnetic reduction
The results of the experiment in which the pH value of the magnetic reagent was maintained at 7.4 and the pH values for NNV solutions were varied from 5 to 10 with 105 TCID50/ml NNV solution are presented in Figure 5. The solid bar represents the IMR signal of NNV solution at pH 7.4, whereas the IMR signals for NNV solutions at different pH values are shown by the meshed bars. All of the IMR signals in Figure 5 were approximately 2.25 ± 0.07%, which leads to a coefficient of variation of 0.31%. Regarding salinity, the IMR signal for the 105 TCID50/ml NNV solution was 2.27 ± 0.11%, as shown by the solid bar in Figure 6. The NNV solutions with 0.5%, 1%, 2%, 3%, and 4% NaCl produced IMR signals of 2.12%, 2.16%, 2.12%, 2.16%, and 2.19%, respectively, as shown by meshed bars in Figure 6.
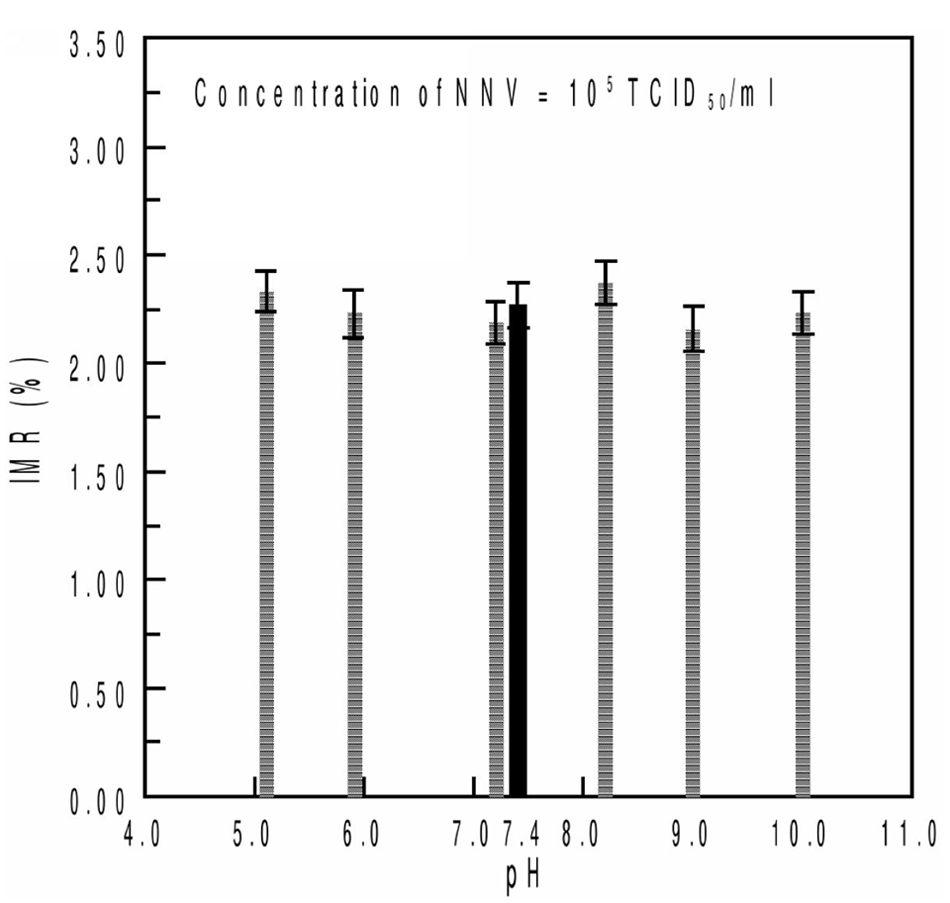
Immunomagnetic reduction (IMR) signals for Nervous necrosis virus (NNV) solutions with pH values ranging from 5 to 10. The concentration of NNV solution used in the experiment was 105 TCID50/ml.
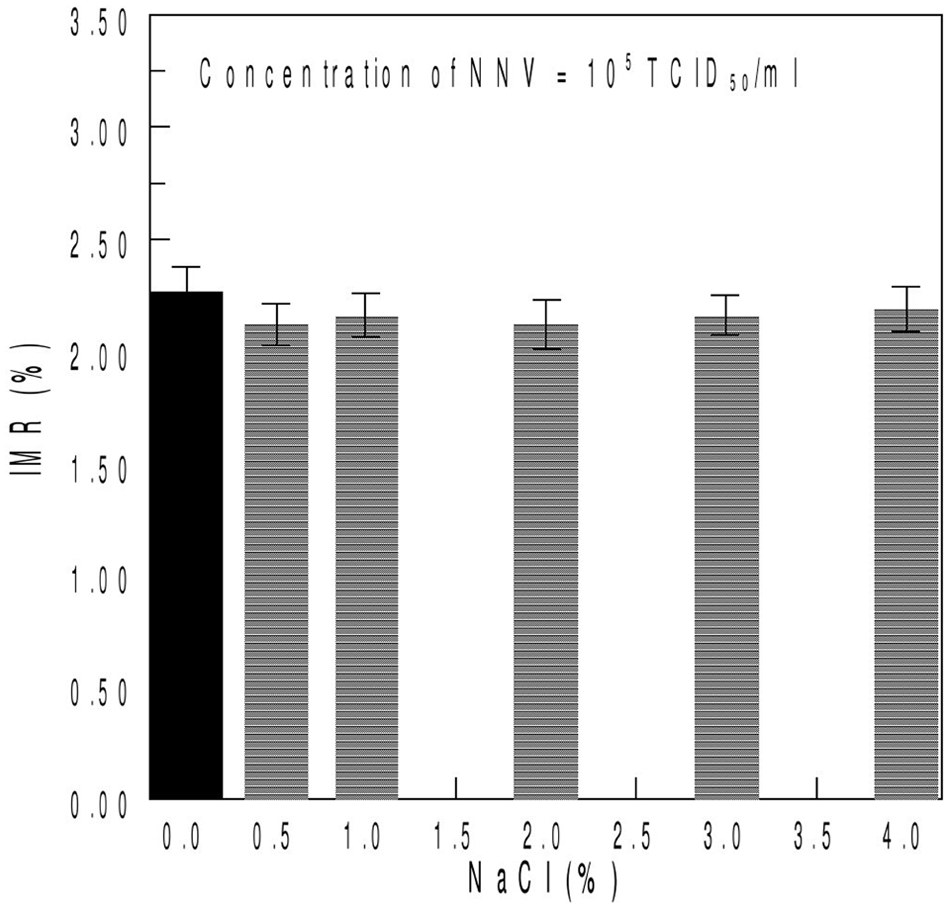
Immunomagnetic reduction (IMR) signals for Nervous necrosis virus (NNV) solutions with 0–5% NaCl. The concentration of NNV solution used in the experiment was 105 TCID50/ml.
Discussion
Nervous necrosis virus and iridovirus are highly infectious aquatic viruses in grouper culture, mainly at the larval and juvenile stages. Vaccination is as an important prevention strategy for viral infections. However, due to the unavailability of a commercial vaccine, viral surveillance has assumed an important role in disease management in commercial aquaculture industry. Currently, methods for NNV detection include ELISA,2,14 dot blotting,17,26 RT-PCR,14,33 real-time RT-PCR, 8 and in situ hybridization.13,28 However, these methods have limitations, due to high technical skill or low sensitivity. For example, the maximum sensitivity that can be achieved with real-time RT-PCR is approximately 101 TCID50/ml virus titer, whereas standard RT-PCR provides 102 TCID50/ml viral titer. 6 Moreover, ELISA or cell culture can only detect viral titers exceeding 104 TCID50/ml, and false negatives are likely to occur, especially during the early stage of infection. In terms of processing time, ELISA can be completed within 1–2 hr, whereas RT-PCR or real-time RT-PCR coupled with RNA extraction requires approximately 4 hr to complete. By comparison, the IMR assay is relatively uncomplicated and requires only 2–3 hr of reaction time. Importantly, the immune complex NNV-anti-NNV antibody-dextran-magnetic particle could be incubated at room temperature.
Interdisciplinary cooperation is beneficial for development of a new virus detection platform system. Although magnetic beads are often used for virus detection,16,24 the current study developed a magnetic reduction method for detecting an aquatic virus. From the results shown in Figure 3, there is no significant difference between IMR signals for 5 TCID50/ml and 101 TCID50/ml. However, the IMR signal for 102 TCID50/ml showed a significant difference from 101 TCID50/ml. This implies that the low detection limit in NNV using IMR is 101–102 TCID50/ml. The limitation of detection of IMR in NNV concentration is referred as to the value showing an IMR signal that is higher than the lowest IMR signal by 3 times standard deviation. The result showed that the IMR signal for 101 TCID50/ml is 0.86% and the standard deviation is 0.02%. Thus, the low detection limit in TCID50/ml should correspond to the value of 0.92% for the IMR signal. In Figure 3, the NNV concentration corresponding to 0.92% IMR signal is 101.38 TCID50/ml. Therefore, the low detection limit for NNV in IMR is 101.38 TCID50/ml. This sensitivity is similar with real-time RT-PCR. 6
The specificity of the assay described herein was confirmed by the lack of interference reactions between NNV and iridovirus or IPNV in the solution, which is shown in Figure 4. Because NNV primarily infects marine fish, environmental factors should be considered to ensure the platform stability. The salinity and pH value of seawater are vastly different than those of the PBS system. For the different pH environments, which ranged from 5 to 10, the NNV solutions had similar signals in IMR measurements. In the salinity test, the results indicated that the IMR measurements are almost identical to NNV solutions with NaCl concentrations below 5%. In the current study, the stability of the newly developed magnetic bead system under different pH and salinity conditions was demonstrated and a set of simple and easy standard operating procedures that can be used in practical applications was developed.
Footnotes
Acknowledgements
The authors thank Dr. Pinwen Peter Chiou for editing this manuscript.
a.
Leibovitz’s L-15 medium, GIBCO, Invitrogen Corp., Carlsbad, CA.
b.
pQE30 vector, Qiagen GmBH, Hilden, Germany.
c.
Corning Inc., Corning, NY.
d.
Goat anti-rabbit IgG antibody conjugated with HRP, Chemicon International Inc., Temecula, CA.
e.
SureBlue TMB 1-Component Microwell Peroxidase Substrate, Kirkegaard & Perry Laboratories, Gaithersburg, MD.
f.
MF-DEX-0060, MagQu Co. Ltd., New Taipei City, Taiwan.
g.
Magnetic immunoassay analyzer (XacPro-E101), MagQu Co. Ltd., New Taipei City, Taiwan.
Declaration of conflicting interests
The author(s) declared no potential conflicts of interest with respect to the research, authorship, and/or publication of this article.
Funding
The author(s) disclosed receipt of the following financial support for the research, authorship, and/or publication of this article: The authors are grateful to the National Council of Science (NSC98-2324-B-019-003-CC1 and NSC99-2324-B019-001-CC1) and the Council of Agriculture (98AS-1.1.2-F-F1(1)) for financial support.