
Abstract
Although numerous diagnostic tests are available to identify cattle persistently infected (PI) with Bovine viral diarrhea virus (BVDV) in cow–calf herds, data are sparse when evaluating the economic viability of individual tests or diagnostic strategies. Multiple factors influence BVDV testing in determining if testing should be performed and which strategy to use. A stochastic model was constructed to estimate the value of implementing various whole-herd BVDV cow–calf testing protocols. Three common BVDV tests (immunohistochemistry, antigen-capture enzyme-linked immunosorbent assay, and polymerase chain reaction) performed on skin tissue were evaluated as single- or two-test strategies. The estimated testing value was calculated for each strategy at 3 herd sizes that reflect typical farm sizes in the United States (50, 100, and 500 cows) and 3 probabilities of BVDV-positive herd status (0.077, 0.19, 0.47) based upon the literature. The economic value of testing was the difference in estimated gross revenue between simulated cow–calf herds that either did or did not apply the specific testing strategy. Beneficial economic outcomes were more frequently observed when the probability of a herd being BVDV positive was 0.47. Although the relative value ranking of many testing strategies varied by each scenario, the two-test strategy composed of immunohistochemistry had the highest estimated value in all but one herd size–herd prevalence permutation. These data indicate that the estimated value of applying BVDV whole-herd testing strategies is influenced by the selected strategy, herd size, and the probability of herd BVDV-positive status; therefore, these factors should be considered when designing optimum testing strategies for cow–calf herds.
Introduction
Bovine viral diarrhea virus (BVDV; family Flaviviridae, genus Pestivirus) is an endemic disease of U.S. beef herds, with the potential to manifest in numerous pathways. The virus has been observed to adversely affect cow–calf herds by inflicting reproductive wastage, 22,40,41,43 elevating the incidence of morbidity and mortality, 22,39,42,43 and reducing weaning weight. 43 One unique aspect of BVDV is its carrier state, which consists of cattle persistently infected (PI) with the virus. Persistent infection in cattle occurs by in utero exposure to BVDV between gestation days 42 and 125. 29 Upon parturition, the animals shed the virus in all bodily secretions and excretions, thereby increasing the risk of exposing non-PI cattle to BVDV. 3,9,11,29 One primary goal of BVDV control programs is to identify and eliminate PI animals from the herd. 14,24-26 Because of the nature of this disease, the cow–calf operation is the earliest stage in the industry where PI cattle can be identified.
Given the negative effects associated with BVDV and the economic ramifications associated with the presence of BVDV, numerous testing modalities have been developed to identify PI cattle. Testing methods include immunohistochemistry (IHC) on formalized skin tissue, 4,5,10,15,32,41 antigen-capture enzyme-linked immunosorbent assay (ACE) on the phosphate buffered saline (PBS) solution fraction of PBS-soaked skin tissue, 5,7,10,17,23 and real-time reverse transcription polymerase chain reaction (real-time RT-PCR) performed on fresh skin tissue (Reinauer S, Moesslacher G, Schoder G, et al.: 2007, Evaluation of the AnDiaTec Bovir real-time RT-PCR kit for the detection of BVDV in pooled bovine ear notch and blood samples. In: Proceedings of the AAVLD 50th Annual Conference, p. 66. Reno, NV). Although these tests are relatively accurate at discerning PI and non-PI cattle, very little data exist for comparison of test strategies (i.e., single-test vs. two-test protocols interpreted in series).
Current recommendations suggest that a whole-herd testing protocol should be instituted for cow–calf herds that are at high risk of being positive for BVDV so to identify and eliminate all PI cattle. 24,26 Despite a number of reports in the literature that associate BVDV negatively with health and production, 16,22,28,34,39,42,43 a moderate body of literature reports no adverse effects among cattle exposed to PI animals in both the cow–calf and feedlot sectors of the beef industry. 2,8,33 In addition, the herd prevalence of PI cattle among cow–calf herds in the United States has previously been shown to be ≤ 10%, which indicates that the majority of beef herds in the United States do not possess PI cattle (U.S. Department of Agriculture [USDA]: 2009, Persistent infection of calves with bovine viral diarrhea virus on U.S. beef cow-calf operations. USDA, Animal Plant Health and Inspection Service, Veterinary Services, Fort Collins, CO. Available at http://www.aphis.usda.gov/animal_health/nahms/beefcowcalf/downloads/beef0708/Beef0708_is_BVD_PI.pdf. Accessed on November 18, 2010). 43,44 Therefore, given the large variation in clinical outcomes upon exposure to PI cattle and that very few herds within the United States are BVDV positive, the economic viability of whole-herd testing programs has been questioned.
Numerous European countries have instituted national BVDV eradication programs within the last 2 decades (Alenius S, Jacobsson SO, Cafaro E: 1986, Frequency of bovine viral diarrhoea virus infections in Sweden among heifers selected for artificial insemination. In: Proceedings of the 14th World Congress on Disease, pp. 204–207. Dublin, Ireland). 1,27,31 Yet, the economic justification for implementing widespread whole-herd BVDV cow–calf testing and eradication programs has not been evaluated. In addition, herd size and the probability that a given herd is BVDV positive (i.e., herd prevalence) may impact the value of whole-herd testing protocols. The relative economic value of individual BVDV testing strategies also may vary because of inherent variation in the cost and accuracy of currently offered tests when applied individually or sequentially. The objective of the current study was to determine the relative economic value of various whole-herd BVDV cow–calf testing strategies among different herd sizes and expected probabilities of herd positive status by using a Monte Carlo simulation.
Materials and methods
The general research approach was to estimate the economic value of implementing a variety of common whole-herd BVDV testing strategies in spring calving beef cow–calf herds for 3 herd sizes and 3 prevalence levels. Such a goal was achieved through creation of a Monte Carlo spreadsheet model, which estimated the gross income in a cow–calf herd based on probability distributions of known performance variables and the probability that the herd was BVDV positive. Within each model iteration, the gross income from the cow–calf herd was estimated over a 2-year period by either applying or not applying the testing strategy. The outcome variable of interest was the economic value of the testing strategy, which was calculated by subtracting the estimated gross revenue when the test strategy is not applied from the estimated gross revenue or when the testing strategy was applied within the modeled herd.
Testing modalities evaluated in the simulation model to quantify the value of implementing whole-herd Bovine viral diarrhea virus testing strategies in beef cow–calf herds.*
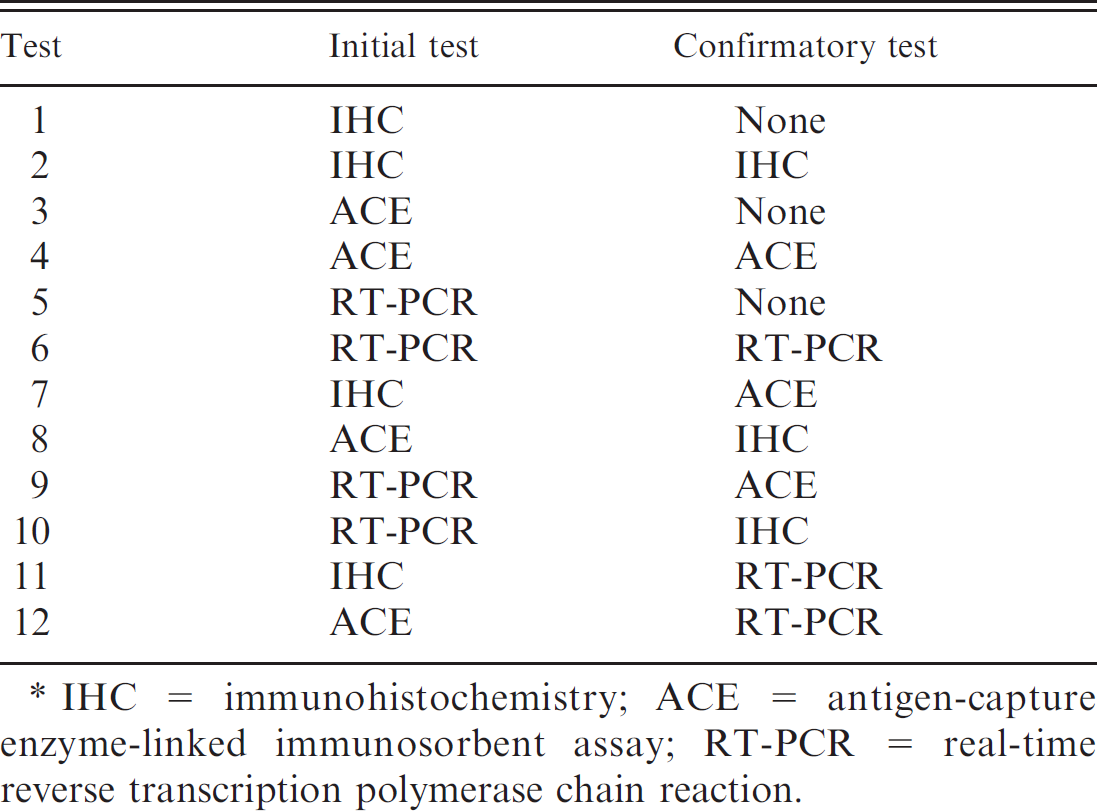
IHC = immunohistochemistry; ACE = antigen-capture enzyme-linked immunosorbent assay; RT-PCR = real-time reverse transcription polymerase chain reaction.
Model structure
The value of testing for PI cattle was estimated by incorporating 3 commonly performed BVDV diagnostic tests (IHC, ACE, and real-time RT-PCR) into 12 different testing strategies analyzed as either a single-test (3) or two-test strategy (9) applied sequentially and interpreted in series (Table 1). Three different herd sizes (50, 100, and 500 breeding females) were used to represent the typical range in cow–calf operational sizes within the United States.
Each BVDV testing protocol was applied at 3 herd prevalence (or probability of BVDV-infected herd) values (7.7%, 19%, 47%) selected from previous literature (USDA: 2009, Persistent infection of calves with bovine viral diarrhea virus on U.S. beef cow-calf operations) 43,44 to represent a range of realistic herd BVDV prevalence. Likewise, these values also represent the probability (0.077, 0.19, and 0.47) that any given herd within the population is BVDV positive. Separate simulations were performed for each testing strategy and herd prevalence permutation in each respective herd size.
Baseline distributions (i.e., non-BVDV associated) for health and performance parameters that consisted of preweaning morbidity (U.S. Department of Agriculture [USDA]: 1997, Part II: reference of 1997 beef cow-calf health & health management practices. USDA, Animal Plant Health and Inspection Service, Veterinary Services, Fort Collins, CO. Available at http://hdl.handle.net/10113/33420. Accessed on November 18, 2010), health costs of morbid cattle, 18,35,36 preweaning mortality (Standard Performance Analysis [SPA]: 2000, 2000 North and South Dakota herds. ISU Veterinary Medicine Class VCS 436X. Iowa State University Extension, Ames, IA; SPA: 2000, 2000 summary: Iowa beef cow business record. Iowa State University Extension, Ames, IA; SPA: 2001, 2001 SPA Summary: Iowa, Illinois, Kentucky, and Michigan. Iowa State University Extension, Ames, IA; SPA: 2002, 2002 SPA summary: Iowa & Illinois combined. Iowa State University Extension, Ames, IA; SPA: 2003, 2003 SPA summary: Iowa, Illinois, Kentucky, and Michigan. Iowa State University Extension, Ames, IA; SPA: 2005, 2005 SPA summary: Iowa & Illinois combined. Iowa State University Extension, Ames, IA; USDA: 1997, Part II: Reference of 1997 beef cow-calf health & health management practices), weaning weight (USDA: 2008, Beef 2007–08, Part I: Reference of beef cow-calf management practices in the United States, 2007–08. USDA, Animal Plant Health and Inspection Service, Veterinary Services, Fort Collins, CO. Available at http://www.aphis.usda.gov/animal_health/nahms/beefcowcalf/index.shtml. Accessed on November 18, 2010), and cull cow percentages (USDA: 1997, Part III: reference of 1997 beef cow-calf production management and disease control. USDA, Animal Plant Health and Inspection Service, Veterinary Services, Fort Collins, CO. Available at http://purl.umn.edu/32744. Accessed on November 18, 2010) were determined from distributions compiled from available literature (Table 2). The same modeled estimates for health and production were used in both years of the model to ensure that these 2 years were not independent of one another but were correlated, as would be expected in a herd from one year to the next. For example, given the distribution of weaning weights in Table 2 (and the random method sampling of a Monte Carlo simulation), failing to correlate weaning weights in both years could presumably allow for vast (and, therefore, unlikely) differences in the average weaning weights from one year to the next, regardless of BVDV prevalence or testing strategy.
Input distributions for baseline herd-level factors used in the simulation model to quantify the value of implementing whole-herd Bovine viral diarrhea virus (BVDV) testing strategies in beef cow–calf herds.*
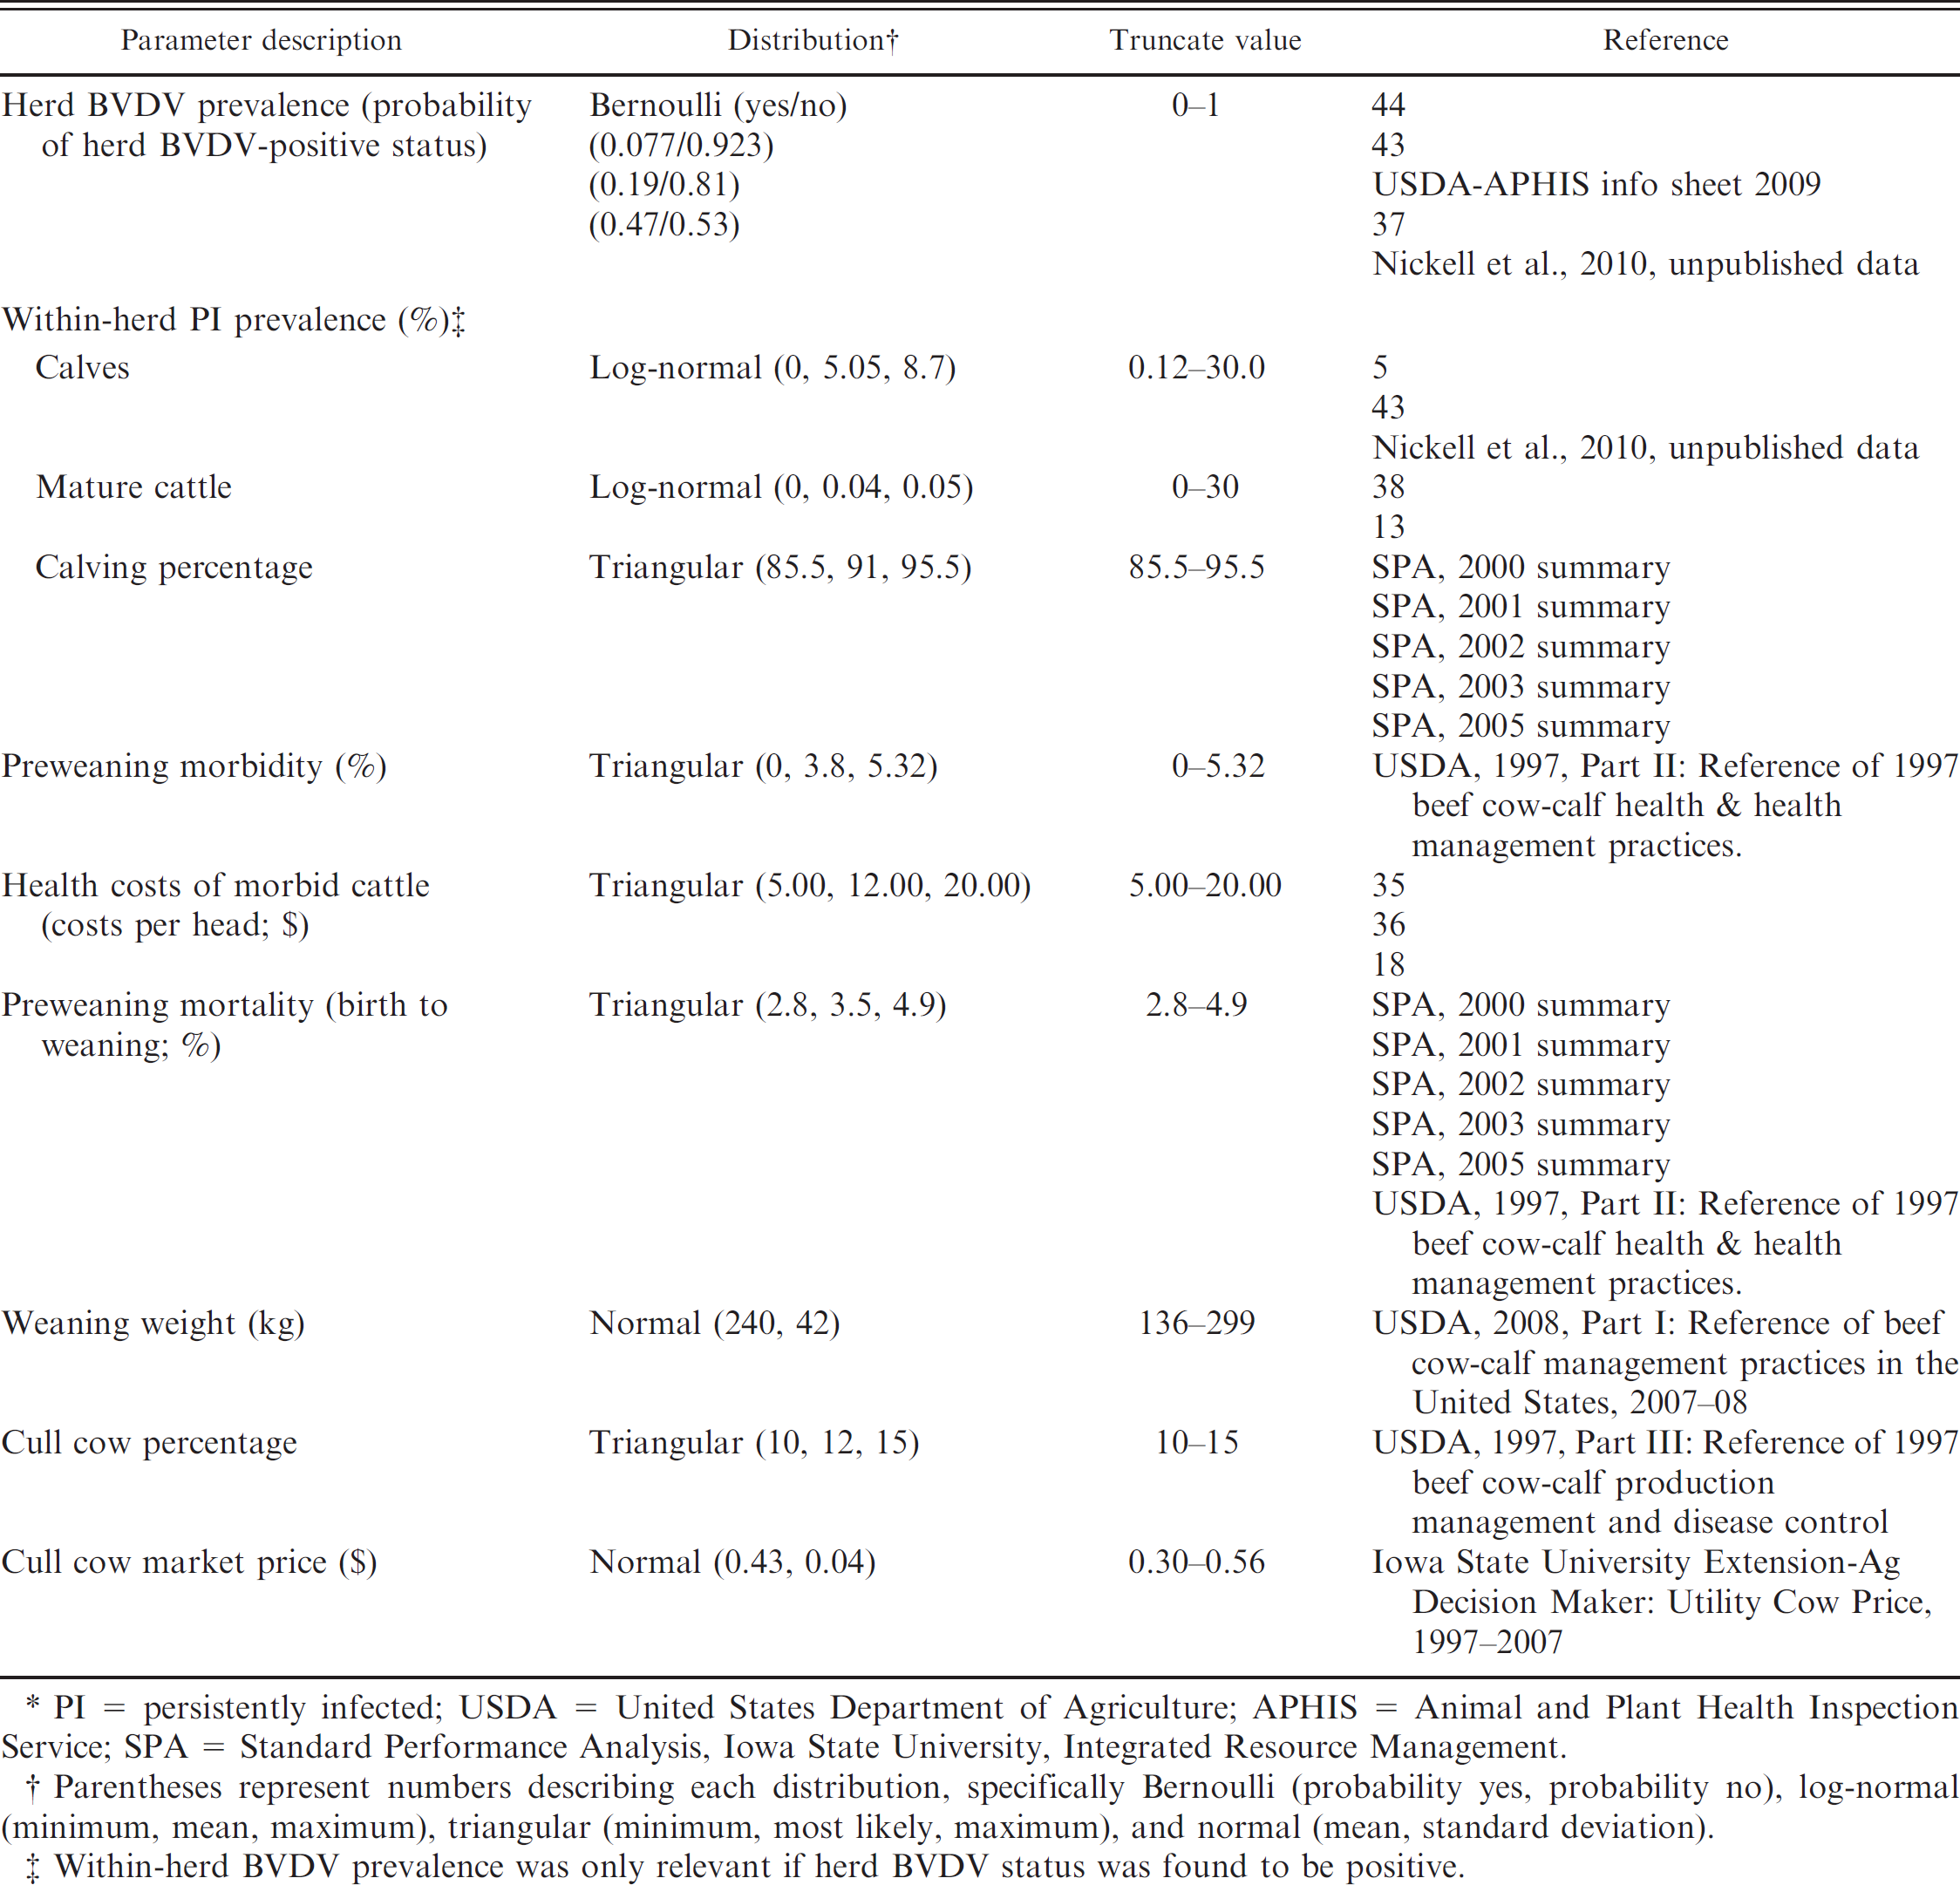
PI = persistently infected; USDA = United States Department of Agriculture; APHIS = Animal and Plant Health Inspection Service; SPA = Standard Performance Analysis, Iowa State University, Integrated Resource Management.
Parentheses represent numbers describing each distribution, specifically Bernoulli (probability yes, probability no), log-normal (minimum, mean, maximum), triangular (minimum, most likely, maximum), and normal (mean, standard deviation).
Within-herd BVDV prevalence was only relevant if herd BVDV status was found to be positive.
Input distributions describing additional health effects inflicted by Bovine viral diarrhea virus (BVDV) infection in cattle used in the simulation model to quantify the value of implementing whole-herd BVDV testing strategies in beef cow–calf herds.*
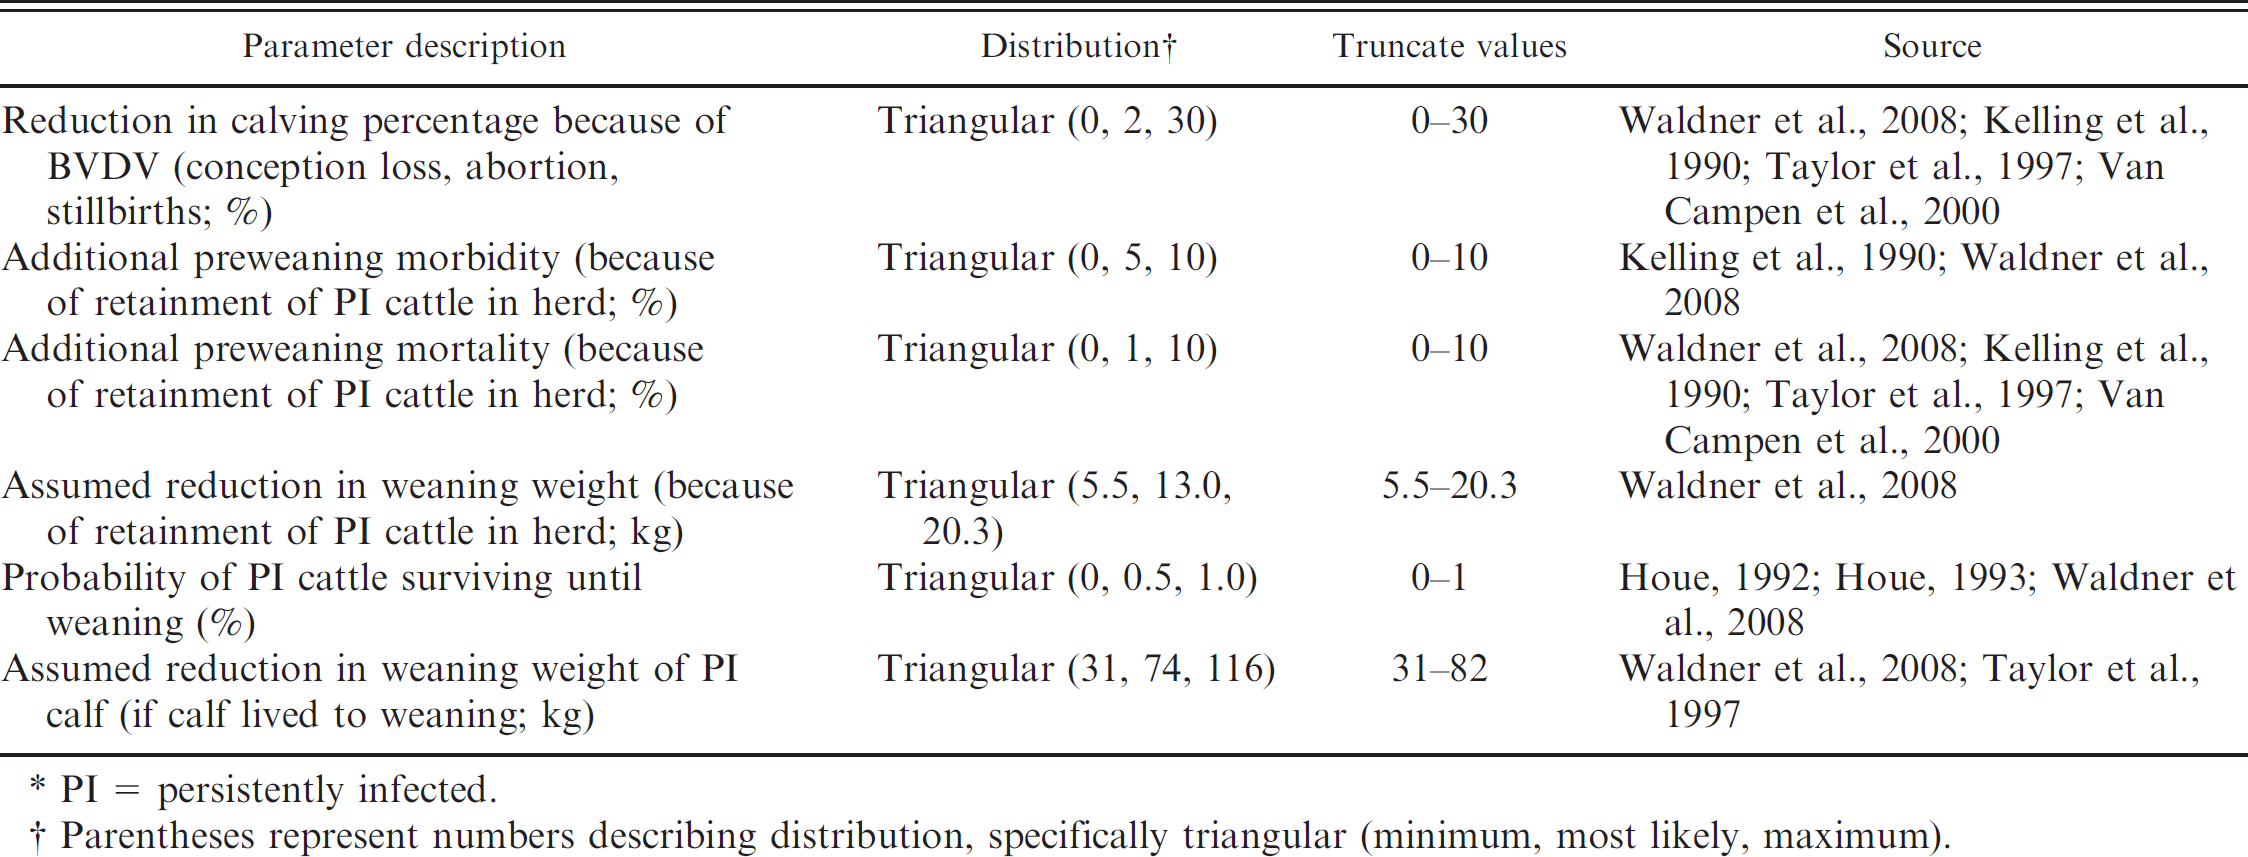
PI = persistently infected.
Parentheses represent numbers describing distribution, specifically triangular (minimum, most likely, maximum).
Market prices for weaned cattle and cull cows were based on a 10-year average (1999–2009) for 249.5-kg steers ($110/45.4 kg [$110/cwt]) and utility cow price ($43/45.5 kg [$43/cwt]), respectively (Table 2; Lawrence J: 2009, Historic cattle prices. Ag Decision Maker. Iowa State University Extension, Ames, IA. Available at http://www.extension.iastate.edu/agdm/livestock/html/b2-12.html. Accessed on November 23, 2010). For weaned cattle, a price slide of $0.05/0.45 kg was implemented, whereas, all cull cows were classified as utility grade. The feeder calf price slide is an adjustment of the sale price based on calf weight, and the slide mirrors market conditions with the price per kilogram of calf sold decreasing as calf weight increases. The bull to cow ratio was assumed to be 1 bull for every 20 females, regardless of herd BVDV status (United States Department of Agriculture [USDA]: 2008, Beef 2007–08, Part III: changes in the U.S. beef cow-calf industry, 1993–2008. USDA, Animal Plant Health and Inspection Service, Veterinary Services, Fort Collins, CO. Available at http://www.aphis.usda.gov/animal_health/nahms/beefcowcalf/index.shtml. Accessed on November 18, 2010).
The within-herd BVDV prevalence (for both calves and mature animals (White BJ, Larson RL, Thomson DU: 2007, Mature open cows are rarely persistently infected with bovine viral diarrhea virus. Beef Cattle Research, pp. 30–32. Available at http://krex.k-state.edu/dspace/bitstream/2097/2435/1/cattle07pg30-32.pdf. Accessed on November 18, 2010) 5,13,37,43 was modeled based on estimates from prior data (Table 2). For each simulation, if the herd was negative for BVDV, the within-herd BVDV prevalence was forced to be 0%, and the year 1 calving percentage was determined from the baseline distribution (Table 2). Conversely, if the herd was deemed to be BVDV positive, then the initial calving percentage in year 1 (determined from the aforementioned distribution) was subsequently modeled to be reduced because of PI cattle being in contact with pregnant cattle during the previous gestational period (Table 3). 22,40,42,43 Therefore, the overall calving percentage in BVDV-positive herds was calculated by subtracting the modeled reduction in calving attributed to BVDV from the modeled baseline calving percentage. The number of open cows at the beginning of year 1 (for both BVDV-positive and BVDV-negative herds) was then calculated by subtracting the number of live calves from the original herd size (i.e., 50, 100, or 500 breeding females). Income calculated based on the performance of this herd was used as the baseline for comparison with the estimated herd income after test strategy application.
After baseline calculations, the impact of applying the selected BVDV testing strategy to the herd was evaluated. In the present study, a whole-herd BVDV test was defined as testing all live calves, open cows and bulls, and cows from test-positive calves. 25 Therefore, the model assumes that BVDV tests were performed on calves shortly after birth (in the spring) to remove PI cattle early in life, thereby avoiding further exposure to the cow herd during the subsequent breeding season and to the remaining calf crop during the subsequent months.
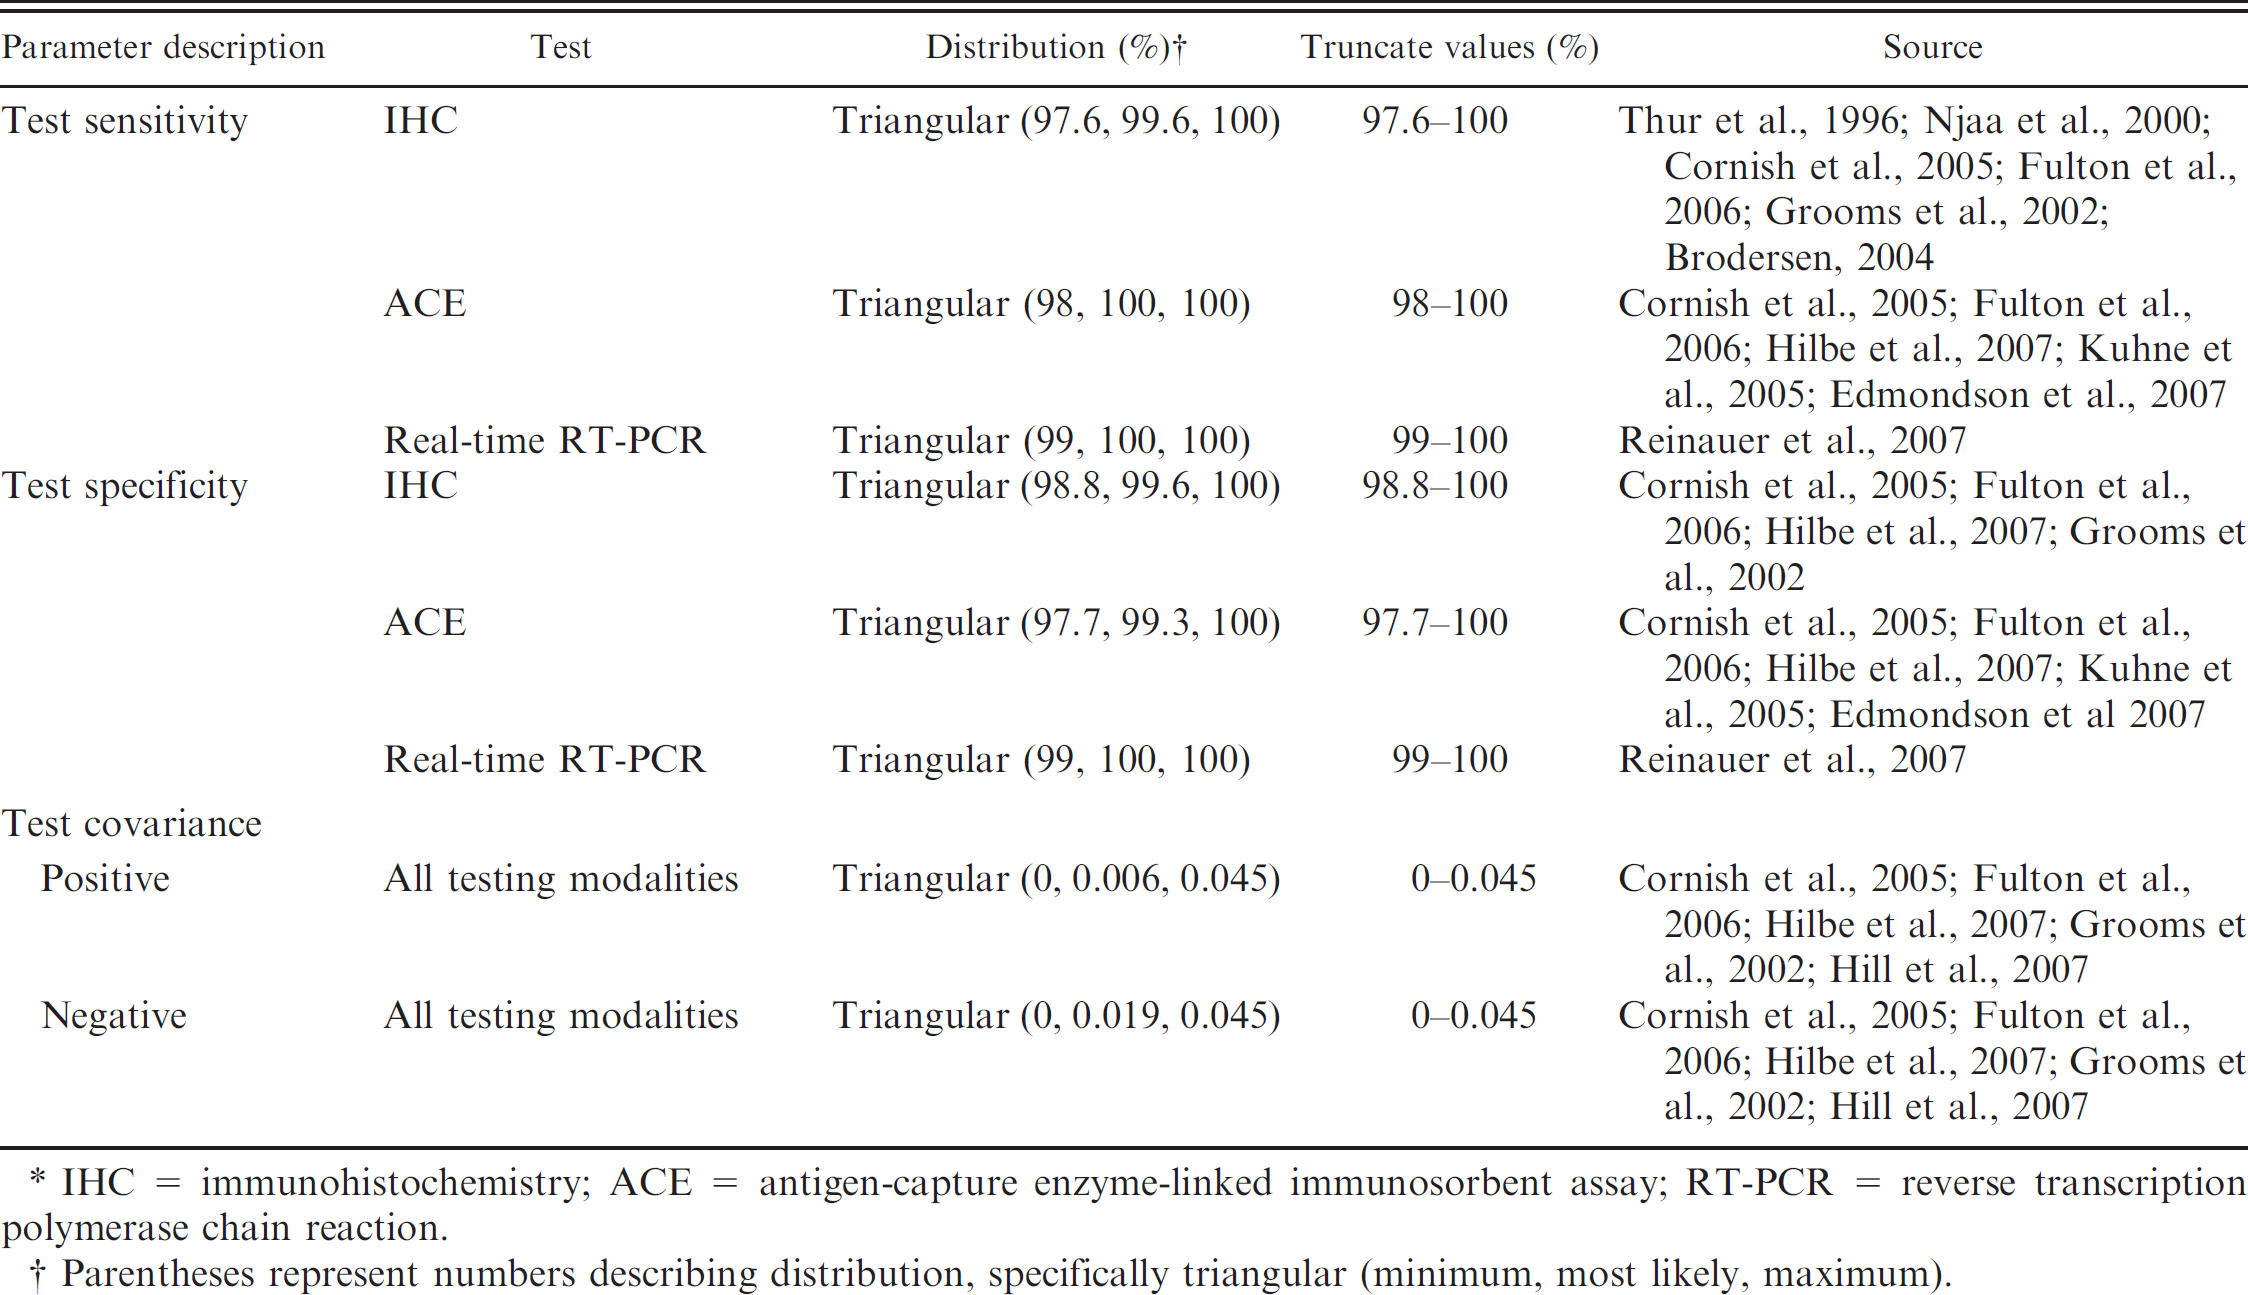
The present study evaluated 12 BVDV testing modalities that included both single- and two-test protocols (Table 1). The cost of individual BVDV tests and test setup fees were modeled as probability distributions according to prices offered by numerous veterinary diagnostic laboratories in the United States (Table 4). The fees reflect prices of individual tests as of January 1, 2010. With regard to diagnosing PI cattle in the present study, single-test protocols defined a PI diagnosis based on a single positive test result. Conversely, testing modalities that require 2 tests were applied in a sequential manner with series interpretation. Therefore, only cattle that tested positive on the initial test were evaluated by the second test; consequently, a diagnosis of PI (in a multiple test protocol) was only confirmed after both tests were positive. Diagnostic sensitivity (Se) and specificity (Sp) estimates for IHC, ACE, and real-time RT-PCR were determined from distributions gleaned from available literature (Table 5).
Input distributions regarding laboratory fees for individual Bovine viral diarrhea virus (BVDV) diagnostic tests used in the simulation model to quantify the value of implementing whole-herd BVDV testing strategies in beef cow–calf herds.*
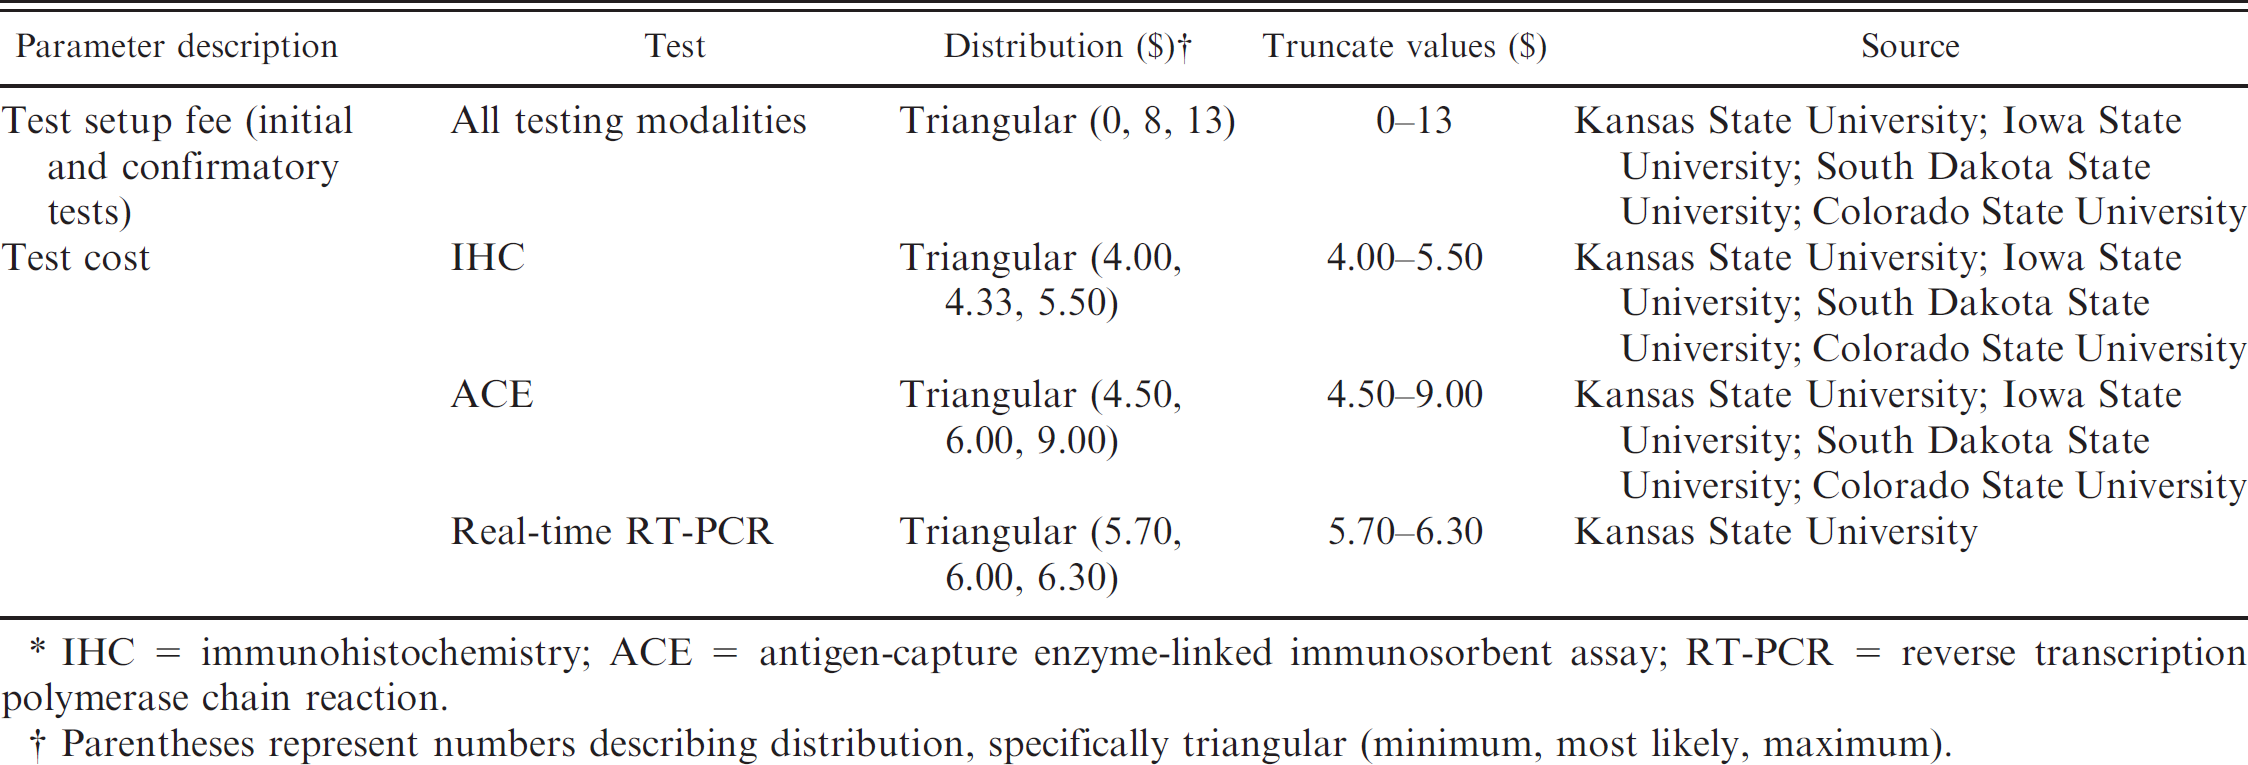
IHC = immunohistochemistry; ACE = antigen-capture enzyme-linked immunosorbent assay; RT-PCR = reverse transcription polymerase chain reaction.
Parentheses represent numbers describing distribution, specifically triangular (minimum, most likely, maximum).
In the field, performing diagnostic tests sequentially is implemented to elevate diagnostic Sp, thereby increasing the positive predictive value of the test (compared with a single-test protocol). In two-test protocols, conditional independence presumes that the outcome of the second test is independent of the initial test (regardless of the outcome of the initial test). In reality, diagnostic tests that identify similar molecules (e.g., antibodies, antigen) are biologically related; therefore, when implementing a testing strategy that uses multiple tests to detect BVDV antigen, cattle that test positive on the initial test are more likely to test positive on the confirmatory test. This lack of test independence has been previously described as test covariance. 6,12 Therefore, despite the ability of serial interpretation to increase test Sp, the augmentation may not be as vast as expected when assuming that conditional independence resides among individual tests. In the present model, covariance estimates (positive or negative) among tests in multiple testing programs were calculated from available literature and then evaluated in the model as probability distributions (Table 5). Because of the lack of available data on correlations among all test permutations evaluated in the present study, the aforementioned values calculated from the existing literature were implemented for all two-test strategies. Positive and negative covariance values were modeled to influence the Se and Sp of the confirmatory test based on dependency with the initial test.
Input distributions for individual Bovine viral diarrhea virus (BVDV) diagnostic tests used in the simulation model to quantify the value of implementing whole-herd BVDV testing strategies in beef cow–calf herds.*
IHC = immunohistochemistry; ACE = antigen-capture enzyme-linked immunosorbent assay; RT-PCR = reverse transcription polymerase chain reaction.
Parentheses represent numbers describing distribution, specifically triangular (minimum, most likely, maximum).
Based on herd BVDV status (positive or negative), within-herd prevalence, and test strategy characteristics (diagnostic Se and Sp, test covariance), the model then determined the number of true-positive (TP), false-negative (FN), false-positive (FP), and true-negative (TN) diagnoses present within each herd iteration. The economic income expected from each of these 4 classes (TP, FN, FP, TN) of animals was determined and summed to generate the overall herd revenue when applying the testing strategy. For the same herd when not applying the testing strategy, the economic values were calculated by using the above performance calculations based on true BVDV status.
Cattle of TP status (i.e., true PI animals) housed within positive herds were modeled with the probability of dying before weaning age 19,20,43 and the magnitude of a reduced weaning weight if they live (Table 3). 39,43 Therefore, the number of TP cattle that died prematurely was subtracted from the total number of weaned calves in both the testing and nontesting herds in year 1. Current recommendations suggest that test-positive cattle should be euthanized upon receipt of diagnostic test results, and the model assumed that such an event occurred. 14,25 The removal of TP cattle among testing herds changed the herd status to BVDV negative. Therefore, herds that removed all TP cattle avoided further exposing susceptible cattle to BVDV, unless FN cattle were retained (Tables 2, 3). The cost of the TP calf to the testing herd was composed of not only the individual test cost but also the loss of the projected market price that would have been realized for that respective PI animal had a diagnostic protocol not been implemented and if that calf had lived long enough to be sold (as was observed in the nontesting herd). Herds that did not test for BVDV (and, therefore, did not know individual animal BVDV status) did not incur the cost of euthanizing TP animals, because they would have sold cattle of TP status that lived to weaning.
If FN diagnoses (i.e., PI cattle falsely classified as negative) were observed, then these animals were assumed to be retained, thereby allowing continued BVDV exposure to the remaining cattle of the testing herd. If FN cattle were observed, then all health and production benefits realized for eliminating TP cattle (discussed above) were lost, and morbidity, mortality, weaning weights, and cull cow percentages were negatively impacted (Table 3) because BVDV remained in the herd (because of the presence of FN animals and continual BVDV exposure). For BVDV-negative herds, no cost of TP or FN cattle was ever realized.
In accordance with current recommendations for testpositive cattle, cattle determined to be of FP diagnoses were also euthanized. Therefore, the cost of FP cattle to the present herd was realized by both the test costs and the loss of income that would have been generated by that animal had that animal been correctly classified (i.e., TN status) and not euthanized. However, in contrast to TP cattle (who were modeled with the probability of being lighter at weaning), the potential market value of FP cattle equaled that of healthy cattle weaned and sold by the testing herd. Because they were euthanized, the number of FP cattle was then subtracted from the final number of weaned calves available for marketing in the testing herd only. Herds that did not test for BVDV (i.e., nontesting herds) did not incur this cost. The cost attributed to cattle correctly determined to be of TN status was modeled as the test cost of the respective test strategy. True negative cattle did not incur any further health or production costs to the herd.
To estimate the cumulative value of implementing whole-herd testing strategies in year 1 across a 2-year time frame, it was assumed that, in year 2, no BVDV testing would take place and no replacement animals were procured. The number of breeding females for both the testing and nontesting herds that entered year 2 was determined by subtracting cows found to be test positive (i.e., either TP or FP status, which was a rare event and only determined in testing herds) and cows that were culled at the end of year 1 from the original number of breeding females that entered year 1. The BVDV herd status in year 2 for herds in which a testing strategy in year 1 (i.e., testing herds) was instituted was based upon the presence or absence of FN cattle that remained in the herd during year 1. Conversely, the BVDV status of the nontesting herd in year 2 was forced to be the same as in year 1, because it was assumed that, if the nontesting herd were positive, then BVDV was carried over into the year-2 calf crop. The baseline calving percentage for both testing and nontesting herds in year 2 was forced to equal that of year 1. Herds found to be BVDV positive in year 2 (both testing and nontesting herds) had the same magnitude of reproductive, health, and performance loss that was modeled in year 1 because of the presence of BVDV (Table 3).
Application of the model. The model was conducted with a commercial Monte Carlo simulation program, a an add-in for a commercial software package. b Each herd size and testing strategy was simulated for each selected probability of BVDV-positive herd status. Each simulation included 10,000 iterations by using a fixed random number seed. Descriptive statistics were produced by the simulation program. a In all models, the cumulative value of the testing strategy across both years 1 and 2 was the outcome variable.
Sensitivity analysis
The Se of the economic outcome variable was analyzed for each permutation of testing strategy, probability of BVDV-positive herd, and herd size. Reported values convey the percentage of variance contributed by each respective input value to the outcome variable (i.e., the cumulative value of testing for BVDV across a 2-year time frame). For each of the testing strategies, the 5 largest contributors of variance were reported for each scenario.
Mean estimated values in US$ of performing whole-herd Bovine viral diarrhea virus (BVDV) tests in cow–calf herds based on true BVDV herd status and the probability of BVDV-positive herd status at herd sizes of 50, 100, and 500 heads of cattle.*
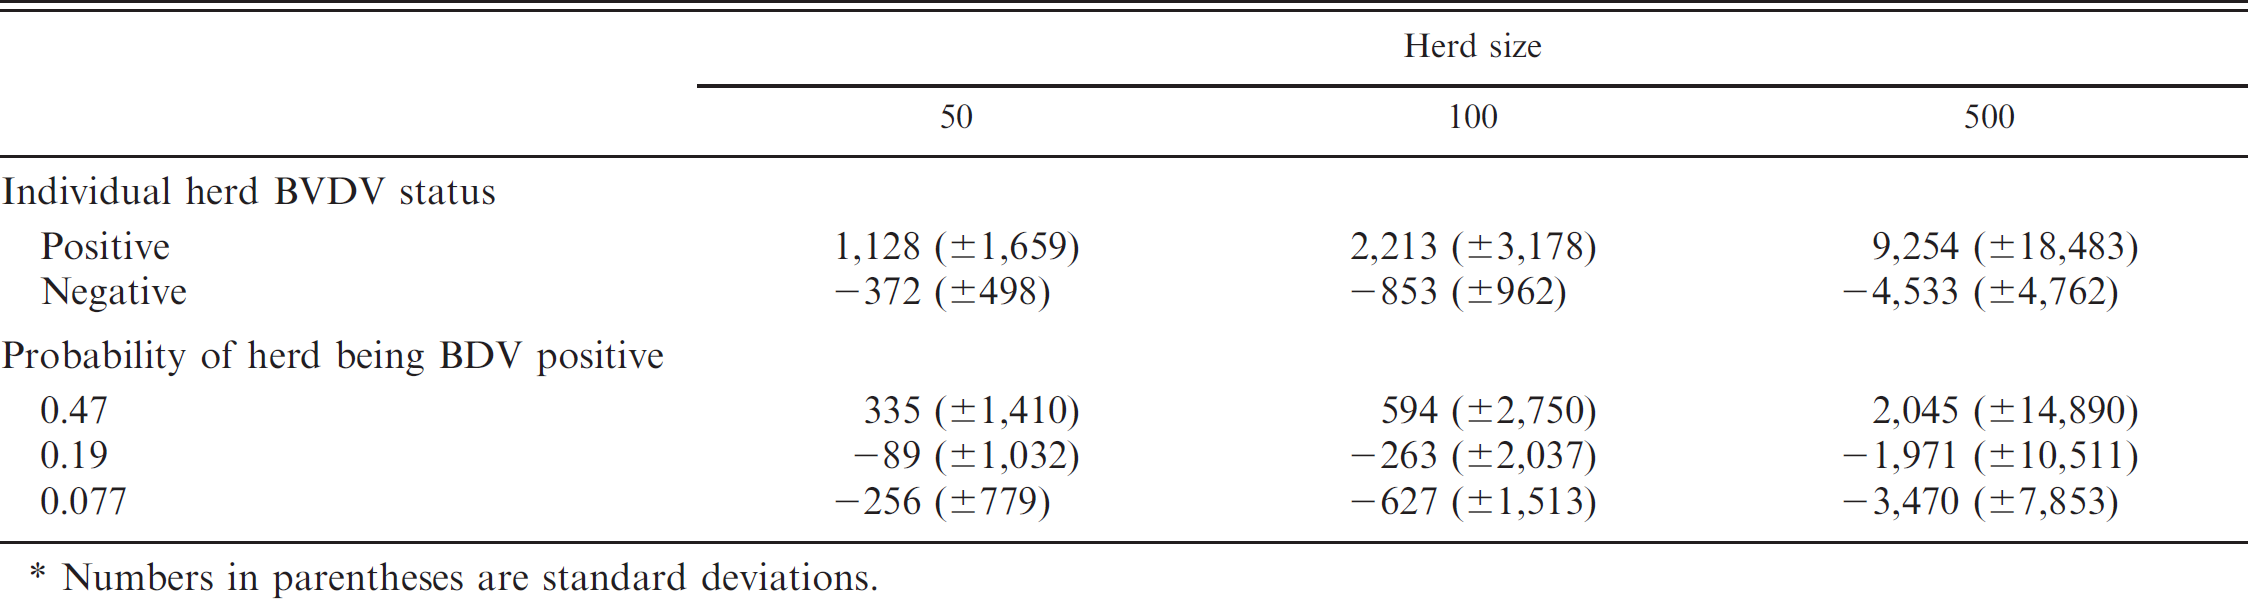
Numbers in parentheses are standard deviations.
Results
In the present study, the cumulative value of testing for BVDV across a 2-year time frame in U.S. cow–calf herds varied by BVDV test strategy, herd prevalence, and herd size. Across all testing strategies and probabilities of BVDV-positive herd status, the estimated value of testing for BVDV was always a profitable venture for BVDV-positive herds among all herd sizes (Table 6). Conversely, simulated herds that were not BVDV positive illustrated negative value of testing in all scenarios. Differences in the estimated economic value of testing were observed across all testing modalities between the 3 probabilities of BVDV-positive herd status within each respective herd size (Table 6). When averaging across all 12 test strategies, testing for BVDV when the probability of the herd being positive was high (0.47) was always an economically valid practice by the second year in each of the 3 herd sizes (Table 6). Conversely, lower probabilities of BVDV-positive herd status (0.19 and 0.077) failed to observe a profitable outcome in each of the 3 herd sizes across all testing strategies (Table 6).
The cumulative value of implementing BVDV testing strategies across a 2-year time frame varied by the predicted probability of a herd being BVDV positive within each herd size (Table 7). Across all 3 herd sizes, test 2 (initial test: IHC; confirmatory test: IHC) was observed to be the superior testing strategy in all but the lowest prevalence in the 50-head herd. Conversely, test 3 (initial test: ACE; confirmatory test: none) displayed either the poorest or was among the lowest value at each of the herd prevalences within each of the respective herd sizes (Table 7). The remaining test strategies alternated ranks, depending upon herd size and herd prevalence (Table 7). Among all herd sizes, the majority of two-test protocols displayed a positive economic outcome when the probability of BVDV-positive herd status reached 0.47. In all scenarios, single-test strategies (tests 1, 3, and 5) failed as the superior testing modality.
Mean simulated value in US$ of performing whole-herd Bovine viral diarrhea virus (BVDV) testing for each BVDV testing strategy by herd size and estimated probability of BVDV-positive herd status.
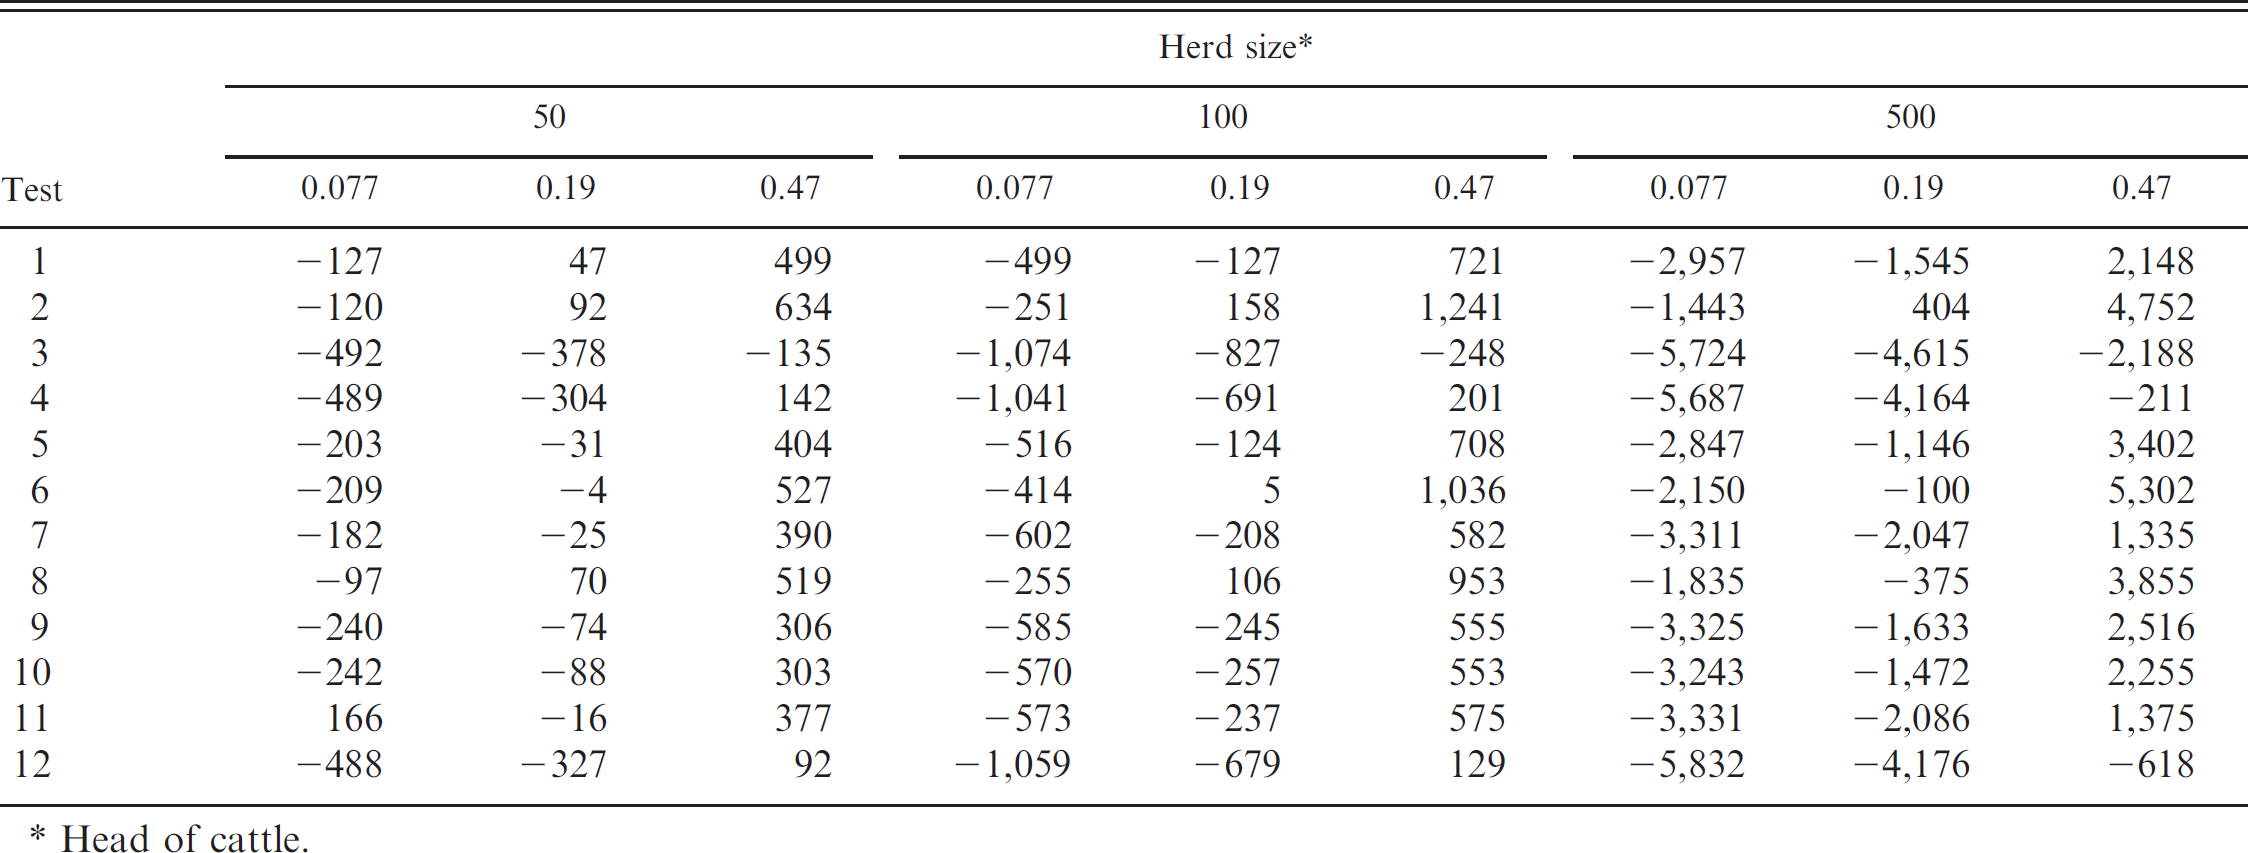
Head of cattle.
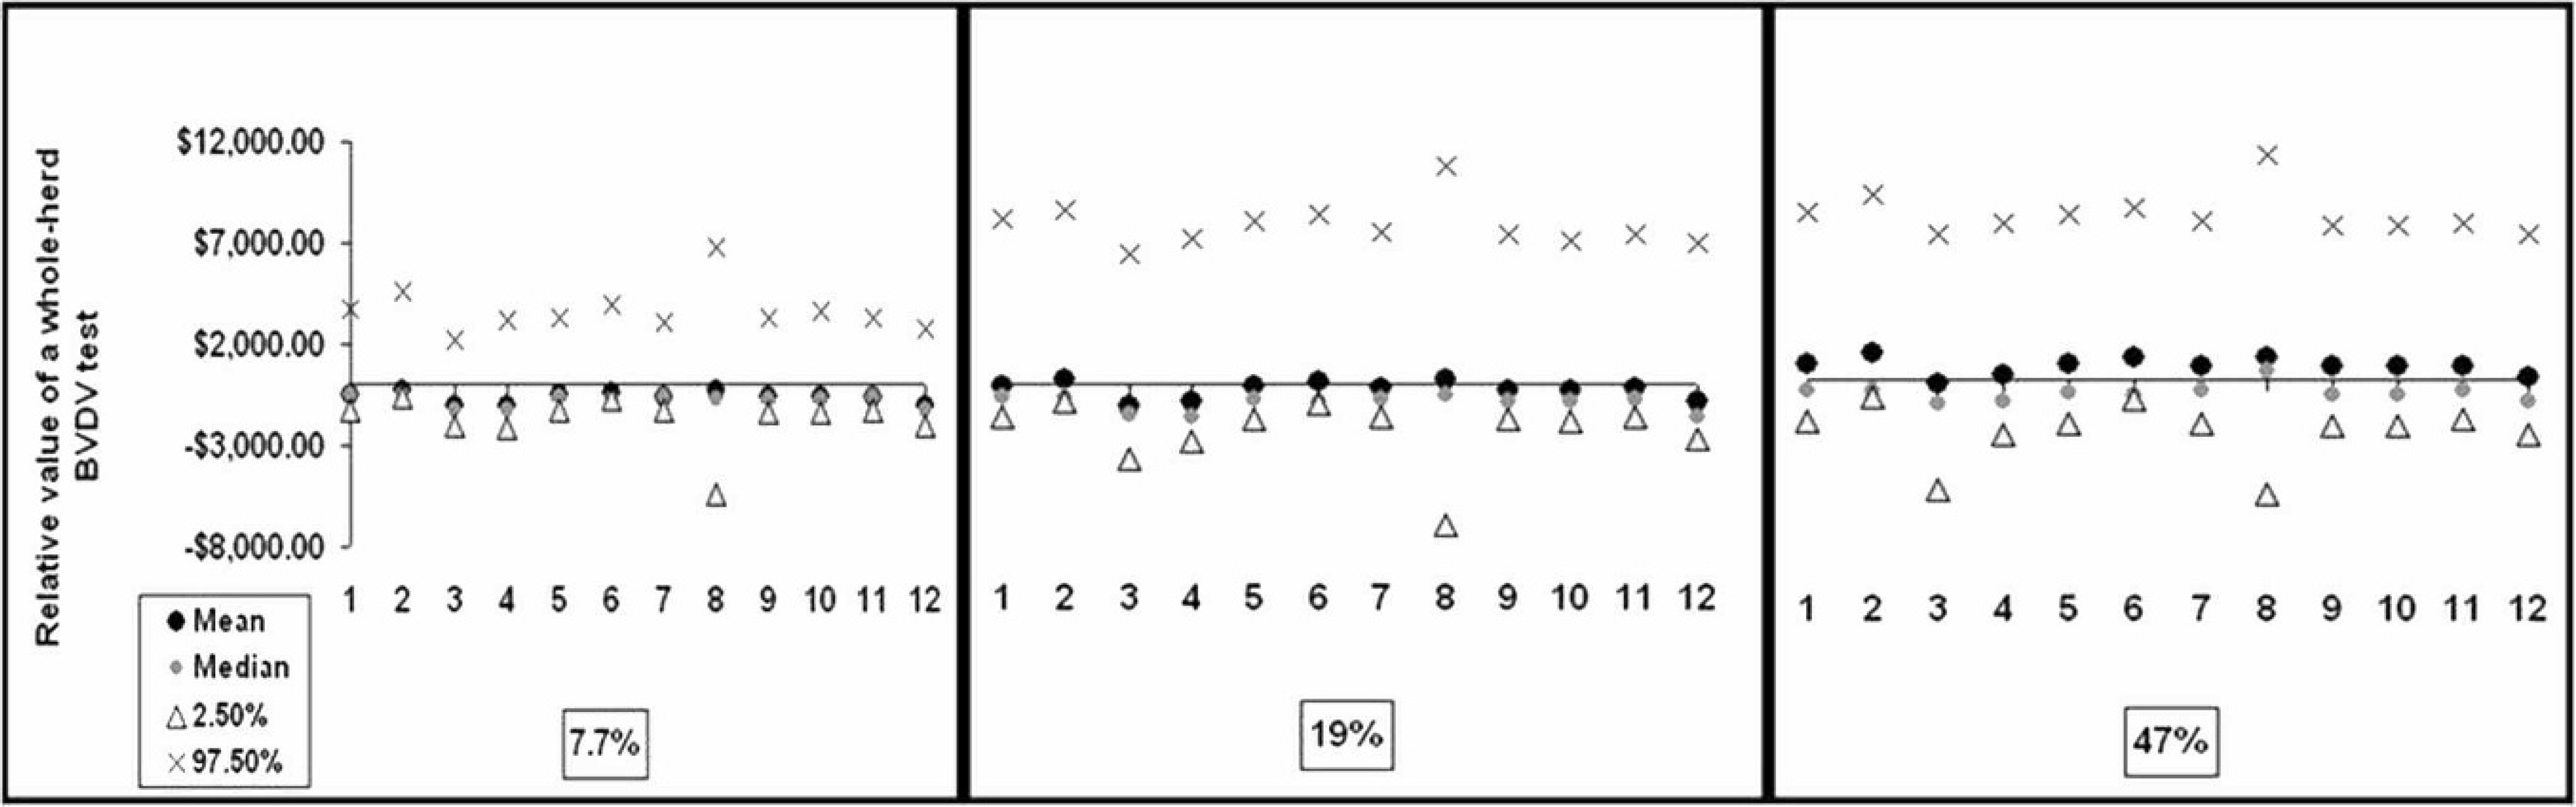
Summary statistics of the distribution of the relative value of whole-herd Bovine viral diarrhea virus (BVDV) tests (y-axis) 2 years after implementation for each of the 12 BVDV testing strategies (x-axis) in a 100 head cow beef herd at each of the 3 BVDV herd prevalences evaluated in the present study. Herd sizes of 50 and 500 cows displayed similar distributions (data not shown).
The cumulative value of implementing each respective testing strategy for each of the probabilities of BVDV-positive herd status in a 100 head beef cow herd is graphically displayed in Figure 1. Instituting whole-herd BVDV testing strategies when the likelihood of a herd being BVDV positive (or BVDV herd prevalence) is low (0.19 and 0.077 in this model) is rarely an economically beneficial endeavor. Graphical observations for herd sizes of 50 and 500 cows displayed similar results (data not shown).
Sensitivity analyses were performed for all testing strategies for each likelihood of BVDV-positive herd status among all 3 herd sizes. For illustrative purposes, Se analyses for the most favorable (test 2 [initial test: IHC; confirmatory test: IHC]) and the poorest testing strategy (test 3 [initial test: ACE; confirmatory test: none]) are displayed in Table 8. The Se analysis provides the ability to identify factors that are highly influential in the outcome. Specifically, each value reflects the percentage of variation in the outcome variable contributed by the respective parameter. The positive and negative signs indicate the correlation of each parameter with the outcome of interest; thereby suggesting that as negative (positive) parameters decrease (increase), the outcome variable increases. The top 5 contributors to the variance of the cumulative value of testing for BVDV over a 2-year period are listed. For test 2 (initial test: IHC; confirmatory test: IHC), cost of the initial test explained a vast majority of the variance across all 3 herd prevalences at each of the 3 herd sizes (Table 8). In test 3 (initial test: ACE; confirmatory test: none), diagnostic Sp of the test was the major contributor of variance for all herd prevalence levels across all 3 herd sizes (Table 8).
Discussion
The estimated cumulative economic value of implementing whole-herd BVDV testing in cow–calf herds varied across all 3 evaluated herd sizes, selected BVDV test strategies, and pretest probabilities of the herd being BVDV positive. The data are relevant, because they convey the necessity of critically evaluating the specific herd situation when considering a whole-herd BVDV testing protocol within individual beef cow–calf herds.
As expected, the model illustrated that, when herds were truly positive for BVDV, they received a benefit from implementing any testing strategy. The size of the benefit varied by testing strategy, and this impacted the overall average estimated economic return to testing based on the likelihood that the herd was BVDV positive. The data illustrate that a positive economic outcome among cow–calf herds implementing a whole-herd BVDV eradication campaign can be realized when the pretest probability of a herd being BVDV positive is relatively high (0.47 in the current study). Although the analysis of the data in the present study suggests that herds deemed to be BVDV positive demonstrate a positive economic outcome after a testing protocol is implemented (Table 6), in reality the true BVDV status of a herd is typically unknown (unless a whole-herd test is performed). Therefore, the decision to recommend a whole-herd testing strategy is heavily influenced by the probability that the respective herd possesses PI cattle.
The pretest probability that any given herd will test positive is synonymous with herd prevalence, which may vary by geographic region. Herd BVDV prevalence has been illustrated to be relatively high (25–50%) among dairy herds in the countries of Denmark, Sweden, Norway, and Germany (Alenius S, et al.: 1986, Frequency of bovine viral diarrhoea virus infections in Sweden among heifers selected for artificial insemination). 1,21,27,30 In comparison, the BVDV herd prevalence in the United States has repeatedly been shown to be ≤10% (USDA: 2009, Persistent infection of calves with bovine viral diarrhea virus on U.S. beef cow-calf operations). 43,44 Data generated from the model in the present study illustrate that, if regional prevalence is low (<10%), then testing all herds in the region will likely lead to a low average value of testing.
Sensitivity analysis for test strategies 2 and 3 at each respective herd size and probability of Bovine viral diarrhea virus (BVDV)-positive herd status in the simulation model to quantify the value of implementing whole-herd BVDV testing strategies in beef cow–calf herds (%).*
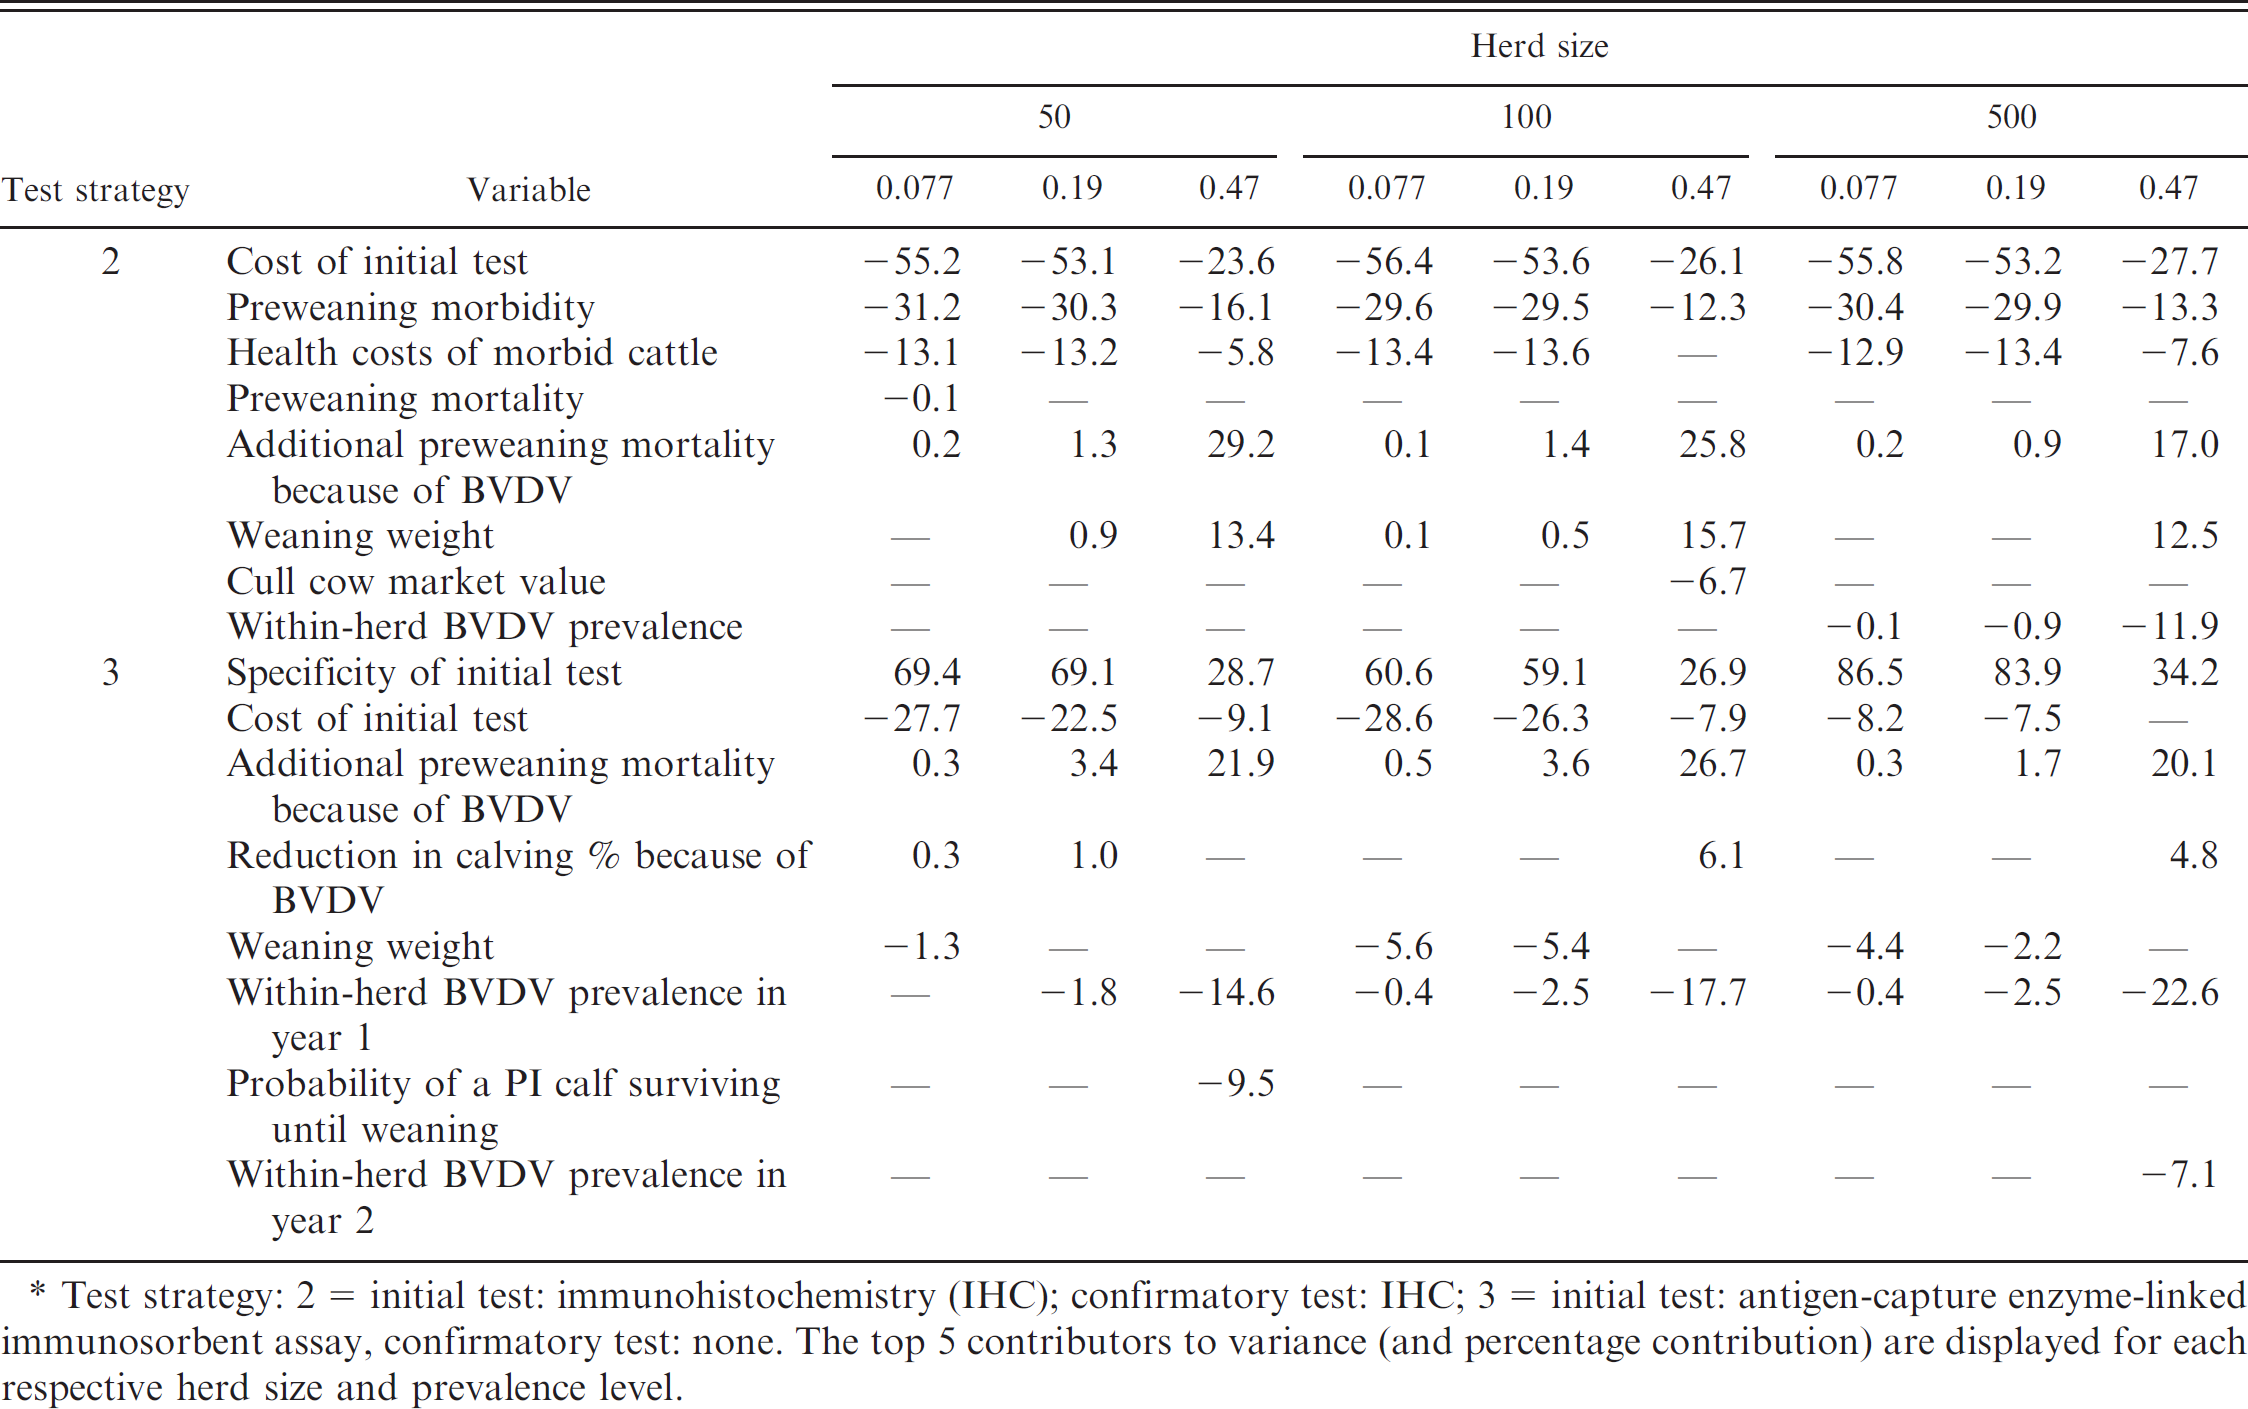
Test strategy: 2 - initial test: immunohistochemistry (IHC); confirmatory test: IHC; 3 - initial test: antigen-capture enzyme-linked immunosorbent assay, confirmatory test: none. The top 5 contributors to variance (and percentage contribution) are displayed for each respective herd size and prevalence level.
Before implementing a whole-herd test to determine herd status, veterinarians can assess the pretest probability that individual herds are BVDV positive based upon evaluation of clinical and reproductive history, animal procurement practices, and diagnostic test results on dead cattle. These observations may be helpful; however, results of previous research observed that only 19% of herds suspected of harboring PI cattle by the herd veterinarians were truly positive for PI cattle upon testing. 44 Understanding herd management practices is also important because prior research has demonstrated that the probability of introducing BVDV to the resident herd across a 10-year time frame when pregnant heifers were imported was 0.47 if the calves were not tested for BVDV upon parturition. 37 Therefore, knowledge of previous herd reproductive performance and management practices may influence the probability that the herd is BVDV positive and thereby modify the economic viability of selecting and implementing a whole-herd testing strategy.
Based on the findings in the present study, accurate discernment of probable herd BVDV status is imperative to avoid large financial losses attributed to the respective whole-herd test (Table 6). For example, in herd sizes of 50, 100, and 500 cows, instituting a whole-herd BVDV test based on the veterinarian's belief that the probability of the herd being positive is 0.47, when in reality the true probability is 0.19, costs the herd approximately $400, $800, and $4,000, respectively, on average (Table 6). Therefore, practicing veterinarians (and the herd owners) must have a clear understanding of the risk of being BVDV positive in each respective herd and thereby accurately categorize the probability of being BVDV positive to minimize negative economic outcomes.
Several factors in addition to the optimal economic value impact the decision of which BVDV testing modality should be implemented. 24,26 Testing in series requires that a second test be performed on cattle that test positive on the initial test. A two-test strategy may be met with some opposition by producers, thus, reducing the compliance of performing the second test. Although economic benefit may not be maximized, analysis of the data in the current study suggests that numerous testing strategies (including single-test strategy 1 [initial test: IHC; confirmatory test: none] and 5 [initial test: real-time RT-PCR; confirmatory test: none]) are financially sensible when the likelihood that a herd is BVDV positive is high (0.47) in each of the 3 herd sizes (Table 7). Therefore, as long as herd prevalence is high or the probability of a herd being BVDV positive is high, veterinarians can tailor their test strategy to meet the practical and logistical limits of their staff, clientele, and laboratory of choice.
Numerous clinical indications may influence selection of the diagnostic strategy, but analysis of data from these simulations also illustrated differences in estimated economic value of testing strategies in the evaluated scenarios. In the present study, IHC on skin tissue followed by a confirmatory IHC test on initial positive cattle (test 2) was consistently the superior (or one of the superior) testing strategies across herd prevalence and herd size. Therefore, not only is testing for BVDV economically justified at elevated herd prevalence, but the implementation of test 2 will also maximize the financial return to the producer at the herd sizes evaluated in the current study. The Se analysis for testing strategy 2 indicates that the test cost is the driving factor that contributes to the variance in cumulative value. However, across all herd sizes, as herd prevalence increased, the cost of the test declined in rank of variation contribution. This is likely attributed to an elevation in the value of testing for BVDV because of a greater probability of detecting PI cattle at high herd prevalence, thereby reducing the economic impacts attributed to test cost.
Conversely, a one-time ACE test on skin tissue (test 3) performed poorly (Table 7) at each herd prevalence level within each herd size. The Se analysis performed for test 3 indicated that diagnostic Sp was a major contributor for this result among all 3 herd prevalences and sizes evaluated. Whereas the distribution of diagnostic Sp used in the current study may appear adequately high, in low prevalence scenarios, the probability of a test positive specimen being of FP status is typically greater than that of TP. In test and cull programs, the Se analyses indicated that false-positive diagnoses greatly impact the value of the testing method to the producer. Only when the pretest likelihood of a BVDV-positive herd reached 0.47 did diagnostic Sp become relatively comparable with other variance contributors. This is likely because, at a high herd prevalence, the probability that test-positive cattle are truly diseased (i.e., positive predictive values) is elevated. 6
The diagnostic Sp for the highest ranked test (test 2) did not significantly contribute to the variance for this test strategy, which is likely attributed to the serial testing method implemented to reduce the likelihood of false-positive diagnoses. 6 Therefore, in populations in which disease prevalence is low, maximizing the diagnostic Sp of the respective test protocol is necessary to minimize false-positive diagnoses. This finding is important, because the selection of an appropriate testing strategy is influenced by the pretest likelihood that the herd is BVDV positive. The findings in the present study suggest that, regardless of herd size, diagnostic test Sp should be a major concern to practicing veterinarians and diagnostic laboratories when expected herd prevalence is low.
All data were generated by model simulation; therefore, the external validity of the results is dependent upon the quality of the model and the information that comprises model input. Although the present model was designed to incorporate typical production parameters among beef cow–calf herds in the United States, it is acknowledged that many cow–calf production systems differ in economic and management strategies, which could influence the relative economic ranking of the BVDV testing strategies. Extrapolating the data to herds that use other management practices (e.g., fall calving herds) may be difficult. To the authors' knowledge, the distributions in the present model reflect the available data within the veterinary literature. When data were sparse, distributions were widened to accommodate that lack of knowledge. Therefore, as more data are accumulated, model distributions (and, subsequently, the estimated value of testing in specific situations) may become more precise.
In summary, across all 12 testing strategies, the findings suggest that herd BVDV prevalence dictates the economic viability of implementing BVDV testing programs in 50, 100, and 500 head herd sizes. Such findings provide evidence that, when the probability of a herd being BVDV positive is relatively low (0.077 and 0.19), recommending whole-herd testing for BVDV in all herds is not financially beneficial. Veterinarians may be able to generate knowledge that the pretest probability of BVDV positive status is higher and thereby increase the economic viability of implementing the testing strategy. If a whole-herd test is performed and the probability of BVDV is high, then the results of the data indicate that the value of testing can be maximized in most cases by implementing a testing strategy that consists of IHC on skin tissue as the initial test followed by a second IHC test on individuals that test positive on the first test. The Se analysis indicated that diagnostic Sp was the major variance contributor to the value of the lowest ranked testing strategy. Data in the present study provides evidence that the value of whole-herd BVDV testing among cow–calf herds must be critically analyzed before implementation.
Acknowledgements
Funding for the project was provided, in part, by Applied Biosystems and by Life Technologies.
Footnotes
a.
Oracle® Crystal Ball, Fusion edition, release 11.1.1.3.00, Oracle Corp., Redwood Shores, CA.
b.
Microsoft® Excel 2007, Microsoft Corp., Redmond, WA.