
Abstract
The serologic diagnostic tests, such as the agar gel immunodiffusion assay and various types of enzyme-linked immunosorbent assays (ELISAs), have contributed to the reduction of small ruminant lentivirus (SRLV) infections worldwide. Because there are no treatments or efficacious vaccines, the serologic diagnostic tests have supported most of the eradication efforts by testing and removal or separation of adult animals that generate antibodies to SRLVs. With the advent of molecular diagnostics, standard and quantitative polymerase chain reaction (PCR)—based assays for the detection of provirus in peripheral blood cells are becoming more common and aid in the detection of infected goats and sheep before antibody detection by ELISA in some animals. Performance of the serologic and molecular diagnostic tests is dependent upon a number of factors, including the format of the assay, the percentage of identity between the viral nucleotide sequences in a flock or herd of a certain geographic region and the sequences used to generate SRLV test reagents, and the intrinsic pathogenesis or amount of provirus and SRLV antibody generated in a species or individual small ruminant. In addition, small ruminant genomics may help with establishing genetic markers of SRLV infection and disease, which could also aid eradication or reduction of SRLVs from herds and flocks throughout the world.
Introduction
A brief history of small ruminant lentiviruses
The small ruminant lentiviruses (SRLVs) include Ovine progressive pneumonia virus (OPPV), Visna maedi virus (VISNA), and Caprine arthritis encephalitis virus (CAEV). The first SRLV, named ovine progressive pneumonia, was first reported 54 in Montana in 1923, where several sheep were observed to be lagging behind the flock (called “lungers”) and experiencing dyspnea. The resulting lung pathology of these lunger sheep showed chronic interstitial pneumonia with peribronchial and perivascular accumulation of mononuclear cells. 54 However, the etiologic agent, OPPV, was not isolated until several decades later, in 1968. 46 A wasting or progressive encephalomyelitis, called visna, and a dyspnea syndrome, called maedi, were first reported in Iceland in the late 1930s, and it was believed to have been associated with the importation of 2 infected Karakul rams. 31 However, postulates were not demonstrated for VISNA until years later. 75 A leukoencephalomyelitis was first reported in young kid goats in 1974, and shortly thereafter, in 1980, CAEV was isolated and found to be the cause of both the leukoencephalomyelitis condition of young kids and a severe arthritis of adult goats. 13,14 Later, it was determined that OPPV and CAEV were also associated with lymphoproliferative mastitis in sheep and goats, respectively. 17,47
Transmission sources
The main transmission modes and sources of SRLV are somewhat different among sheep and goats. Vertical, in utero, OPPV transmission occurs approximately 5% of the time in serologically positive ewes 15,19 ; however, it is unknown whether vertical, in utero, CAEV transmission occurs in serologically positive does. The SRLV DNA (provirus) has been found in epididymal semen from rams and bucks, 61 and, if rams are serologically positive for OPPV and culture positive for Brucella ovis, infectious OPPV is found in the semen of rams. 26 It is unknown whether provirus detection in semen equates to vertical, paternal transmission of SRLVs to future progeny or to horizontal, sexual transmission to ewes. In dairy goats experimentally infected with CAEV, colostrum and milk contain moderate to high CAEV titers (10 5 tissue culture infectious doses [TCID]/ml), and 78% of kids that have natural contact with their dam or with other CAEV-infected dairy breed females become serologically positive for CAEV. 2 If the colostrum and milk are pooled from different experimentally CAEV-infected dairy does and administered orally to naive kids, the result is 100% CAEV seroprevalence. 2 Therefore, colostrum and milk are considered to be the major contributors to the maternal and horizontal spread of CAEV to kids and to the horizontal spread of CAEV among lactating adult females in a dairy management situation. 69 In goats serologically positive for CAEV, the lung tissues contain infectious CAEV particles, CAEV nucleic acid, and CAEV protein, which suggests that respiratory secretions may also contribute to horizontal transmission. 27,77,83 Both cell-associated and cell-free OPPV and VISNA have been found in colostrum, milk, and bronchial alveolar lavage (BAL) fluid of the lung of serologically positive ewes. 10,39,52,53,56,57 The OPPV or VISNA in the BAL fluid is thought to be the major source of horizontal transmission in sheep; however, there have not been any reports demonstrating the shedding of OPPV, VISNA, or CAEV in oronasal secretions. Interestingly, although cell-associated OPPV, found in the colostrum or milk of 6-year-old, lactating ewes, in both meat and wool breeds, and transmitted to lambs, establishment of persistent infection based on the presence of peripheral provirus load and OPPV serum antibodies only occurred in 5% of lambs (1 of 22) during 6 years of surveillance (LM Herrmann-Hoesing, unpublished data, 2008). 39 Natural suckling and contact between VISNA-infected dairy breed ewes and their lambs contributed to establishment of 19% serologically positive lambs; however, bottle-feeding lambs with the colostrum or milk of unrelated VISNA-infected ewes resulted in 55% serologically positive lambs. 4 Therefore, in general, OPPV, VISNA, and CAEV are able to transmit from dams to progeny through natural postpartum contact, but there are some differences in their abilities to establish persistent infection. There are a number of possibilities for these observations, including differences in virus production in the various breeds of sheep and goats (dairy vs. meat), SRLV fitness, the amount of passively transferred SRLV antibody, and other milk factors that promote or inhibit persistent infection in the lamb.
Why are the small ruminant lentiviruses grouped together?
The SRLVs of the family Retroviridae are grouped together because CAEV can be experimentally transmitted to sheep, and OPPV can be experimentally transmitted to goats. 5 In addition, viral strain typing has recently found that some goats contain ovine progressive pneumonia or maedi-like and visna-like viruses and that some sheep contain caprine arthritis encephalitis—like viruses. 12,62,63,66,68,73,74 Furthermore, because sheep and goats often cohabitate, eradication efforts have been focused on eliminating SRLVs in general. Persistently infected animals are a potential reservoir for transmission; therefore, highly specific and sensitive diagnostic tests are required for early detection and separation or culling of both infected sheep and goats. A single, specific, and sensitive test that could be used for detection of both CAEV and OPPV or VISNA in small ruminants would aid eradication efforts.
Overview of current serologic diagnostic tests for small ruminant lentivirus
The serologic reference standards for small ruminant lentivirus
The first serologic diagnostic tests developed for SRLV were the radioimmunoprecipitation assay (RIPA) and the agar gel immunodiffusion (AGID) assay. 16,21,78 Evaluation of serologic responses by U.S. sheep to the WLC1 isolate of OPPV, using RIPA and AGID, showed that the 2 diagnostic tests were comparable because the sensitivity and specificity of AGID compared with RIPA was 99.3% and 99.4%, respectively. 35 In contrast, evaluation of U.S. goat serologic responses to the isolate CAEV-63 in AGID, compared with RIPA, showed a moderate sensitivity of 91% and a specificity of 100% in goat sera; however, if the OPPV WLC1 isolate was used in the AGID assay and compared with RIPA assay of the isolate CAEV-63, a reduced sensitivity of 56% and a specificity of 100% resulted. 50 Although the RIPA assay relies on multiple SRLV antibody interactions to several epitopes on 35 S-labeled, cell culture—derived viral proteins to immunoprecipitate and results in visualization of specific activity on film, the AGID assay depends on multiple SRLV antibody interactions to several epitopes on cell culture—derived viral proteins that result in a visible precipitate line in agar. In general, because RIPA and AGID were the first to be developed, they are considered reference standards for subsequent serologic diagnostic tests.
Western blot (WB) analysis was developed a little later than RIPA and AGID, 42 and it is considered another CAEV and OPPV or VISNA serologic reference test. The WB analysis is the reference standard for determination of Human immunodeficiency virus (HIV) 1 infection status in humans, where to be called positive, serum antibody must react to 2 of the following 3 HIV proteins: HIV capsid (CA), HIV surface envelope glycoprotein (SU), and HIV transmembrane protein (TM). 23 With the development of the WB for SRLV infections, it was noted that, in naturally and experimentally VISNA-infected sheep, there was a greater increase in SRLV CA antibodies than there was in other SRLV antibodies present early in the infection when using WB analysis. 42 The WB analysis takes place after the viral lysate is heated at 80°C for 10 min under typical reducing and denaturing sample buffer conditions; then, after being loaded onto a sodium dodecyl sulfate (SDS) polyacrylamide gel, electrophoresis is applied, with the running buffer containing reducing agent. Under this SDS reductive condition, viral proteins have the same charge per mass unit, are in a linear format during their migration through the gel, and subsequently remain mainly in linear format when transferred to the WB membrane for probing with serum antibodies.
It is believed that the serum antibodies that bind to viral proteins in the WB analysis bind to more nonconformational epitopes on the viral proteins. In contrast, serum antibodies in RIPA and AGID bind to more conformational epitopes because these assays are performed under oxidizing conditions. There are examples of this phenomenon in the literature where there were notable differences in which SRLV protein was B-cell immunodominant, with B-cell immunodominance defined as the antigen with the highest amount of serum antibodies produced against it. In goats with progressive arthritis, where the B-cell immunodominant protein in CAEV is SU using RIPA, the B-cell immunodominant protein in CAEV is TM90 when using WB analysis under reduced conditions. 49,55 In addition, OPPV SU was immunodominant using RIPA in 8 of 10 sheep, whereas OPPV CA was immunodominant using WB analysis under reducing conditions in 3 out of 4 sheep. 37,59 In the sera of the other 2 sheep tested using RIPA, both OPPV SU and TM90 were immunodominant, whereas in the serum of the 1 other sheep tested using WB analysis under reducing conditions, TM90 was immunodominant. Interestingly, if the antibody reactivity is compared using a pool from 10 RIPA-positive sheep sera with the same total viral protein amount and serum dilution under reduced and oxidized OPPV conditions in WB analysis, the intensity of the SRLV protein bands vary depending upon the presence of reducing agent (Fig. 1). Oxidized SU and TM90 have more reactivity to serum antibodies than do reduced SU and TM90; similarly, reduced CA and matrix (MA) have more serum-antibody reactivity than do oxidized CA and MA. Taking into account the OPPV and CAEV data together, the data suggest that SU antibodies are produced to conformational epitopes, whereas CA antibodies are produced to nonconformational epitopes, and TM90 antibodies can be produced to either conformational or nonconformational epitopes.
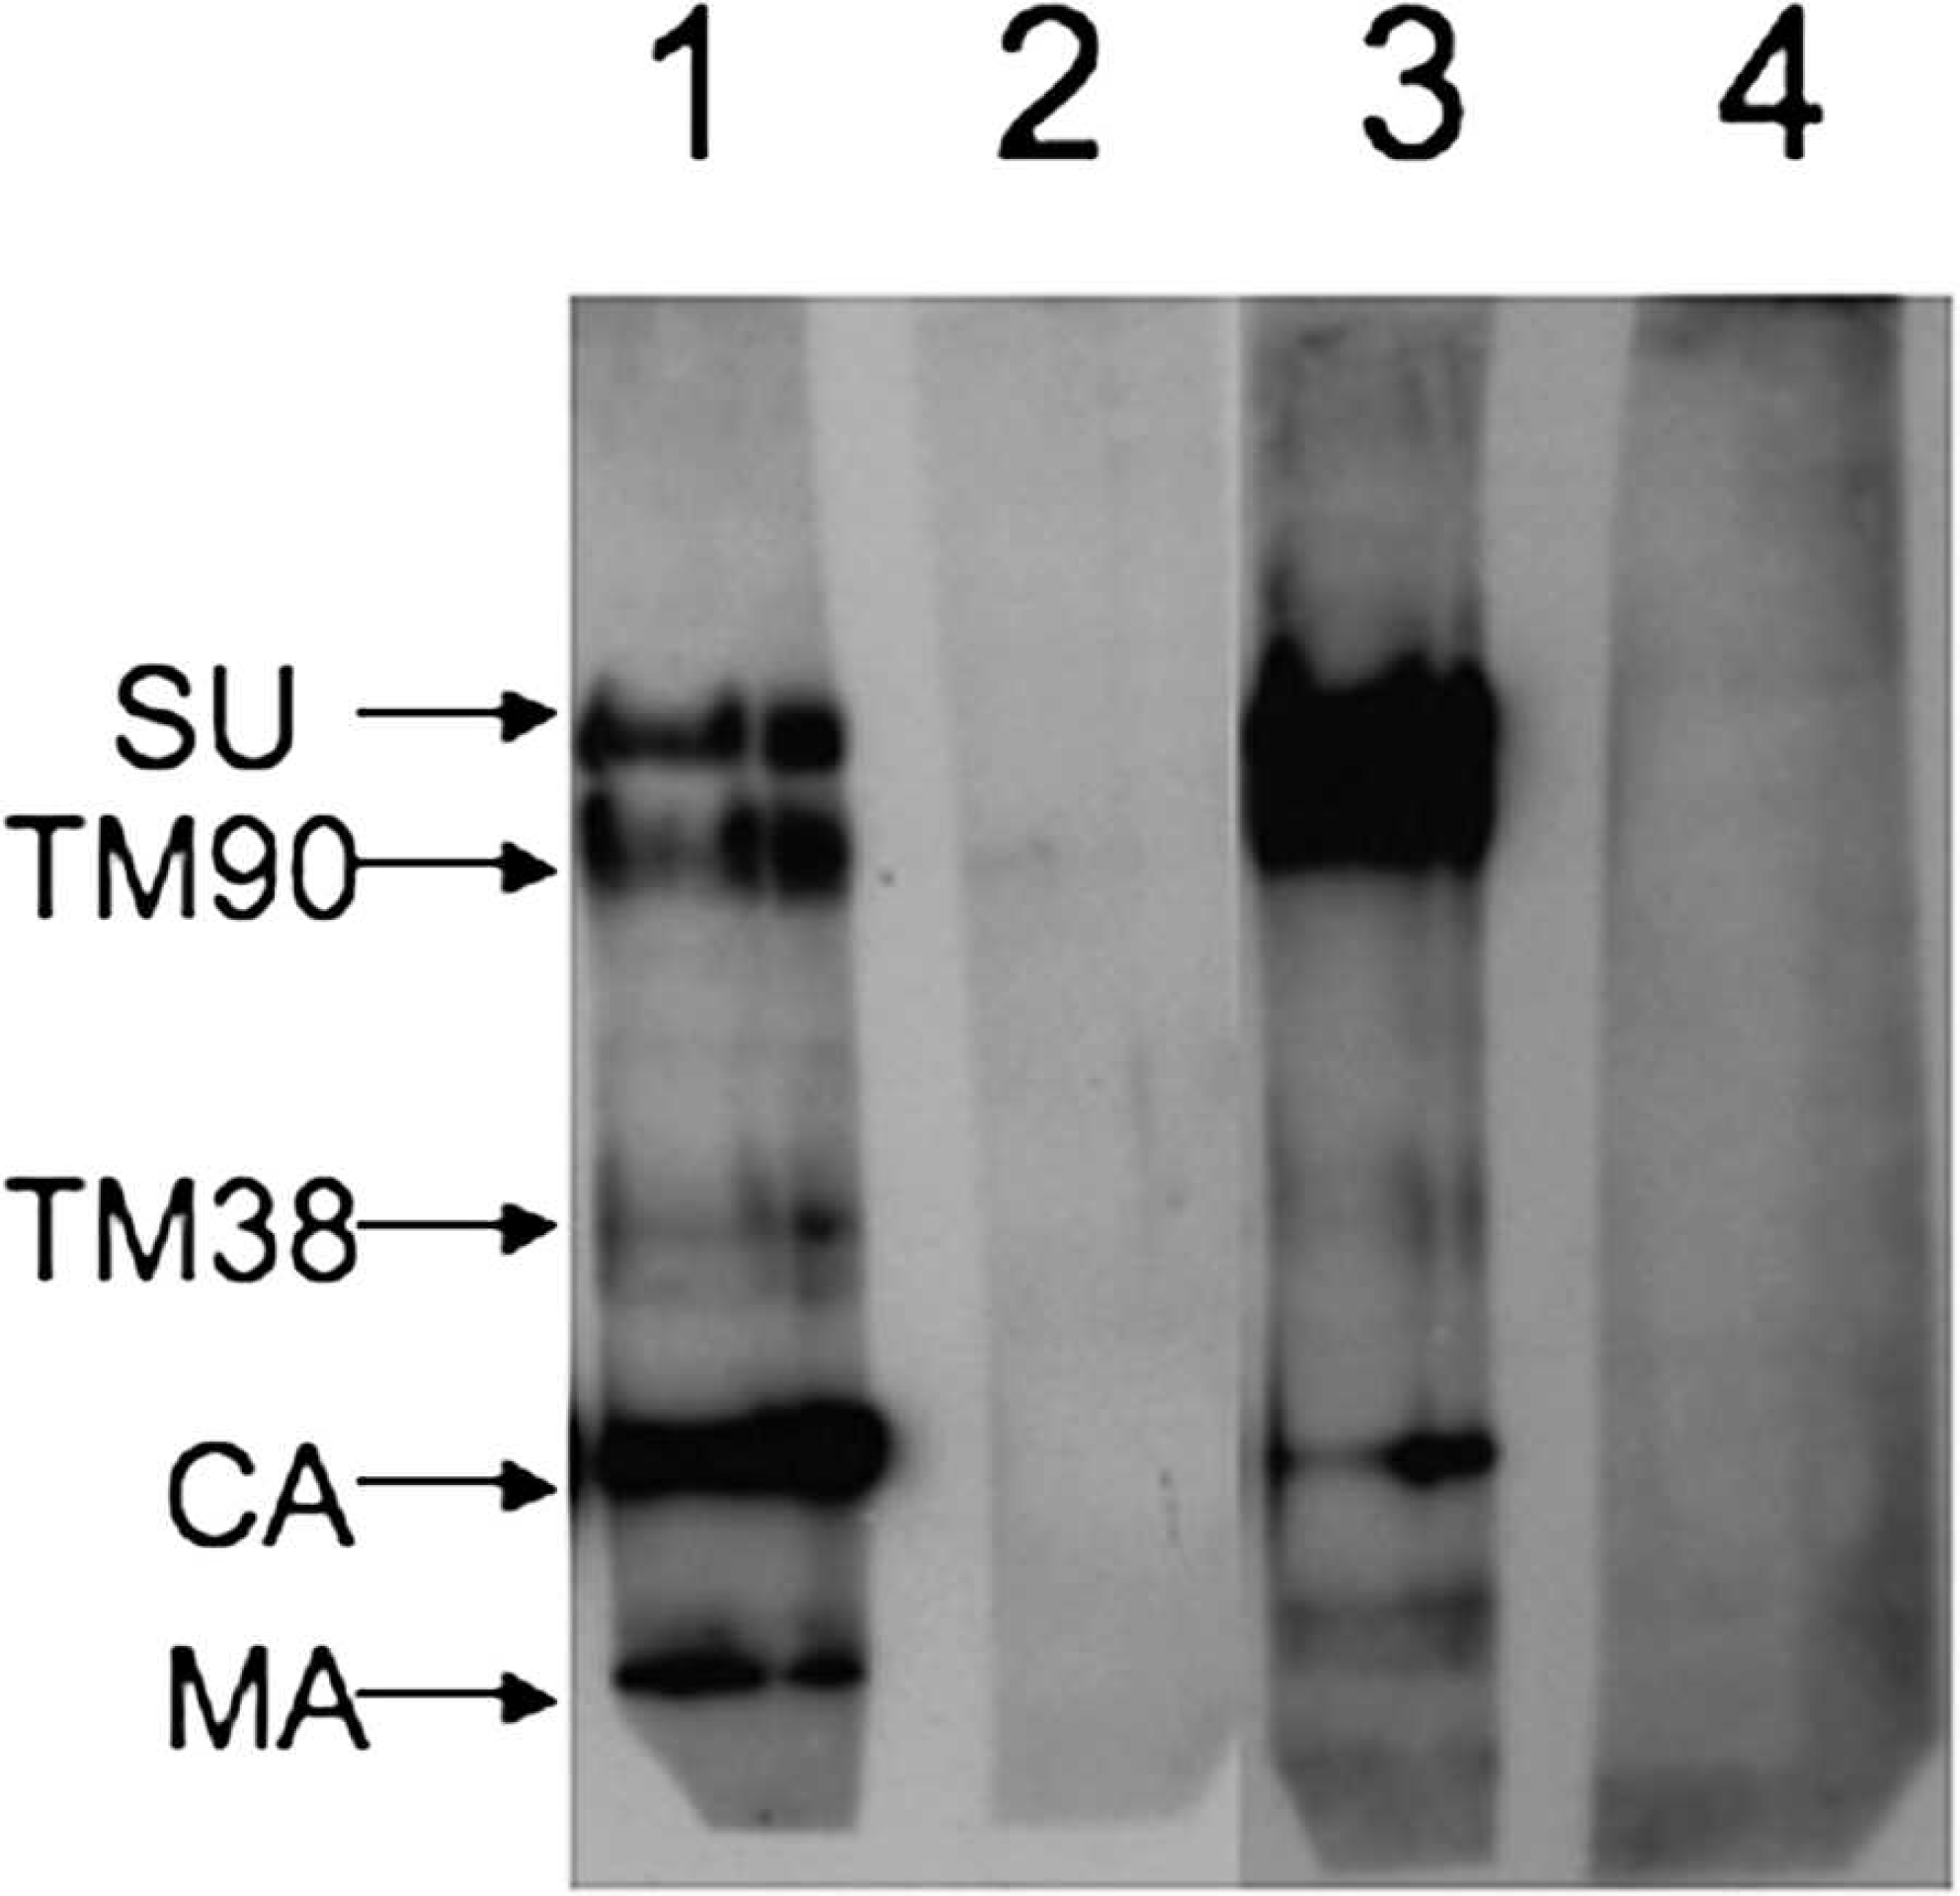
Western blot (WB) analysis using Ovine progressive pneumonia virus (OPPV) WLC1 under reducing (lanes 1, 2) and oxidizing conditions (lanes 3, 4), sheep serum dilution of 1:60, and horseradish peroxidase—labeled rabbit anti-sheep immunoglobulin G (gamma) at 1:1,000. Methods and reagents for WB analysis have been previously published. 61 Lanes 1 and 3 are sera from a pool of 10 sheep positive for OPPV WLC1 by radioimmunoprecipitation assay (RIPA), and lanes 2 and 4 are sera from a pool of 9 sheep negative for OPPV WLC1 by RIPA. Notice that the anticapsid (CA) bands are darker in lane 1 than in lane 3, and the antisurface envelope glycoprotein (SU) and antitransmembrane protein (TM)90 bands are darker in lane 3 than in lane 1. MA = matrix.
Comparison of the serologic reference standards for small ruminant lentiviruses
The AGID assay has been widely used and accepted as a reference test; however, in a temporal study, its sensitivity was shown to be less than a VISNA EV1 recombinant (r), indirect (i) enzymelinked immunosorbent assay (riELISA). 79 One reason for this lower sensitivity could be due to strain differences, where the VISNA strains in the sheep being tested have higher nucleotide identity to VISNA EV1 than they do to OPPV WLC1. Another reason for the lower sensitivity of the AGID could be due to its subjective nature. Highly qualified technicians are required to read the fine immunoprecipitate lines in the agar gel, and often, weak positives are misidentified as negative. In addition, if a laboratory is creating a new AGID based on their local SRLV strain, quality control issues in the generation of virus can arise. Many veterinary diagnostic laboratories are able to run CAEV-63 and OPPV WLC1 AGID assays.
The specific activity of radiolabeled virus in RIPA, versus unlabeled, immunoprecipitated virus in AGID, most likely allows for increased sensitivity or detection of SRLV antibody responses. However, radiolabeling large batches of virus require time, reagents, and paperwork, and RIPA is at least a 5-day protocol once radiolabeled virus is obtained. Many veterinary diagnostic laboratories do not have the capability to run RIPAs. In addition, many research reference laboratories are reducing the use of radioactive reagents because of the increased paperwork and cost.
Western blot analysis is another good reference standard, and most research laboratories have the necessary components for running WB. However, like RIPA, large batches of virus are grown and isolated in vitro, and the WB procedure requires a minimum of 6 hr to conduct the analysis. The sensitivity of WB and RIPA are comparable, and sera diluted to 1:60 in WB and to 1:64 in RIPA detect SU, TM90, and CA in the same persistently OPPV-infected sheep. 37,59 If WB analysis is used as the reference test, the oxidation or reduction state of the viral antigen used in the reference WB test should be considered when validating new serologic tests against WB tests. That is, if a new serologic test uses a reduced recombinant antigen, reduction of the viral antigen in WB analysis may serve as a better reference test, whereas if a new serologic test uses oxidized whole virus as antigen, oxidation of the viral antigen in WB analysis may be a better reference test in this scenario. The WB analysis can usually be performed in World Organization for Animal Health (OIE) reference laboratories and in national animal veterinary laboratories.
Small ruminant lentivirus ELISAs
There have been many ELISAs developed and validated for detection of SRLV infection. Both the AGID and ELISA are considered valid tests for international trade, according to the 2008 OIE Manual of Diagnostic Tests and Vaccines for Terrestrial Animals. Only 1 ELISA has undergone validation under OIE standards using 1,000 true negatives and 300 true positives as determined by AGID, RIPA, or WB analysis. 72 When describing validation in the present review, references using fewer, but well-defined, true negatives and positives as determined by AGID, RIPA, or WB analysis will be discussed.
The SRLV ELISAs can be categorized into iELISAs, sandwich ELISAs, and competitive inhibition (c) ELISAs. Whole virus—purified viral proteins, recombinant viral proteins, and viral peptides have all been used in these ELISAs. Although there have been more than 30 ELISAs described in the veterinary literature, 24 the present review is going to focus on those ELISAs that 1) were validated against AGID, RIPA, or WB; and 2) have demonstrated sensitivities and specificities greater than 95% using a single ELISA. These criteria trim the number of ELISAs down to 4; of which, 2 are iELISAs and 2 are cELISAs.
In 1987, a so-called complex trapping blocking (CTB)-ELISA was designed. 43 This CTB-ELISA is currently defined as a cELISA, and the following steps are used: 1 antivisna ZZV 1050 CA monoclonal antibody is placed on the bottom of the plate; the plate is washed; freeze—thawed, cell-associated visna strain ZZV1050 is added; undiluted serum is applied; a second antivisna ZZV1050 CA monoclonal antibody, labeled with horseradish peroxidase (HRPO), is applied; the plate is washed; and, finally, substrate is added. A blocking effect of 50% or more over the negative control was considered positive. In the 1987 study, 43 the CTB-ELISA was compared with the AGID assay using the ZZV1050 visna strain in sera from 276 Dutch sheep, and the CTB-ELISA was compared with the AGID assay using the CAEV-63 strain in sera from 194 goats from 5 countries on 3 continents. Interestingly, the CTB-ELISA had a sensitivity of 97.2% and a specificity of 100% in comparison to the CAEV-63 AGID assay in the goat sera, whereas the CTB-ELISA had a sensitivity of 67.9% and a specificity of 100% in comparison to the ZZV1050 AGID assay in the sheep sera. The CAEV-63 AGID was run in a separate laboratory from the ZZV1050 AGID, and the ZZV1050 antigen in the AGID assay had some quality issues. These 2 issues could have accounted for the higher number of apparent false-negative AGID tests and the subsequent apparent lower sensitivity of the CTB-ELISA in the sheep sera. The CTB-ELISA validation study illustrates that AGID can be problematic in some laboratory settings. Without the testing of many weak positives, strong positives, and negative controls, AGID performance is difficult to assess because it is subjective and nonquantitative.
The second ELISA that showed promise was an SDS-treated, whole-virus iELISA, using a Canadian (Ca) CAEV strain isolated from the lung of a goat showing arthritis. The CAEV iELISA had a sensitivity of 98.3% and a specificity of 97.9% in the sera of 511 goats when compared with 2 out of 3 concordant test results in the AGID assay using Ca CAEV, reduced Ca CAEV in WB analysis, and Ca CAEV in a fixed-cell fluorescent antibody test (FAT). 34 This validation showed that if the same strain of virus is used in the new test (iELISA) and in the reference tests (AGID, WB, and FAT), the resulting sensitivity and specificity were high. The use of denatured viral antigen in the iELISA, WB, and FAT may have contributed to the high sensitivity and specificity of the iELISA. The sensitivity and specificity of the Ca CAEV iELISA on sheep sera is unknown.
The third ELISA, which uses a recombinant CA and TM peptide from the VISNA strain EV1, is the only assay to fulfill the validation testing standards by OIE. 72 Compared with the standard OPPV WLC1 AGID assay, the VISNA EV1r iELISA had a sensitivity of 98.4% and a specificity of 97.1% on sera from 2,336 sheep. When the AGID indeterminate samples and the AGID assay and VISNA EV1r iELISA discordant samples were tested by WB analysis under reducing conditions, the corrected sensitivity and specificity of the VISNA EV1r iELISA were 99.4% and 99.3%, respectively. 72 In the same validation study, the VISNA EV1r iELISA had a sensitivity and specificity in 212 goat sera of 100% and 86%, respectively, when compared with the OPPV WLC1 AGID assay. One reason for the observed lower specificity of this iELISA on goat sera is most likely because of the use of OPPV WLC1 AGID assay on goat sera instead of the CAEV-63 AGID assay. An study published earlier 50 demonstrated that approximately 40% of CAEV-infected goats were missed if OPPV WLC1, instead of CAEV-63, was used as the antigen in the AGID assay. If the OPPV WLC1 AGID assay missed some of CAEV-infected goats, the missed goats would be counted as an AGID-negative and VISNA EV1r iELISA—positive (or false-negative), which would yield a lower apparent specificity of the VISNA EV1r iELISA in goats. It would be of diagnostic value to reevaluate the sensitivity and specificity of the VISNA EV1r iELISA using the CAEV-63 AGID assay followed by WB analysis of the discordant samples.
The fourth and final ELISA for detection of antibodies to SRLVs is the CAEV-63 cELISA. 35,36 This assay is built on 2 mouse monoclonal antibodies that bind to 2 different conformational epitopes on CAEV-63 SU 60 ; the following steps are used: an anti-CAEV-63 SU monoclonal antibody F7-299 with the CAEV-63 SU bound is placed on the bottom of a plate; undiluted serum is applied; the plate is washed; anti-CAEV-63 SU monoclonal antibody 74A, labeled with HRPO, is applied; the plate is washed; and, finally, the substrate is applied. A formula uses the optical density at 620 nm for the negative serum control, and the test sample generates a number called the percentage of inhibition. The sensitivity and specificity of the CAEV-63 cELISA when compared with RIPA using CAEV-63 on sera from 200 goats were 100% and 96.4%, respectively. In a temporal study, 36 it was determined that the CAEV-63 cELISA could detect anti-CAEV SU antibodies before RIPA could, in 4 out of 8 goats at 6 weeks postinfection with CAEV-Co, another strain of CAEV. That suggests that the CAEV-63 cELISA has greater sensitivity than RIPA does.
In addition, the sensitivity and specificity of the CAEV-63 cELISA, when compared with RIPA using OPPV WLC1, on sera from 332 sheep were 98.6% and 96.9%, respectively. The reduced sensitivity and specificity of the CAEV cELISA in sheep, as compared with the CAEV cELISA in goats, could be due to strain differences, where the OPPV strains in the sheep have higher sequence identity to OPPV WLC1 than to CAEV-63.
Advantages and disadvantages of the different ELISA formats
One advantage of the iELISA is that it does not require monoclonal antibody production; however, the serum usually requires a dilution of 1:10 and up to 1:100 to minimize the background signal. With this dilution, there is typically an increase in the number of false-negative results because when a weak-positive serum is diluted, it will test negative. One advantage of the cELISA is that undiluted sera are used, and if SRLV antibodies are present in the sera, they will inhibit the binding of a monoclonal antibody to a specific epitope on the SRLV protein; however, its increased sensitivity is also a disadvantage because an increased sensitivity over a reference standard test can manifest as false-positive results.
Many of the other ELISAs not mentioned in the current review had multiple problems. One problem was that the SRLV strain used in the ELISA was divergent from the SRLV strain used in the reference-standard test. Another problem was that the strains in the field were divergent from the strain used in the ELISA. Finally, many newer ELISAs were compared against other suboptimal ELISAs instead of a reference standard.
Overview of the current molecular diagnostic tests for small ruminant lentivirus
The SRLVs infect cells of the monocyte, macrophage, and dendritic cell lineage and integrate into the ruminant genome in the form of provirus. 30,32,71 This cell tropism has allowed for PCR detection of provirus and transcribed cell-associated virus in many tissues and fluids of animals infected experimentally and naturally with SRLV, including the lung, bronchial alveolar fluid, colostrum, milk, peripheral blood mononuclear cells, mammary gland and udder, brain, carpal synovial membranes, heart, kidney, liver, spleen, lymph nodes, semen, testes, uterus, oviduct, cumulus cells, and bone marrow. In contrast, although cell-free infectious SRLV can be detected in fluids of the affected tissues, such as colostrum, milk, bronchial alveolar fluid, cerebrospinal fluid, and synovial joint fluid using coculture methods, cell-free SRLV RNA genomes have not been directly detected in the same fluids using reverse transcription (RT)-PCR assay. 1,2,10,39,48,56,57 Although cell-free infectious SRLV has been detected in serum of 0–30% of goats experimentally infected with 106 TCID50 CAEV-63, 48 there have been many reports suggesting that cell-free infectious SRLV is undetectable in the serum or plasma of animals naturally infected with SRLV using coculture methods (LM Herrmann-Hoesing, unpublished data, 2010). 8,10 No evidence of cell-free SRLV RNA genome detection using RT-PCR in the plasma or serum of animals naturally infected with SRLV has been reported.
The first article 81 describing detection of CAEV and VISNA used the PCR assay on cell cultures infected with various CAEV and VISNA strains for the amplification of pol and gag from genomic (g)DNA; the results were confirmed using restriction enzyme analysis. Several of the early SRLV PCR studies used synovial membrane cells from infected goats and choroid plexus cells from sheep, and some studies used these indicator cells in coculture with cells or disrupted tissues. Most PCR studies examined the specificity of the PCR using restriction enzyme analysis, Southern blotting, or sequence analysis. According to the OIE, the currently accepted reference standard for validating PCR pathogen-positive and pathogen-negative samples is isolation of the pathogen or sequencing of the amplicon and PCR amplification of a control gene, respectively.
To understand whether the PCR of SRLV genes has any relevance in the diagnostic monitoring of goats and sheep for SRLVs, early PCR assays on in vivo cells were compared against various serologic assays. Although many of these studies referred to sensitivity and specificity in the comparison of SRLV PCR and serologic detection, these comparisons measured concordance and not specificity and sensitivity because these 2 types of assays detect different things in the blood. A handful of standard PCR amplifications of SRLV from gDNA of peripheral blood mononuclear cells (PBMC) or peripheral blood leukocytes (PBL) of 20 or more animals have been compared with serologic diagnoses. 9,28,65,67 In one study, 9 PCR detected OPPV ltr in 49 out of 49 PBMC samples of AGID-seropositive ewes, resulting in 100% positive concordance, and ltr was not detected in 36 out of 36 PBMC samples of AGID-seronegative ewes, resulting in 100% negative concordance. In contrast, PCR detected VISNA ltr in 75 out of 90 PBL samples of AGID-seropositive or iELISA-seropositive sheep, resulting in 83.3% positive concordance, whereas PCR detected ltr in 1 out of 26 PBL samples of AGID-seronegative or iELISA-seronegative sheep, resulting in 96.2% negative concordance. 28 A PCR revealed the CAEV gag in 18 out of 20 PBMCs from AGID-seropositive goats, resulting in 90% positive concordance, and detected gag in 3 out of 33 PBMC of AGID-seronegative goats, where 2 of these 3 goats eventually seroconverted, resulting in 93.9% negative concordance. 65 Similar to the previous study, CAEV gag was detected in 25 out of 27 PBMC samples of iELISA-seropositive goats, resulting in 92.6% positive concordance, and also detected gag in 20 of 81 PBMC samples of iELISA-seronegative goats, where 10 of these 20 goats eventually seroconverted several months later, with a resulting 87.7% negative concordance. 67 The lack of nucleotide sequence identity between the viral strain used in the serologic assay, the primers used in the molecular assay, and the viral strain found in the animal likely contributed to the reduced concordances observed in some of these comparisons.
There have also been SRLV gag and pol nested-PCR studies conducted in vivo and compared with serologic assays. In one study, 11 VISNA gag was detected in 21 out of 30 PBMC samples of AGID-seropositive sheep, resulting in 70% positive concordance, and VISNA gag was undetectable in 62 out of 68 PBMC samples of AGID-seronegative sheep, resulting in 91.2% negative concordance. In another study, CAEV gag and pol were detected in 89 out of 94 PBMC samples of iELISA-seropositive goats, resulting in 94.7% positive concordance, and CAEV gag and pol were undetectable in 35 out of 40 PBMC samples of iELISA-seronegative goats, resulting in 87.5% negative concordance. 6 In the end, the nested PCR assays did not offer increased positive and negative concordances over the standard PCR assays for SRLVs.
Quantitative PCR assays
There have been relatively few articles describing quantitative (q)PCR assays for the detection of SRLVs. The first competitive qPCR assay that was described amplified VISNA pol from tissue culture—adherent alveolar macrophages (AM) and from peripheral blood monocytes, and the results were compared with scores of the extent of pathologic lesions in the lung and not with the serologic diagnosis. 82 The first real-time qPCR developed using fluorescent probes and fluorescence resonance energy transfer measurements measured VISNA transcripts and DNA in vitro of infected fetal ovine syncytial cells. 33 Another study measured VISNA transcripts and unintegrated DNA using real-time quantitative RT-PCR in sheep choroid plexus cells or goat synovial membrane cells infected with VISNA strain P10LV in vitro. 7
A real-time qPCR test for CAEV tm of env revealed that 2 goats experimentally infected with CAEV-associated mammary and synovial membrane lesions had 10 and 215 copies of env provirus load in PBMC, respectively, whereas 3 experimentally infected goats without pathologic lesions had less than 10 copies of env in PBMC. 64 Interestingly, blood or PBL from these animals with lesions yielded lower overall copies of env per 500 ng of DNA (<10 copies and 48 copies vs. 10 and 215 copies, respectively), and the goats without pathologic lesions had an undetectable load in their PBL. This suggests that enrichment of monocytes, such as PBMCs, for isolation from blood may help to boost provirus loads, especially in CAEV-infected goats. However, in another real-time RT-PCR study, 61 which used a SYBR Green I and ltr primers on semen and PBMC from sheep and goats, showed that the percentage of monocytes in PBMC did not play a significant role in determining PCR status. In general, goats are thought to have slightly lower monocyte counts (0–4%) than sheep (0–6%), and, in terms of the percentage of monocytes in PBMC and the amounts of provirus detected, sheep were not evaluated separately from goats. 61
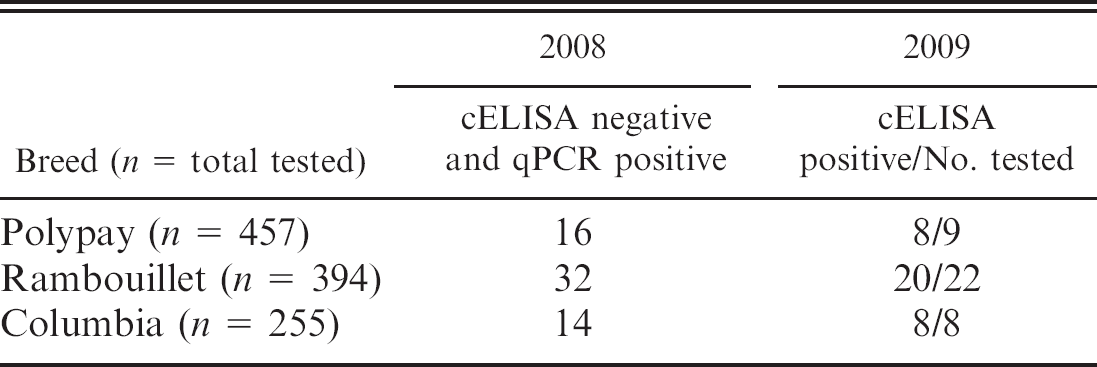
The OPPV real-time qPCR assay, which was designed to the TM region of env of 4 different U.S. (Idaho) OPPV isolates, detected 1–105 copies env per μg of gDNA in PBL from 395 ewes that were 3–6 years old and were from 3 different breeds in 2004. 40 This OPPV real-time qPCR showed a positive concordance of 96.2% and a negative concordance of 97.7% when compared with cELISA, and env was verified by sequencing from the 3 ewes that were qPCR positive and cELISA negative. In addition, the control gene glyceraldehyde-3-phosphate dehydrogenase was detected in the PCR-negative and cELISA-positive samples. Further testing of the Idaho flock in 2008 showed that there were 16 Polypay, 32 Rambouillet, and 14 Columbia ewes with cELISA-negative and OPPV qPCR-positive discordant results and 3 Polypay, 12 Rambouillet, and 4 Columbia ewes with cELISA-positive and OPPV qPCR-negative discordant results (LM Herrmann-Hoesing, unpublished data, 2010). When 9 Polypay, 22 Rambouillet, and 8 Columbia (the rest were culled or sold) of the cELISA-negative and OPPV qPCR-positive sheep were retested in 2009 or 2010 by cELISA, 8 Polypay, 20 Rambouillet, and 8 Columbia ewes tested positive (Table 1). This suggests that the OPPV qPCR may be able to detect more infected sheep before the cELISA compared with the cELISA detecting more infected sheep before the OPPV qPCR.
Because the OPPV qPCR does not detect CAEV-63 or CAEV-Co, new CAEV primers and probe were designed to the corresponding region of OPPV TM in env based on both CAEV-63 and CAEV-Co. Interestingly, the evaluation of PBL from 24 goats revealed that the CAEV qPCR on PBL is less sensitive than cELISA for detecting CAEV infection (Table 2). In addition, overall mean copies of env were 100-fold lower in the 12 cELISA- and qPCR-positive goats (mean: 54.5 copies/μg DNA, range: 1–357 copies/μg DNA) than in 12 randomly chosen cELISA- and OPPV qPCR-positive sheep (mean: 3,287.9 copies/μg DNA, range: 7.1–23,800 copies/μg DNA). There was 1 cELISA-and qPCR-positive goat in this group of 12 that had swollen knees, and this goat had 357 copies of env/μg DNA from PBL. This corresponds with a previous study, 64 where 1 of 2 CAEV experimentally infected goats with severe lesions had a qPCR load of 48 copies env/500 ng DNA. In addition, the TM region from DNA of PBL was sequenced from several goats from 3 different regions of the United States to check whether the primers or the probe that was designed against CAEV-63 and CAEV-Co was adequate for detecting field provirus. Interestingly, the sequence alignment revealed that there were no apparent problems with the primers or probe (Fig. 2). Further testing of goats using qPCR TM and perhaps using another viral gene, such as ltr or gag, needs to be added to evaluate whether goats naturally infected with CAEV maintain lower provirus loads than sheep naturally infected with OPPV or VISNA and whether lower monocyte counts correlate with lower qPCR loads in goats.
Temporal evaluation of competitive enzyme-linked immunosorbent assay (cELISA)-negative and Ovine progressive pneumonia virus quantitative polymerase chain reaction (qPCR)-positive discordant samples according to sheep breed.
Concordance of Caprine arthritis encephalitis virus (CAEV) competitive enzyme-linked immunosorbent assay (cELISA) and CAEV quantitative polymerase chain reaction (qPCR) tests. *
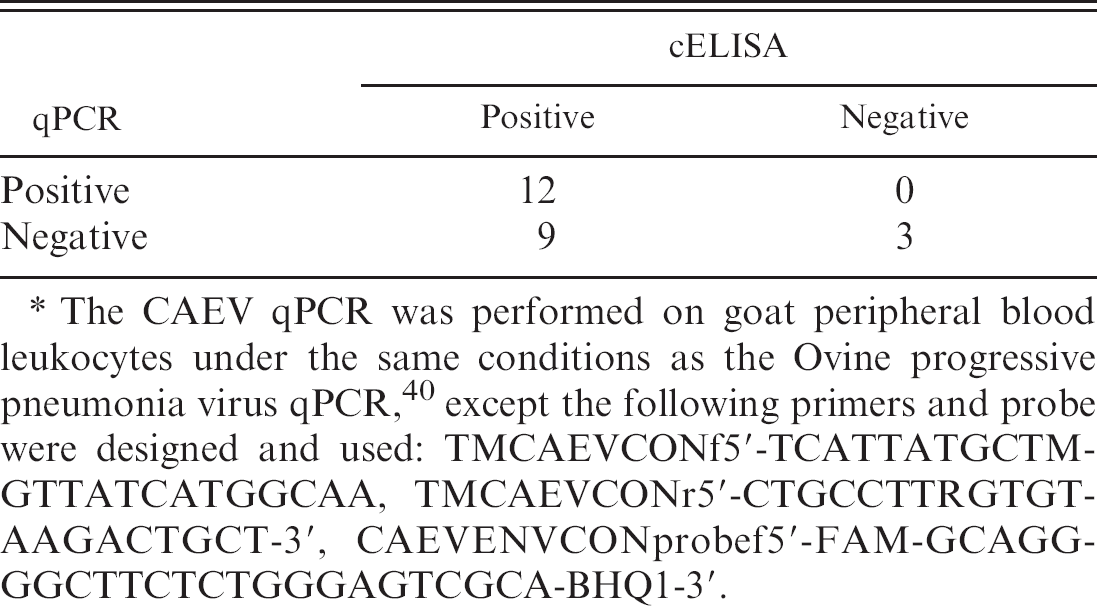
The CAEV qPCR was performed on goat peripheral blood leukocytes under the same conditions as the Ovine progressive pneumonia virus qPCR, 40 except the following primers and probe were designed and used: TMCAEVCONf5′-TCATTATGCTMGTTATCATGGCAA, TMCAEVCONr5′-CTGCCTTRGTGTAAGACTGCT-3′, CAEVENVCONprobef5′-FAM-GCAGGGGCTTCTCTGGGAGTCGCA-BHQ1-3′.
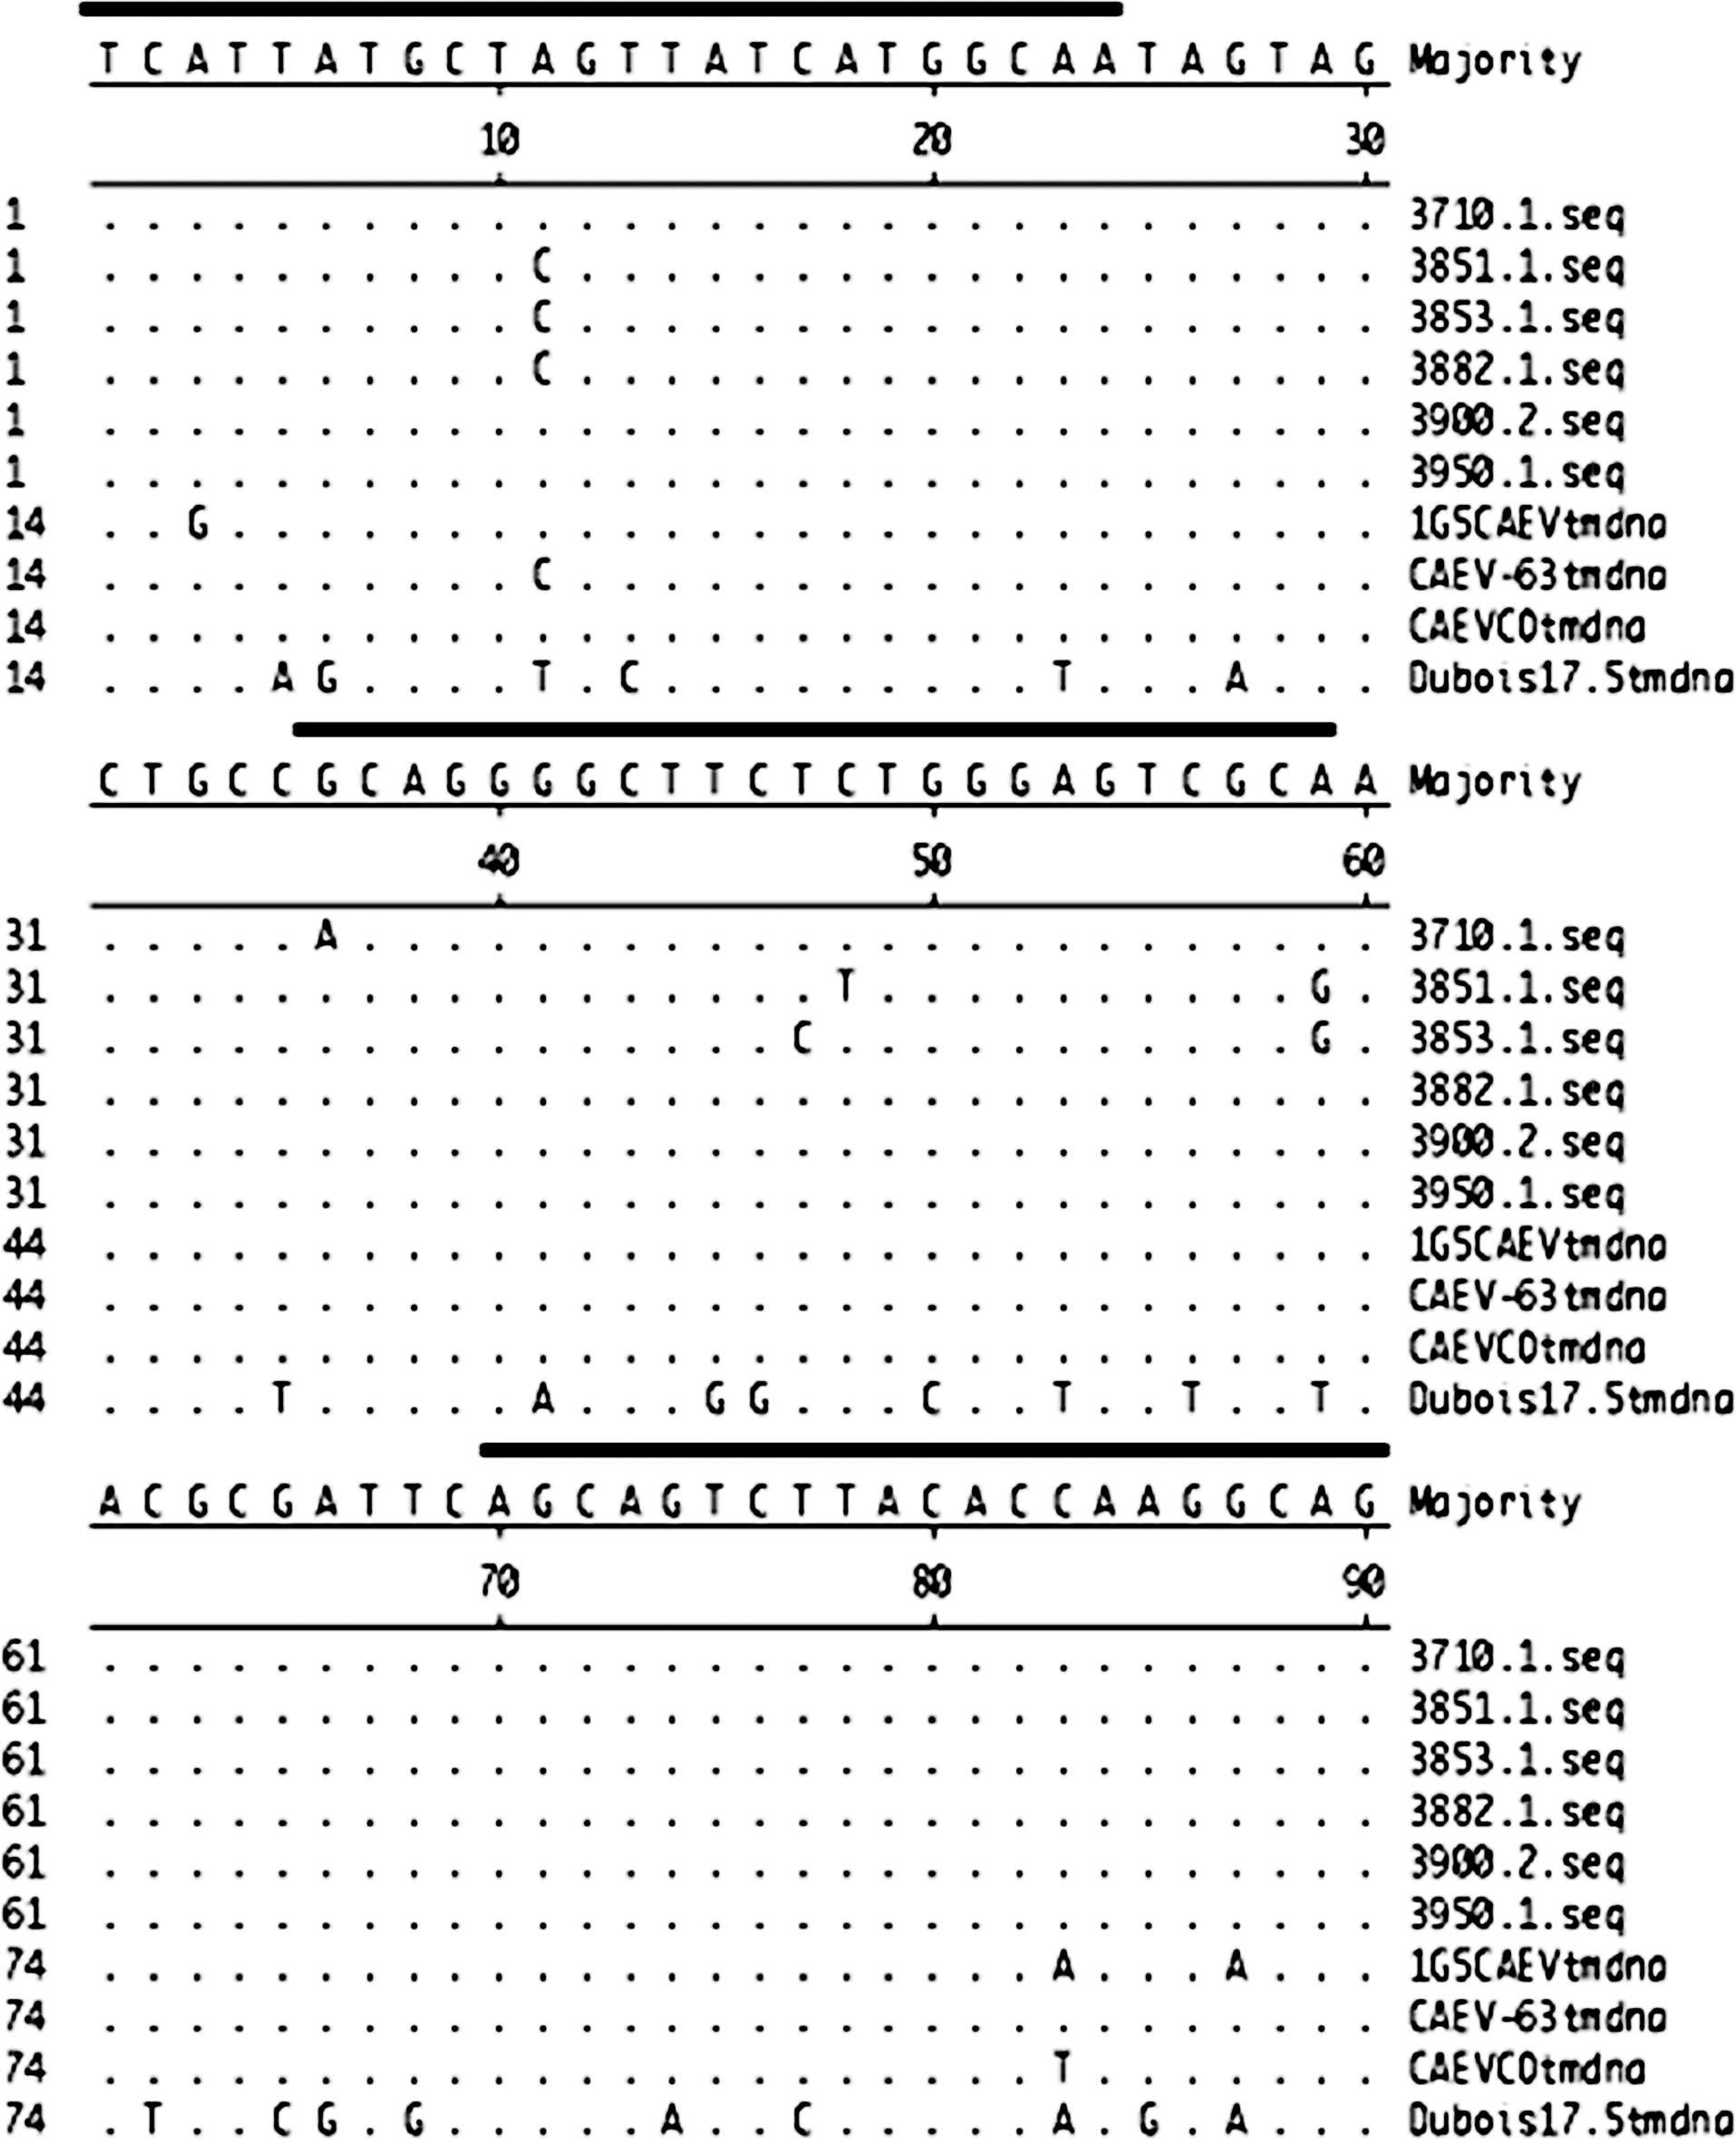
Nucleotide sequence alignment of partial env sequences amplified in Ovine progressive pneumonia virus (OPPV) and Caprine arthritis encephalitis virus (CAEV) quantitative polymerase chain reaction (qPCR). The top sequence is the consensus sequence, and matching nucleotides are designated with a dot (·). The CAEV field strains include 3710.1, 3751.1, 3853.1, 3882.1, 3900.2, 3950.1, and 1G5 (GenBank accession nos. HM049927–HM049933). The CAEV field strains were amplified by PCR using the CAEV qPCR primers listed in Table 2 and were cloned and sequenced using previous methods. 40 The CAEV cell culture—adapted strains include CAEV-63 (M60855) and CAEV-Co (M33677). The Dubois 17.5 strain corresponds to 1 of the OPPV field strains (EF207578). The dark lines above the consensus sequence correspond to the area where the CAEV qPCR primers and probe bind in env.
Should we expect 100% concordance between small ruminant lentivirus serologic and molecular diagnostic tests?
According to the pathogenesis of SRLV, provirus should be present before an antibody response to the virus during initial infection of adult animals, but this does not always occur in some animals. 40 In the PCR assays that were compared against AGID, the positive concordance ranged from 70% to 100%, whereas the negative concordance ranged from 91.2% to 100%. In the PCR assays that were compared against iELISA, the positive concordance ranged from 92.6% to 94.7%, whereas the negative concordance ranged from 87.5% to 87.7%. When the OPPV real-time qPCR was compared with cELISA, the positive concordance was 96.2%, and the negative concordance was 97.7%. These numbers suggest that PCR has a reduced sensitivity, compared with AGID or cELISA and that PCR has a reduced specificity compared with iELISA. The reason for the reduced sensitivity of the PCR with respect to AGID or cELISA in some assays may be due to the lower primer specificity to the SRLV strains found within a flock or herd or to detection of provirus that lags behind detection of SRLV antibody responses in some animals. In contrast, the reduced specificity of the PCR with respect to iELISA could either reflect adequate primer specificity to the SRLV strains found within populations or the intrinsic reduced sensitivity of the iELISA because of dilution of the sera in the assay. Regardless of these possibilities, a positive serologic and a positive PCR result in a given animal at a given time point indicates persistent infection. Combination serologic and molecular diagnostic testing for CAEV or for OPPV or VISNA annually would help producers identify positive animals more accurately over time.
Serologic and provirus load correlations with pathologic lesions
The first study 82 showed that AMs from VISNA-infected sheep with lung lesions consistent with VISNA had 1.5 log10 more copies of pol than did VISNA-infected sheep without lesions. Unfortunately, copies of pol in PBMC were not compared in sheep with and without lung lesions. 82 In addition, another study 64 showed that 2 CAEV-infected goats with severe lesions in the mammary gland or synovial membrane had higher copies of provirus in whole blood or PBMC than 3 CAEV-infected goats without lesions. A third study 38 showed that the provirus load in PBMC significantly correlated with and predicted the degree of pathologic lesion scores in any of the affected tissues of 11 naturally OPPV-infected ewes. However, in that same study, mean serum CA, TM90, or SU antibody titers using cELISA or WB analysis did not correlate significantly with the degree of pathologic lesion scores in ewes naturally infected with OPPV. In contrast, in goats experimentally infected with CAEV, SU antibody titers using RIPA significantly correlated with the degree of pathologic lesion scores in the synovial membranes. 49 In the study with the 11 ewes, 38 anti-SU antibody titers using RIPA did not significantly correlate with pathologic lesion scores in any of the affected tissues. In general, it appears that a provirus load in the blood of OPPV- or VISNA-infected sheep correlates well with lesion severity in the tissues. However, because CAEV qPCR assays need to be improved in the peripheral blood of goats, it is unknown whether CAEV provirus loads correlate to tissue-lesion severity. Hence, PCR-based assays may help producers to lower overall provirus loads of their herds or flocks and subsequently to lower the number of clinically affected animals when used in conjunction with a sensitive and specific serologic assay.
Diagnostic testing of small ruminants less than 1 year old
Because lambs and kids receive a large portion of their neonatal immunity through passive transfer via colostrum and milk, testing neonates by SRLV serologic and molecular diagnostic tests is not recommended because false positives may result if the dam is SRLV positive. Previous studies have shown that if lambs are allowed to suckle naturally from OPPV dams and weaned at 8 months, maternal OPPV antibody is detectable starting the first day after suckling and up to 52 weeks of age in some lambs. 39 In addition, under the same conditions, the ovine progressive pneumonia provirus may be detectable in the PBMC of lambs up to 24 weeks old. 39 Therefore, it is recommended that serologic or molecular testing of lambs occurs at least 4–6 months following weaning. Because of these observations in sheep regarding passive transfer of OPPV antibody and ovine progressive pneumonia provirus, it is safe to assume that the same trend occurs in goats. Therefore, it is also recommended that serologic or molecular testing of kids occur at least 4–6 months postweaning.
Molecular diagnostic tests on the small ruminant host
Early studies 18,20,29,44,76 on flocks naturally infected with OPPV revealed that certain breeds of sheep had higher seroprevalence than other breeds. In addition, a study 25 of monozygotic twin sheep showed that histopathologic lesions in the lung were similar within the monozygotic twin set, even though each were given 2 different OPPV strains. These studies together indicated that host genetics can potentially play a significant contributory role in regulating the antibody response to OPPV infection and subsequent microscopic lesions. If a host genetic marker is found to be linked to SRLV infection (or lack of SRLV infection) and to control of SRLV provirus load (or no control of SRLV provirus load), then this genetic marker would have the potential to serve as an early screening tool for SRLV control. In addition, unlike the SRLV diagnostics, a host genetic-marker test would require only 1 blood sample.
Summary of ways to maximize sensitivity and specificity in small ruminant lentivirus (SRLV) serologic tests. *
ELISA = enzyme linked immunosorbent assay; CAEV = Caprine arthritis encephalitis virus; AGID = agar gel immunodiffusion assay; OPPV = Ovine progressive pneumonia virus.
There have only been only a handful of studies correlating small ruminant genetics with SRLV. The caprine leukocyte antigen (CLA) serology was initially evaluated using 546 goats of 4 different breeds, and it was found that Saanen goats with CLA Be7 serospecificity were less prone to develop clinical arthritis after CAEV infection than were Saanen goats without CLA Be7. 70 Recently, the genotypes of the major histocompatibility complex (MHC) class II DRB1 alleles and chemokine receptor 5 (CCR5) were evaluated within the context of OPPV peripheral blood provirus loads. 41,80 The MHC class II DRB1 was evaluated because previous literature suggested that MHC class II was a putative receptor for VISNA and possibly CAEV (Hullinger GA: 1993, A gp135 cellular receptor mediates infection of caprine synovial membrane cells by the lentivirus caprine arthritisencephalitis virus. PhD dissertation. Washington State University, Pullman, WA), 22 and CCR5 was evaluated because of its coreceptor role in HIV-1 (persons with the Δ32 deletion of CCR5 have increased resistance to HIV-1). 3,45
In the MHC class II Ovar-DRB1 study, 41 DRB1 * 07012 and DRB1 * 0403 alleles were significantly associated with ovine progressive pneumonia provirus loads 10-fold and 2.5-fold lower, respectively, in the blood of 405 Columbia, Polypay, and Rambouillet sheep in the United States. Another more recent study, 51 in 165 Laxta sheep of Spain, suggested that DRB1 * 0353 was significantly associated with lung lesions consistent with VISNA. In the CCR5 study, 80 a homozygous deletion in an octamer transcription element site in the promoter of CCR5 was significantly associated with ovine progressive pneumonia provirus loads in the blood that were 2.5-fold lower. The MHC class II DRB1 and CCR5 should be secondarily tested in other flocks, preferably within a different management system, and should be evaluated in the context of other production and disease phenotypes. So far, ewe production appears unaffected if the ewes carry the Oct CCR5 homozygous deletion. 58 Besides these 2 genetic markers, the single nucleotide polymorphism chip in sheep is available for evaluating the whole sheep genome in the context of OPPV and other infectious diseases. If a sheep-specific genetic marker for OPPV can be found, it could greatly assist sheep producers in the management of OPPV without the cost of the recommended once-a-year serologic and molecular diagnostic testing.
Summary
The SRLVs cause insidious production losses to flocks and herds, and because there are no known treatments or vaccines, control of SRLV infection relies on diagnostic tests. Tables 3 and 4 summarize ways to maximize the sensitivity and specificity of serologic and molecular diagnostic tests. If clinical signs are evident or if SRLV infection is suspected in a flock or herd, evaluating the SRLV strain from the blood of the suspected clinical animals in the flock or herd and comparing the strain with the strains used in the serologic or molecular diagnostic tests will allow a better estimation of whether a certain diagnostic test will perform better than others will. With the decrease in sequencing costs, this may be possible in diagnostic laboratories in the future. Alternatively, in the future, ruminant genetic markers of SRLV infection or load may become available in the future, which may provide a means of SRLV control.
Summary of ways to maximize sensitivity and specificity in small ruminant lentivirus (SRLV) molecular tests. *
TM = transmembrane protein; PCR = polymerase chain reaction RNA = ribonucleic acid.
Acknowledgements
Dr. James Evermann is acknowledged for his critical reading of this manuscript. Also acknowledged are Dawn K. Myers-Evert for generating the OPPV Western blot analyses, Liam E. Broughton-Neiswanger for generating the CAEV env sequences, and Nic Durfee for generating the CAEV qPCR results.