
Abstract
For several years, researchers in the realm of music psychology have sought to understand how listeners perceive and experience emotions during music listening. Experimental and psychometric tools have been developed to explore the nuances of these emotional experiences, highlighting individual differences. Surprisingly, while much effort has been made to relate musical elements to specific emotional states, it is still an open issue explaining how listeners shift between different affective states (affect dynamics). In this study, we introduce a novel methodological approach to measuring affect dynamics in music by employing a Markov chain model—a stochastic framework that predicts the likelihood of transitions between affective states based on the current state. A single-case study was conducted in which a participant was exposed to emotion-inducing images from the International Affective Picture System (IAPS) and a week later to emotion-inducing music. During both sessions, physiological responses were recorded using facial electromyography (fEMG) to measure corrugator supercilii and zygomaticus major muscle activity, assessing emotional valence, alongside galvanic skin response (GSR) to assess arousal. The Markov chain framework was used to create a matrix of conditional transition probabilities, identifying both the participant’s baseline affective state (self-transitions, reflecting trait-like stability) and three types of affective transitions based on Russell’s circumplex model: vertical (i.e., arousal changes), horizontal (i.e., valence changes), and oblique (i.e., simultaneous arousal and valence changes). Our exploratory analysis demonstrated that affect transitions can be quantified in both conditions, revealing modality-specific patterns. Image exposure led to greater vertical transitions across all signals, whereas music elicited more stable baseline affective states. Oblique transitions showed consistent physiological patterns (specifically, decreased GSR and increased muscle activity) across both modalities, highlighting distinct yet interconnected affective dynamics. Taken together, the findings reveal a complex interplay between stimulus modality and the physiological markers of affect dynamics.
For several years, music psychology researchers have sought to identify the mechanisms that facilitate listeners’ perception of the emotional content of music (Cespedes-Guevara & Eerola, 2018). To this end, they have developed psychometric instruments requiring listeners to assign emotion labels to music excerpts (e.g., Hill & Palmer, 2010), asked listeners to complete affect-rating scales with ordered response options (e.g., Imbir & Gołąb, 2017), or measured listeners’ physiological arousal (e.g., Gomez & Danuser, 2007). As shown in Figure 1, the circumplex model (Russell, 1980, 2003, 2017), a theoretical framework describing the structure of emotional experiences, informs much of the research in this area.
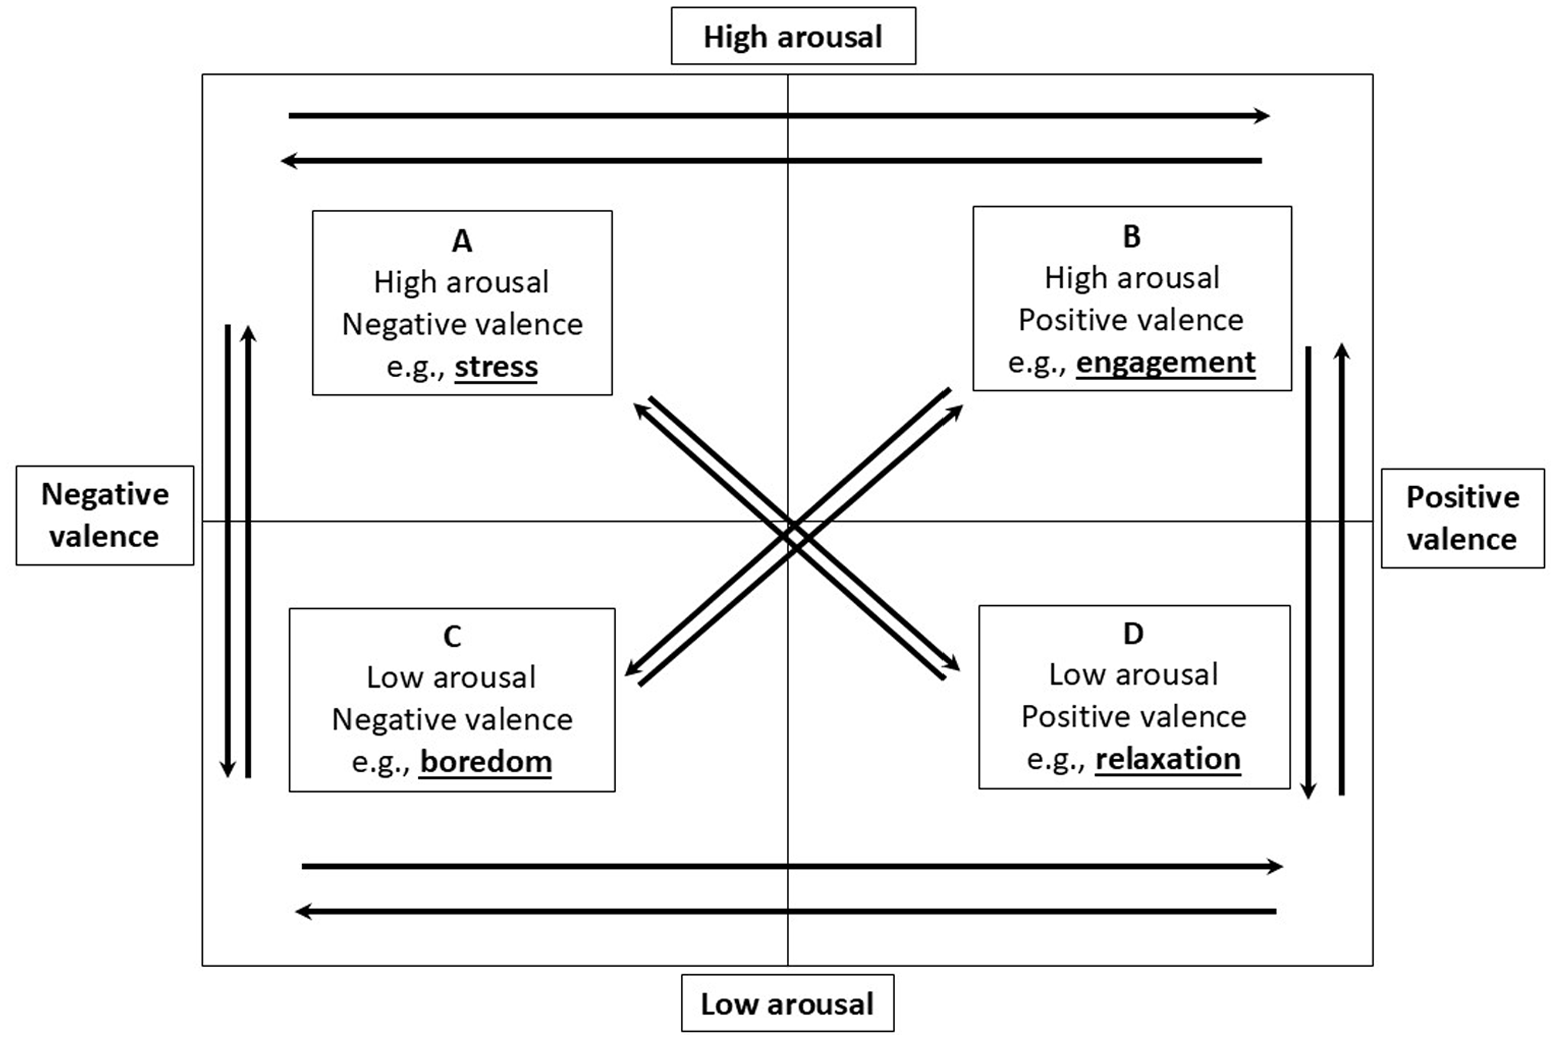
Russell’s circumplex model.
It has two dimensions: arousal, referring to the physiological activation associated with an emotion, and valence, representing the subjective evaluation of the pleasantness or unpleasantness of an experience. These dimensions are represented on two orthogonal axes. Arousal ranges from high to low, and valence ranges from positive to negative. The intersection of the two axes yields four quadrants: high arousal and positive valence (e.g., engagement), high arousal and low valence (e.g., stress), low arousal and positive valence (e.g., relaxation), and low arousal and negative valence (e.g., boredom). Facilitating the development of databases of music excerpts, with each excerpt representing an exemplary of a particular combination of arousal and valence, several studies (Brosch et al., 2010; Eerola, 2011; Eerola et al., 2013; van der Schyff & Schiavio, 2017) have used the two dimensions of arousal and valence to assess participants’ ratings of the excerpts.
Specific elements of music have been shown to elicit arousal and valence in listeners and thus listeners’ emotional states (Droit-Volet et al., 2013; Eerola et al., 2013; Juslin & Västfjäll, 2008; Västfjäll, 2001). The tempo and rhythm of the music influence arousal. For example, fast music increases listeners’ energy and excitement, while slow music is more calming; syncopation and complex rhythms can heighten arousal, while regular and repetitive rhythms can induce relaxation. Other elements likely to influence arousal include the use of crescendo and decrescendo, instrumentation, density of texture, and articulation, such as legato to increase arousal and staccato to decrease it (Eerola & Vuoskoski, 2011, 2013; Gomez & Danuser, 2007; Gregory & Varney, 1996; Juslin & Lindström, 2010; Quinto et al., 2014).
Several elements of music, such as tonality (major and minor scales), melody (contour and the arrangement of intervals), harmony, and the use of harmonic progressions from one chord to another, mode, and key, influence the valence of musical compositions. For example, studies of music perception have shown that major keys such as C and F are associated with brightness and positivity, while minor keys such A minor and D minor are associated with melancholy and negativity (Burnham et al., 2021; Goydke et al., 2004; Khalfa et al., 2005). These associations may be related to differences between listeners’ experiences of consonance (pleasantness) and dissonance (unpleasantness), which arise from the way tones combine based on the characteristic harmonic spectrum of the timbre (Justus et al., 2018). While emotional responses to music in the major and minor modes can be altered by manipulating the tempo of the music (e.g., Gagnon & Peretz, 2003; Hunter et al., 2010; Husain et al., 2002; Ramos et al., 2011), two studies conducted nearly a century apart found that participants assigned negative descriptors from a checklist of emotional adjectives to minor chords and positive descriptors to major chords (Burnham et al., 2021; Heinlein, 1928). In previous research, participants were exposed to predetermined musical stimuli in controlled experiments in which they provided subjective ratings of their emotional responses, or the researchers measured their physiological responses (Eerola & Vuoskoski, 2013). Participants were not exposed to one or more pieces of music played continuously; instead, the researchers aimed to identify the emotions associated with specific short excerpts. This kind of approach fails to capture listeners’ experiences of shifting from one emotional (affective) state to another (affect transition) as they listen to a longer piece of music (Dejonckheere et al., 2019; Hamaker et al., 2015; Hamaker & Wichers, 2017; Vanhasbroeck et al., 2021; Waugh & Kuppens, 2021). These experiences can be gauged in two ways: by comparing the listener’s current affective state with their previous affective state and by noting changes in the listener’s affective state that occur in tandem with the emotions conveyed by the music.
In previous research, affect dynamics have been explored using the experience-sampling method (ESM), whereby participants report their emotions, feelings, or moods at various time points. Affect dynamics have been explored in the context of participants looking at visual images, using the standardized International Affective Picture System (IAPS) (Bo et al., 2022; Borghesi, Chirico, & Cipresso, 2023; Lazarus et al., 2021; Simoncini et al., 2024); watching films (Hollenstein, 2021), and in relation to virtual reality (Borghesi, Murtas, Mancuso, et al., 2023; Borghesi, Murtas, Pizzolante, et al., 2023; Mancuso et al., 2023). The primary goal of our study, however, was to explore affect dynamics in the context of a single participant viewing emotion-inducing images (image condition), in one experimental session, and listening to emotion-inducing music, played continuously, in another (music condition). We took physiological measurements to monitor the participant’s affective states and the transitions between them (affect dynamics), using facial electromyography (fEMG) to measure activity in the corrugator supercilii (corrugator) and zygomaticus major (zygomatic) muscles, since these are established indicators of negative and positive valence, respectively (Rutkowska et al., 2024). EMG amplitude was used as an emotional intensity index, as it provides a quantitative measure of the magnitude of facial muscle activation. We also recorded the galvanic skin response (GSR) of the participant as a measure of sympathetic nervous system activation (Eerola et al., 2013; Flaig & Large, 2014; Imbir & Gołąb, 2017; Vahey & Becerra, 2015), with increased conductance levels indicating higher arousal states (Kipli et al., 2022; Ohme et al., 2009). Our secondary goal was to test the use of a Discrete Time and Discrete Space Markov chain—a stochastic model predicting the likelihood of a sequence of discrete events based on the most recent event—to analyze and compare the data gathered in the image and music conditions (Borghesi, Chirico, & Cipresso, 2023; Borghesi & Cipresso, 2024; Cipresso et al., 2023). Discrete Time and Discrete Space refer to the specific configuration of the Markov chain, where transitions occur at fixed intervals (discrete time) between a finite set of possible states (discrete space). For simplicity, we will refer to this as a (generic) Markov chain (Yin & Zhang, 2005). Using Markov chain analysis, we constructed a transition matrix of conditioned probabilities (Kaplan, 2008), which allowed us to identify the participant’s baseline affective state. This state, considered a trait-like characteristic, is mathematically defined as a stability index. Additionally, we identified three distinct types of affect transition, mathematically representing variability indices, based on Russell’s circumplex model: (1) vertical transitions (changes in arousal without changes in valence), (2) horizontal transitions (changes in valence without changes in arousal), and (3) oblique transitions (simultaneous changes in both arousal and valence). Our aim was to demonstrate a novel approach to investigating affect dynamics, comparing those induced by images and music, and using Markov chains, to model and analyze specific affect transitions. This approach would allow us to differentiate between modality-specific aspects of affect dynamics and the general characteristics of emotional transitions.
Methods
Design
We implemented a single-case, within-subject experimental design with the two conditions (image vs. music) as the independent variable and physiological indices of affect transitions and levels of arousal as the dependent variables: (1) activity in the corrugator and zygomatic muscles, measured using fEMG, and (2) GSR, tracking fluctuations in arousal. We then constructed transition matrices to quantify affect transitions in the two conditions. Russell’s circumplex model was applied to the two conditions as illustrated in Figure 2 (image) and Figure 3 (music), respectively.
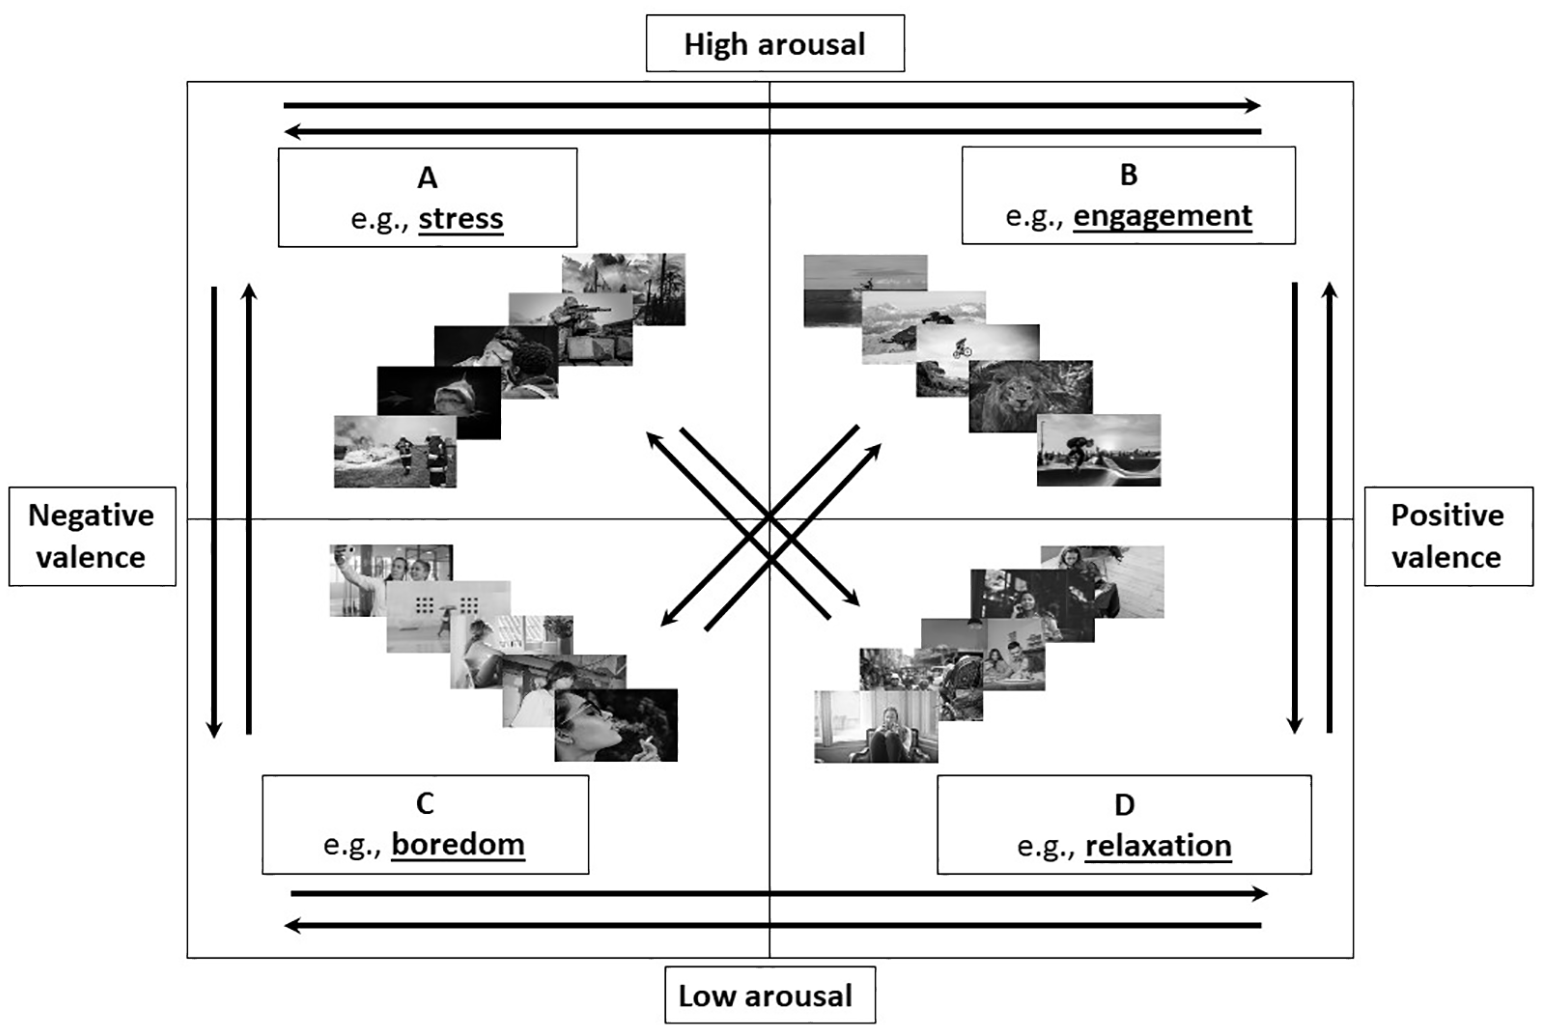
The circumplex model applied to the image condition.
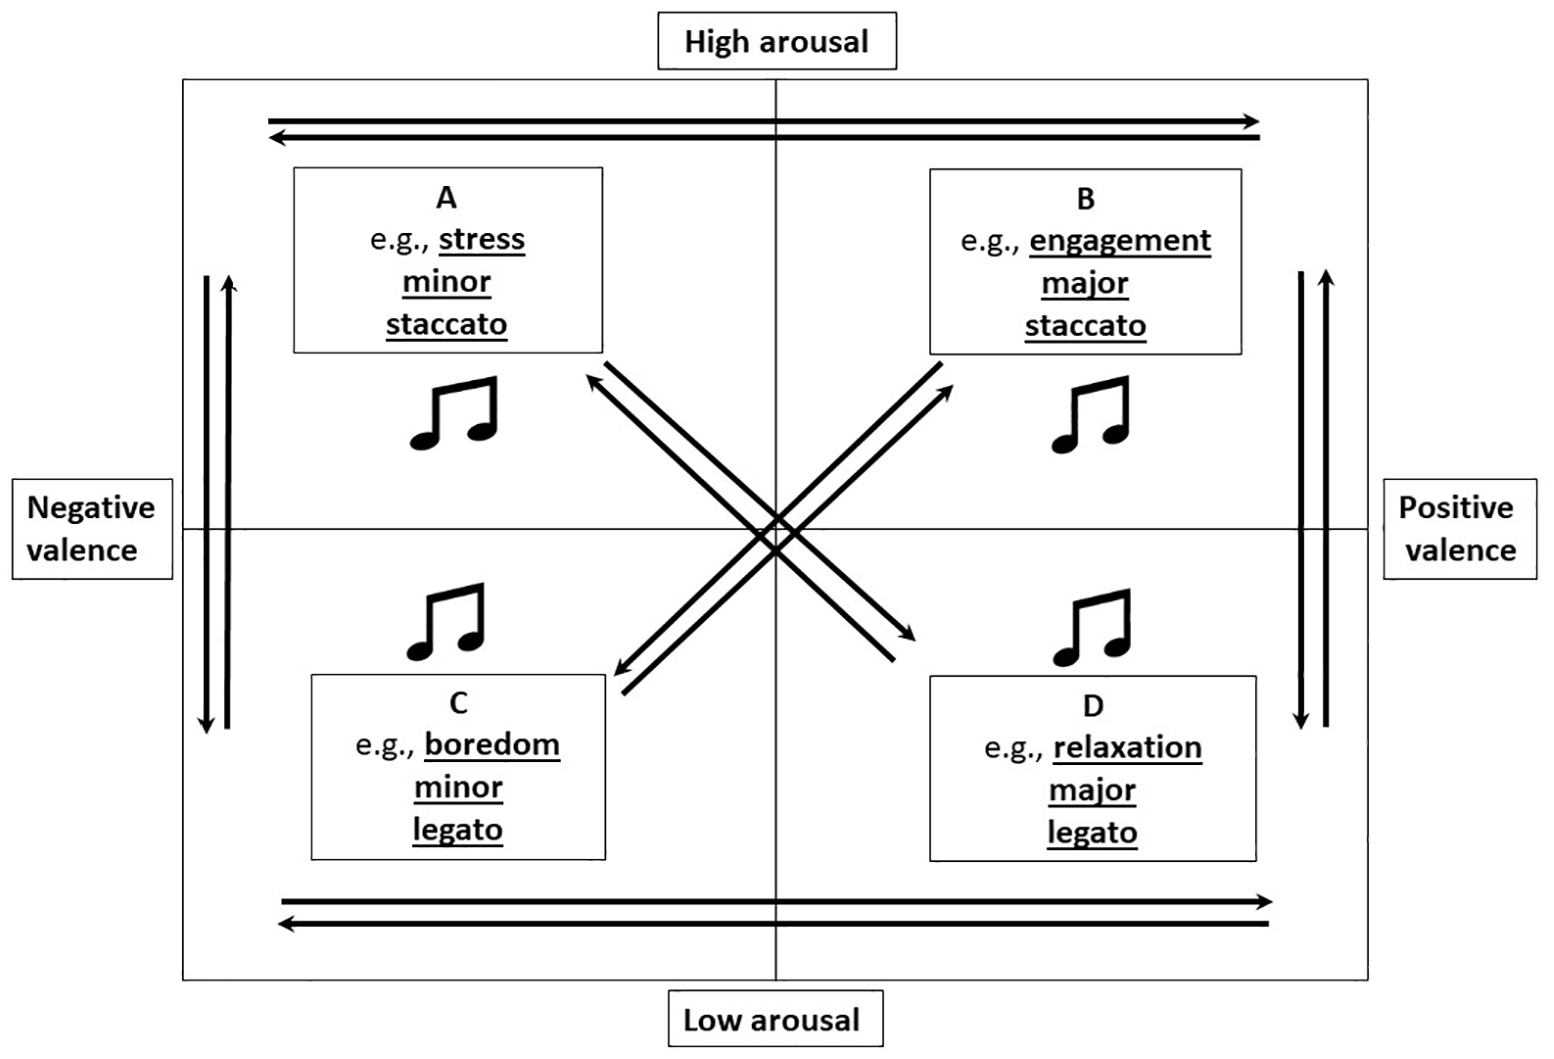
The circumplex model applied to the music condition.
The quadrants defined by the arousal and valence axes (Posner et al., 2005; Russell, 1980, 2003) are represented as four affective states: A (stress), B (engagement), C (boredom), and D (relaxation). There are 12 potential transitions between them: vertical (AC-CA and BD-DB), horizontal (AB-BA and CD-DC), and oblique (AD-DA and BC-CB).
Participant
The single participant in this study was a 27-year-old male with no formal musical background. He participated voluntarily without any monetary compensation and provided written informed consent. The study was approved by the Bioethical Committee of the University of Turin (Project Code Protocol 0657478).
Stimuli
Image condition
A total of 156 emotion-inducing images were taken from the IAPS dataset (Lang et al., 2005). As shown in Figure 4, the images had been assigned standardized scores for arousal and valence, as determined by the 9-point Likert-type scale of the Self-Assessment Manikin (SAM) (Lang et al., 2005). We chose images that had scored both high (scores ⩾ 6) and low (scores ⩽ 4) for arousal and valence.
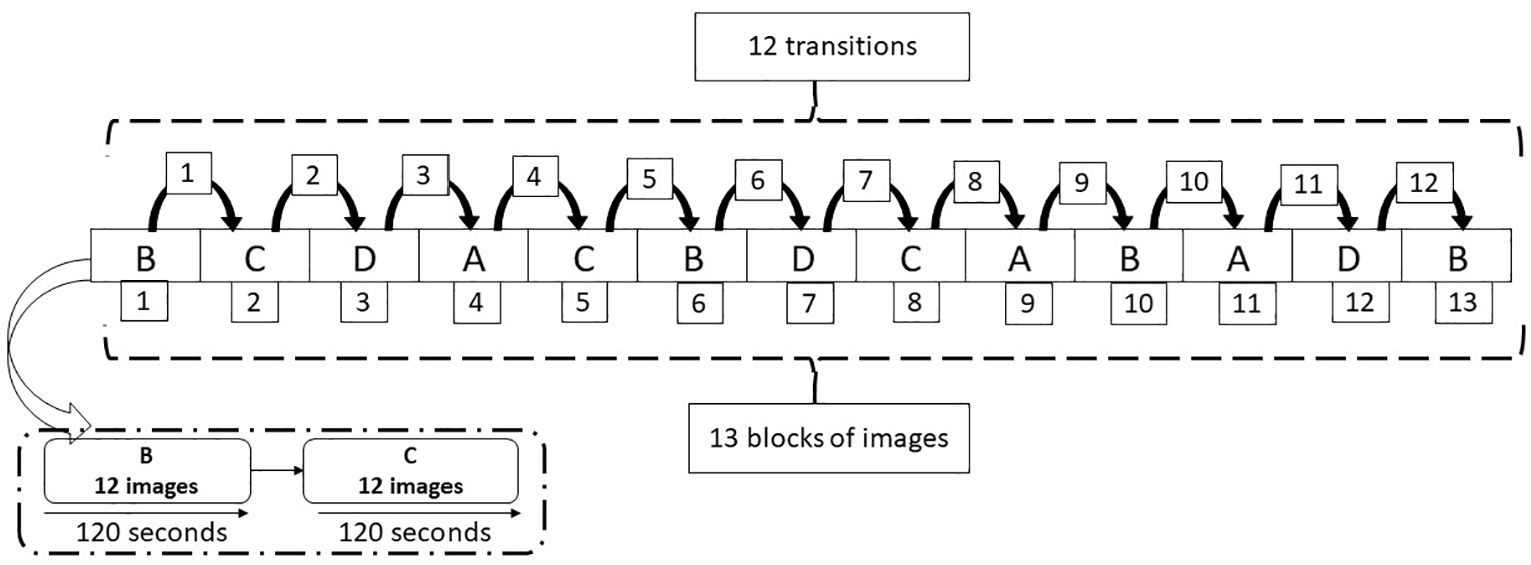
Example of a sequence of blocks of images and possible transitions.
Music condition
Twelve melodies, each one lasting 2 min, were specially composed by a graduate from a music conservatoire. The melodies had the same chords and rhythm but varied according to initial mode (major/minor), to represent valence (positive/negative), and initial articulation (staccato/legato), to represent arousal (high/low). Each melody contains a transition from one mode to the other and from one type of articulation to the other. In this way, the melodies encompassed the arousal-valence pairings (Costa et al., 2004; Quinto et al., 2014) illustrated in Figure 5.
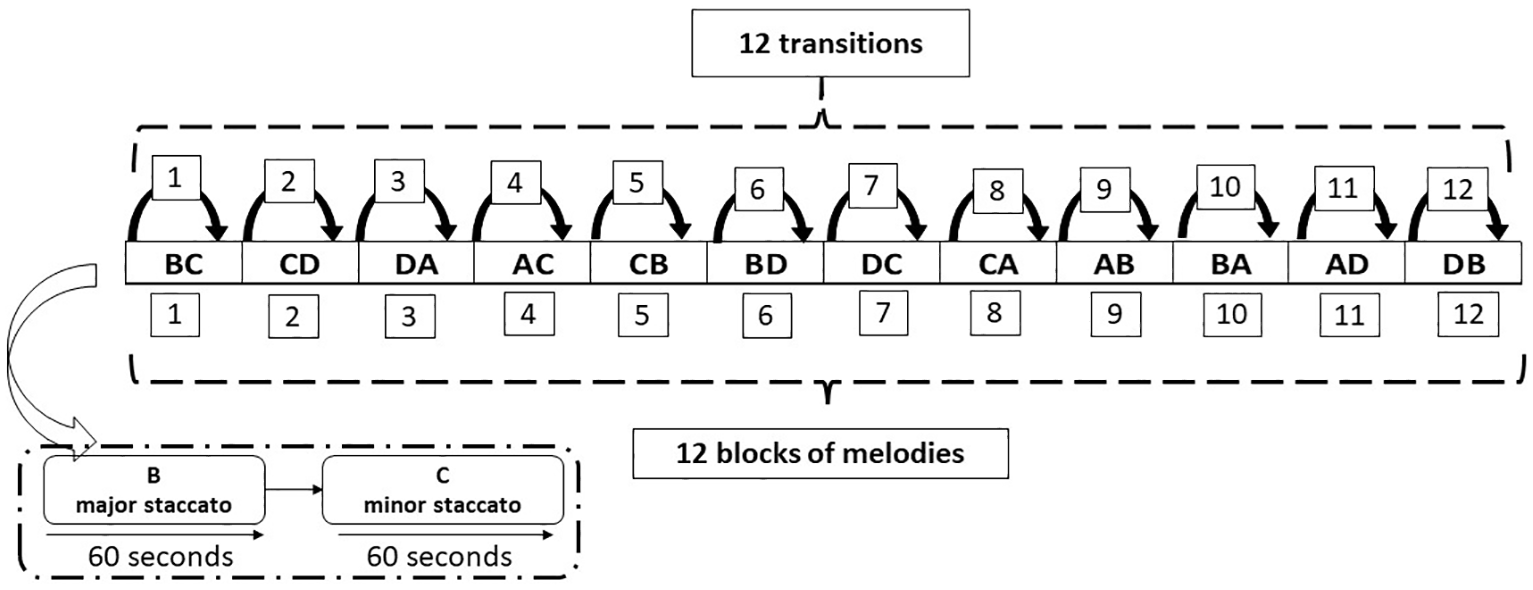
Example of a sequence of blocks of melodies and possible transitions.
Apparatus
We used the Nexus 4 system with Biotrace software (Version 2008a) to collect physiological signals. For the fEMG recordings, bipolar surface electrodes were placed on the left side of the face following standard guidelines (Cacioppo & Petty, 1981; Cacioppo et al., 1986). Specifically, for the corrugator muscle (fEMG1), electrodes were positioned directly above the brow at an oblique angle, with one electrode placed above the medial end of the brow and the second electrode placed laterally and slightly above the first. For the zygomatic muscle, electrodes were placed along the imaginary line connecting the cheilion and the preauricular depression, approximately midway between them (fEMG2). Before the electrodes were placed, the skin of the participant’s face was thoroughly cleansed with alcohol and slightly rubbed to ensure optimal signal quality and impedance levels below 10 kΩ. GSR was measured using two Ag/AgCl electrodes placed on the distal phalanges of the non-dominant hand. The data were collected continuously throughout the experiment, ensuring high-resolution recordings suitable for the detailed analysis of affect dynamics. All physiological signals were recorded simultaneously and sampled at a frequency of 1024 Hz. Furthermore, a 50-Hz notch filter was applied during both sessions to remove power line interference.
Procedure
We used fEMG and GSR measures to assess the participant’s affect dynamics while viewing images and listening to music (Borghesi, Chirico, & Cipresso, 2023; Mauri et al., 2010; Picard et al., 2001; Simoncini et al., 2024). The experiment involved two sessions conducted a week apart, one for each condition (image and music). Both sessions took place in a laboratory at the University of Turin. First, we described the purpose of the experiment and asked the participant to sign a form consenting to the processing of his personal data. Second, we attached the sensors and recorded preliminary data to confirm that the sensors were connected. Third, we recorded data in the two conditions.
As shown in Figure 6, in the image condition the participant sat comfortably in a chair positioned 1 m away from a 42-inch desktop monitor. The chair had a headrest and arm rests to minimize the risk of the participant’s head and arm movements compromising the quality of the data captured by the sensors. The participant viewed 13 blocks of 12 images (a total of 156), with each image displayed for 10 s (a total of 26 min). In the music condition, the participant was seated as in the image condition, but the screen of the monitor was black and the participant wore wired headphones connected to the monitor. He listened to 12 melodies, each lasting 2 min, with 30-s breaks between them (a total of 30 min). The wired headphones were connected to the desktop monitor, which had a black screen throughout the experiment.
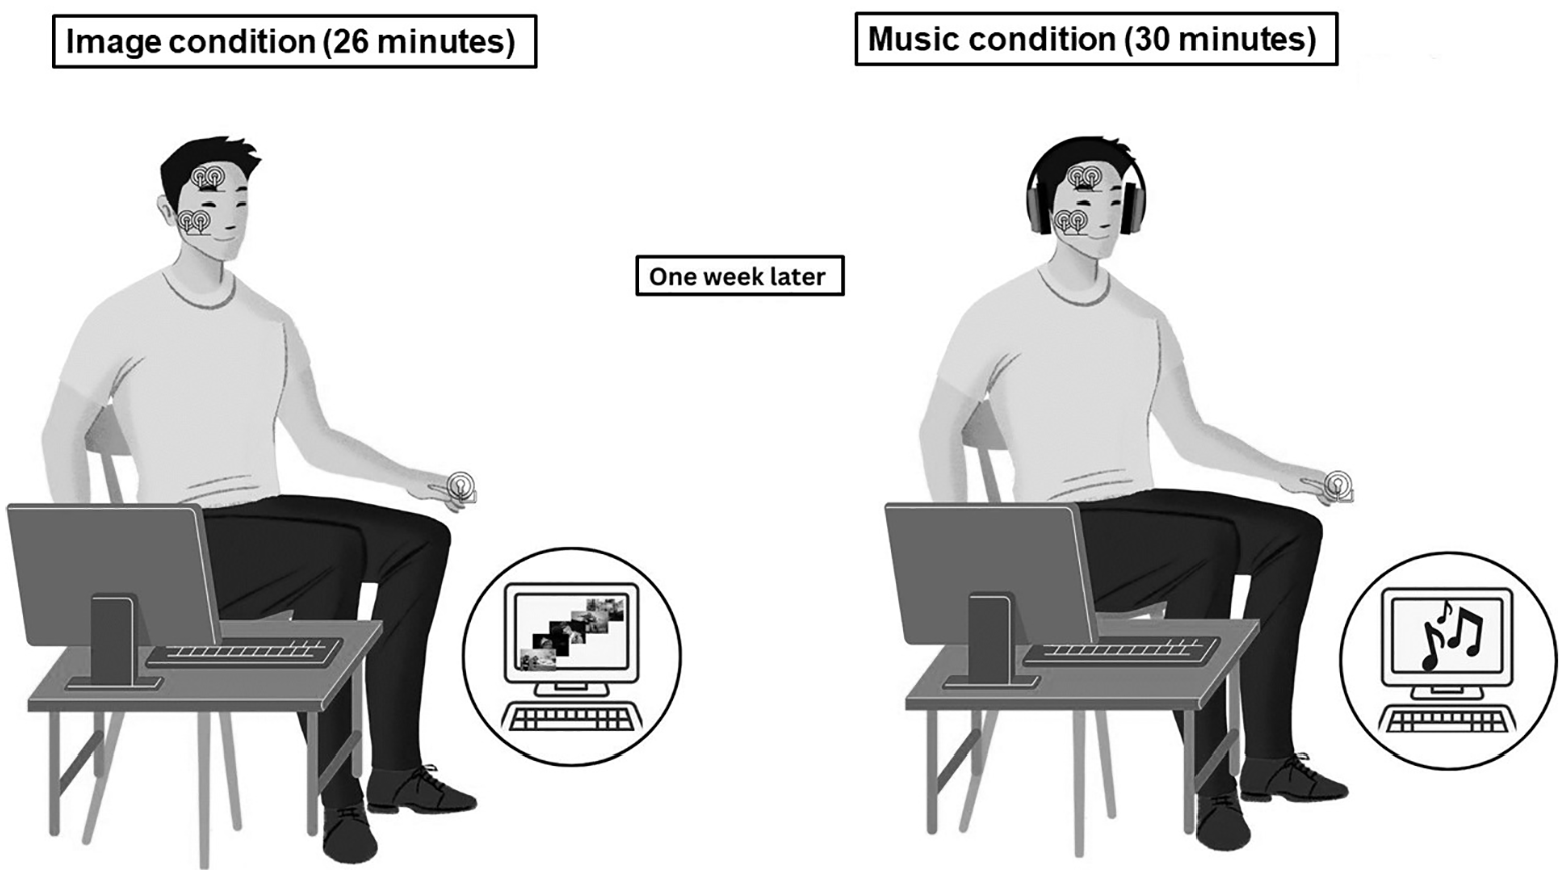
Experimental setup for image and music conditions.
For the purposes of analyzing synchronized data, we recorded the exact time (hh/mm/ss) at which the images began to be shown and the music began to be played. We took the fEMG and GSR measures described above in both sessions (Cacioppo & Petty, 1981; Cacioppo et al., 1986; Cipresso et al., 2019; Liu et al., 2018; Tan et al., 2011).
Signal processing was performed using MATLAB 9.13.0 (R2023a) (The Mathworks, Inc., Natick, MA, USA). The EMG signals were band-pass filtered between 20 and 500 Hz to remove motion artifacts and electrical noise. Following automated filtering, visual inspection was conducted to identify and remove any remaining artifacts. EMG amplitude was used as an emotional intensity index, measuring facial muscle activation magnitude quantitatively (Carroll & Russell, 1996; Dimberg, 1990; Durand et al., 2007; Jayendhra et al., 2021; Rubin, 2019; Soleymani et al., 2016).
GSR data preprocessing included artifact reduction through visual inspection and automated detection of signal discontinuities. Following artifact removal, the mean conductance level was computed for each experimental epoch (Kipli et al., 2022). Custom MATLAB scripts were developed to implement all signal processing and analysis procedure.
Data analysis
Data analysis was conducted sequentially in two phases: (1) computation of affect-transition indices and (2) analysis of transition patterns using a Markov chain model. We used noise-to-signal ratio (N/S), which represents the complement of the traditional signal-to-noise ratio (SNR) for both fEMG and GSR measurements to quantify affect transitions. This approach characterizes intrinsic variability within the system while remaining independent of the unit of measurement (Kipli et al., 2022; Raez et al., 2006). We chose this normalized variability index, which we refer to as δ, and which ranges from 0 (minimal variability) to 1 (maximal variability), because it expresses the relative dispersion of signal values around the mean and thus enables the analysis of transitions within a probabilistic system, such as Markov transition matrices, without being influenced by the units of measurement (Borghesi & Cipresso, 2024). The δ coefficient representing N/S is calculated as follows

where xi are the observed values, and n is the sample size. We calculated these normalized measurements of variability for each block. To measure baseline affective state, we analyzed a 30-s section of data collected in each condition: the central 45–75 s in the image condition and the first 30 s in the music condition. We carried out transition analysis on 30-s sections of data between blocks of stimuli, adjusting the timing in the two conditions: 120 ± 15 s in the image condition and 60 ± 15 s in the music condition, as illustrated in Figure 7.
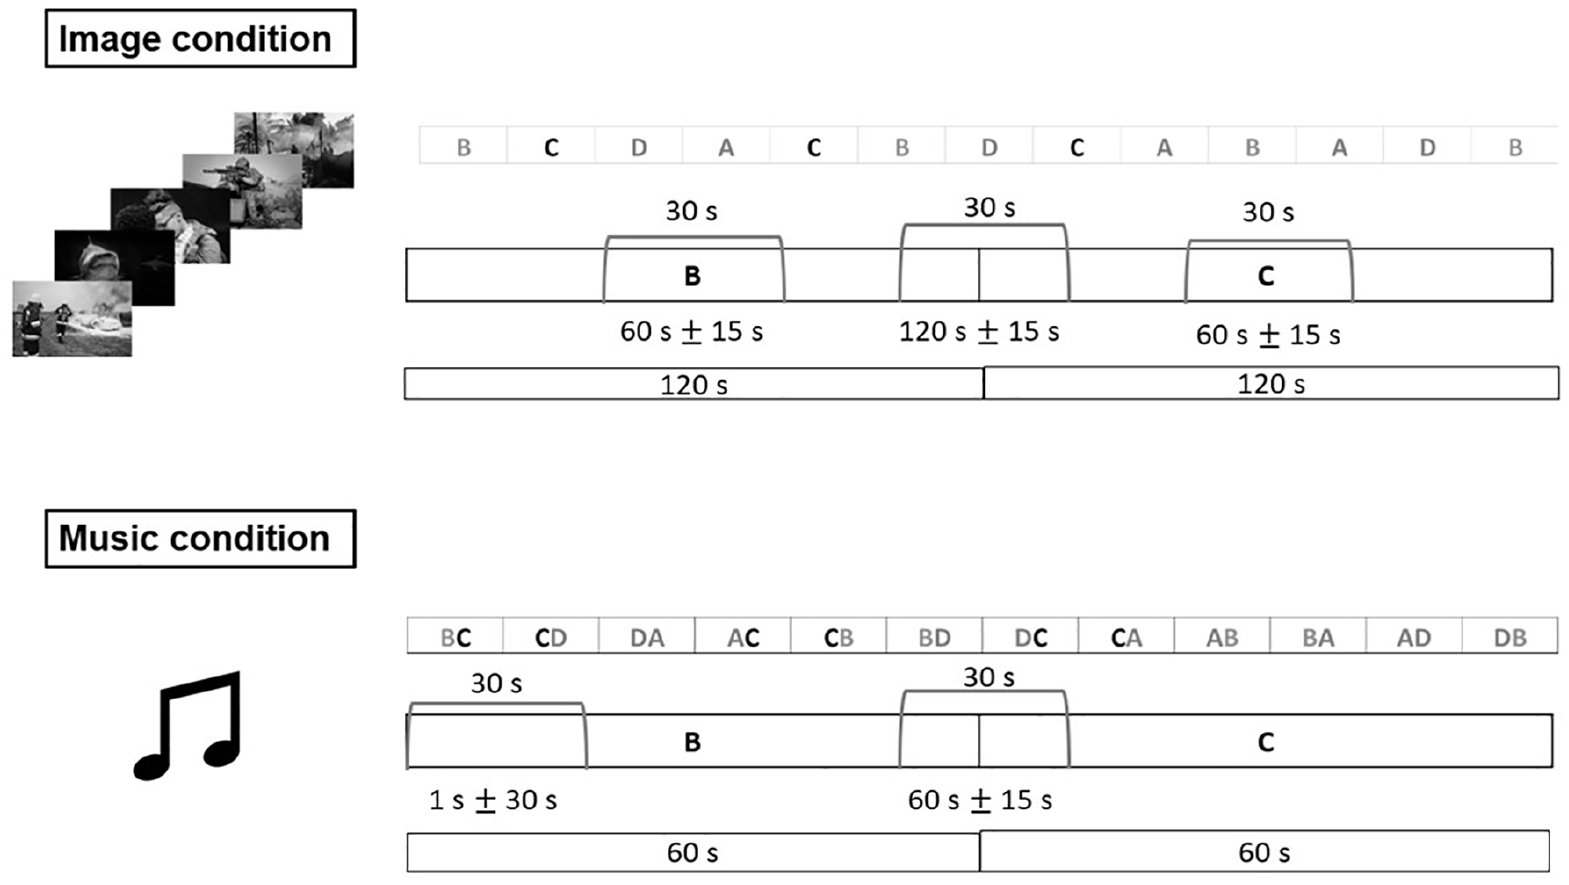
Sequence of blocks and timings of transitions between states and baseline affective states in the image and music conditions.
For each condition we computed 16 δ indices representing four baseline affective state measurements and 12 affect transitions. We did this for each of the three measures (fEMG1, fEMG2, and GSR), yielding a total of 48 δ index values per condition. We used the data to construct transition matrices in which the δ indices were relativized to represent the probabilities of transition variability from one block to another in relation to the overall variability of transitions. Relativization was necessary because the total sum of transitions in Markov matrices must equal 1. The relativization process used a new index (Δ) quantifying the relative magnitude of variability in a transition compared to the overall variability of all transitions within a given row and thus the extent to which a specific transition contributes to the overall variability of the transition matrix (Borghesi, Chirico, & Cipresso, 2023; Borghesi & Cipresso, 2024; Cipresso et al., 2023), as shown in Figure 8. Δ is computed as the ratio of the δ value for a specific transition to the total δ values in the corresponding row of the matrix.
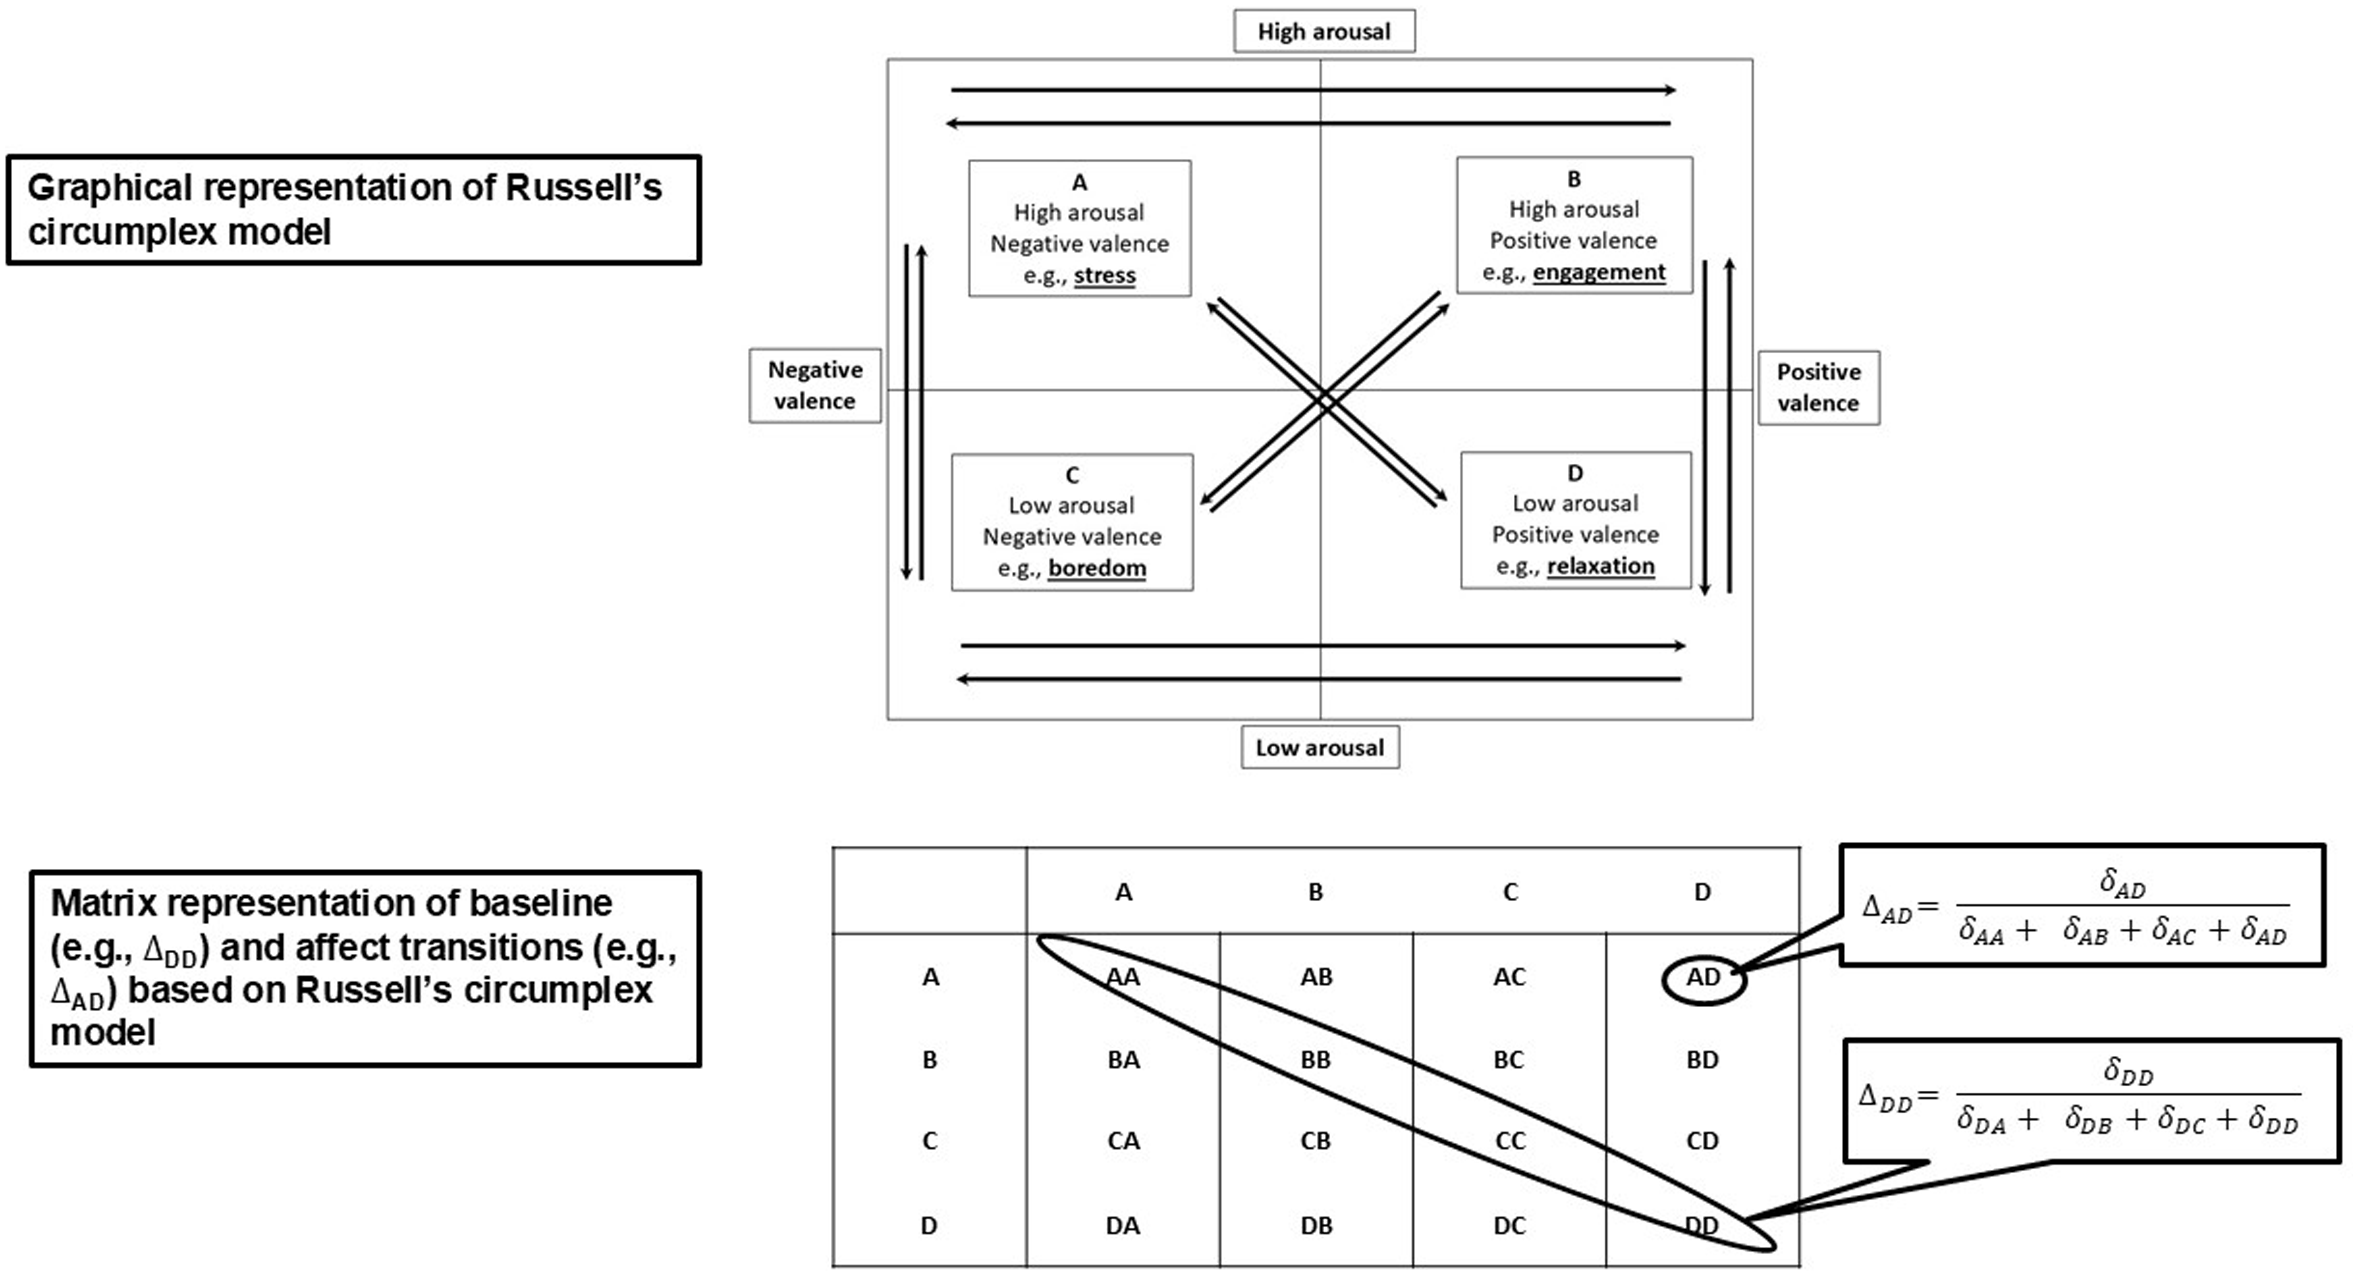
Markov chain transition matrix based on Russell’s circumplex model.
Mathematically, the Δ index is defined as

Here, δij represents the variability index for the transition from state i to state j, while
The index reflects two key aspects of variability: the diagonal elements (Δ ii ) capture baseline affective state, which indicates the tendency to remain in the same state, whereas the off-diagonal elements (Δ ij ) capture transition variability, representing the likelihood of moving between different states
We used Matlab R2023a to calculate the Markov chain assuming equal probabilities of transition [
Results
Computation of affect-transition indices
The transition matrices resulting from the analyses described above are shown in Table 1.
Transition matrices for fEMG1, fEMG2, and GSR measurements in the image and music conditions.
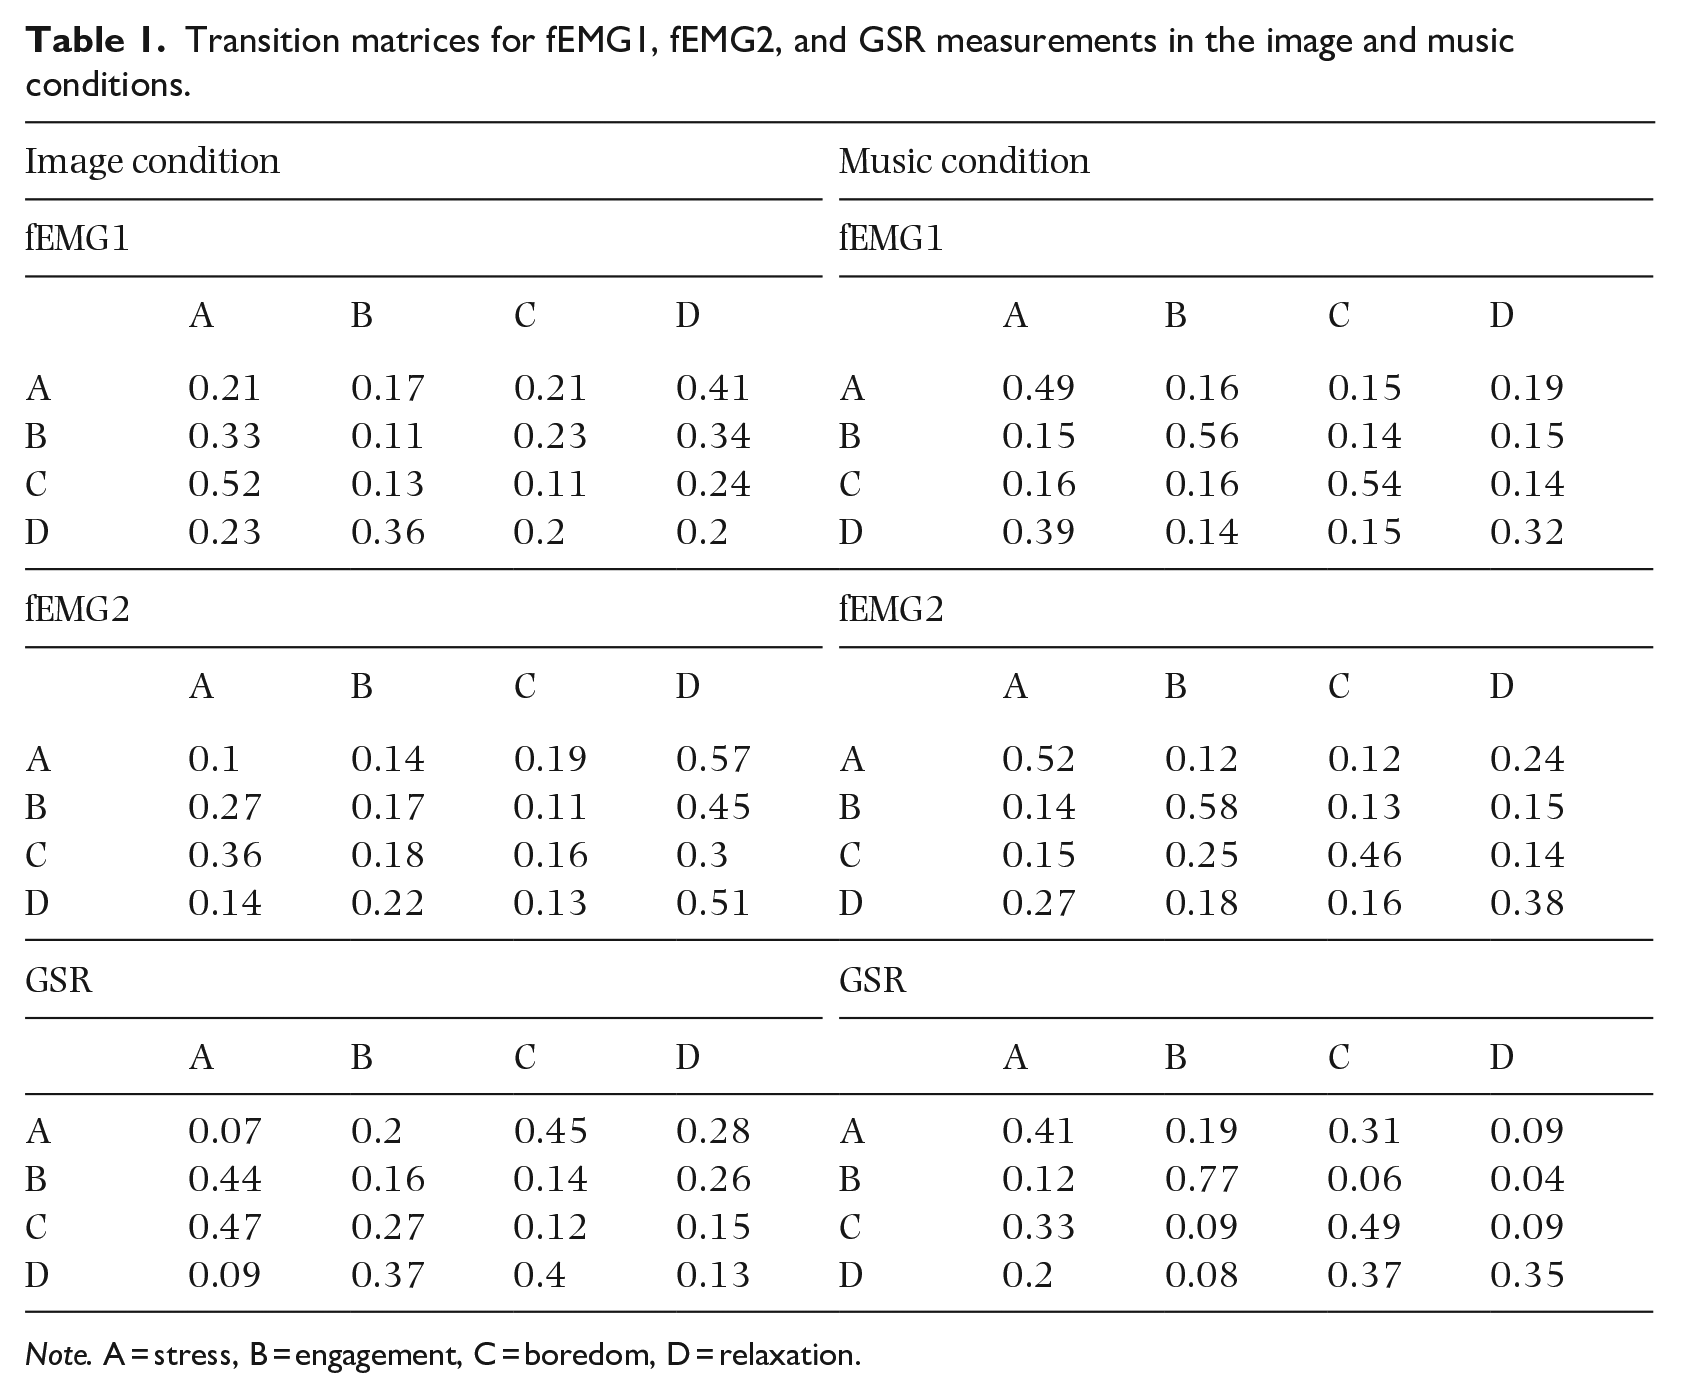
Note. A = stress, B = engagement, C = boredom, D = relaxation.
Analysis of transition patterns using a Markov chain model
We extracted transitions from the baseline affective state as well as the three types of affect transitions described in the Design sub-section of the Method section. These transitions were categorized as follows: baseline affective states (AA, BB, CC, DD), vertical transitions (AC, CA, BD, DB), horizontal transitions (AB, BA, CD, DC), and oblique transitions (AD, DA, BC, CB). All indices were calculated based on the sum of the probabilities of individual transitions in each category for image and music conditions (Table 2).
Probabilistic analysis of baseline affective state and affect transitions (e.g., vertical, horizontal, and oblique) in image and music conditions.
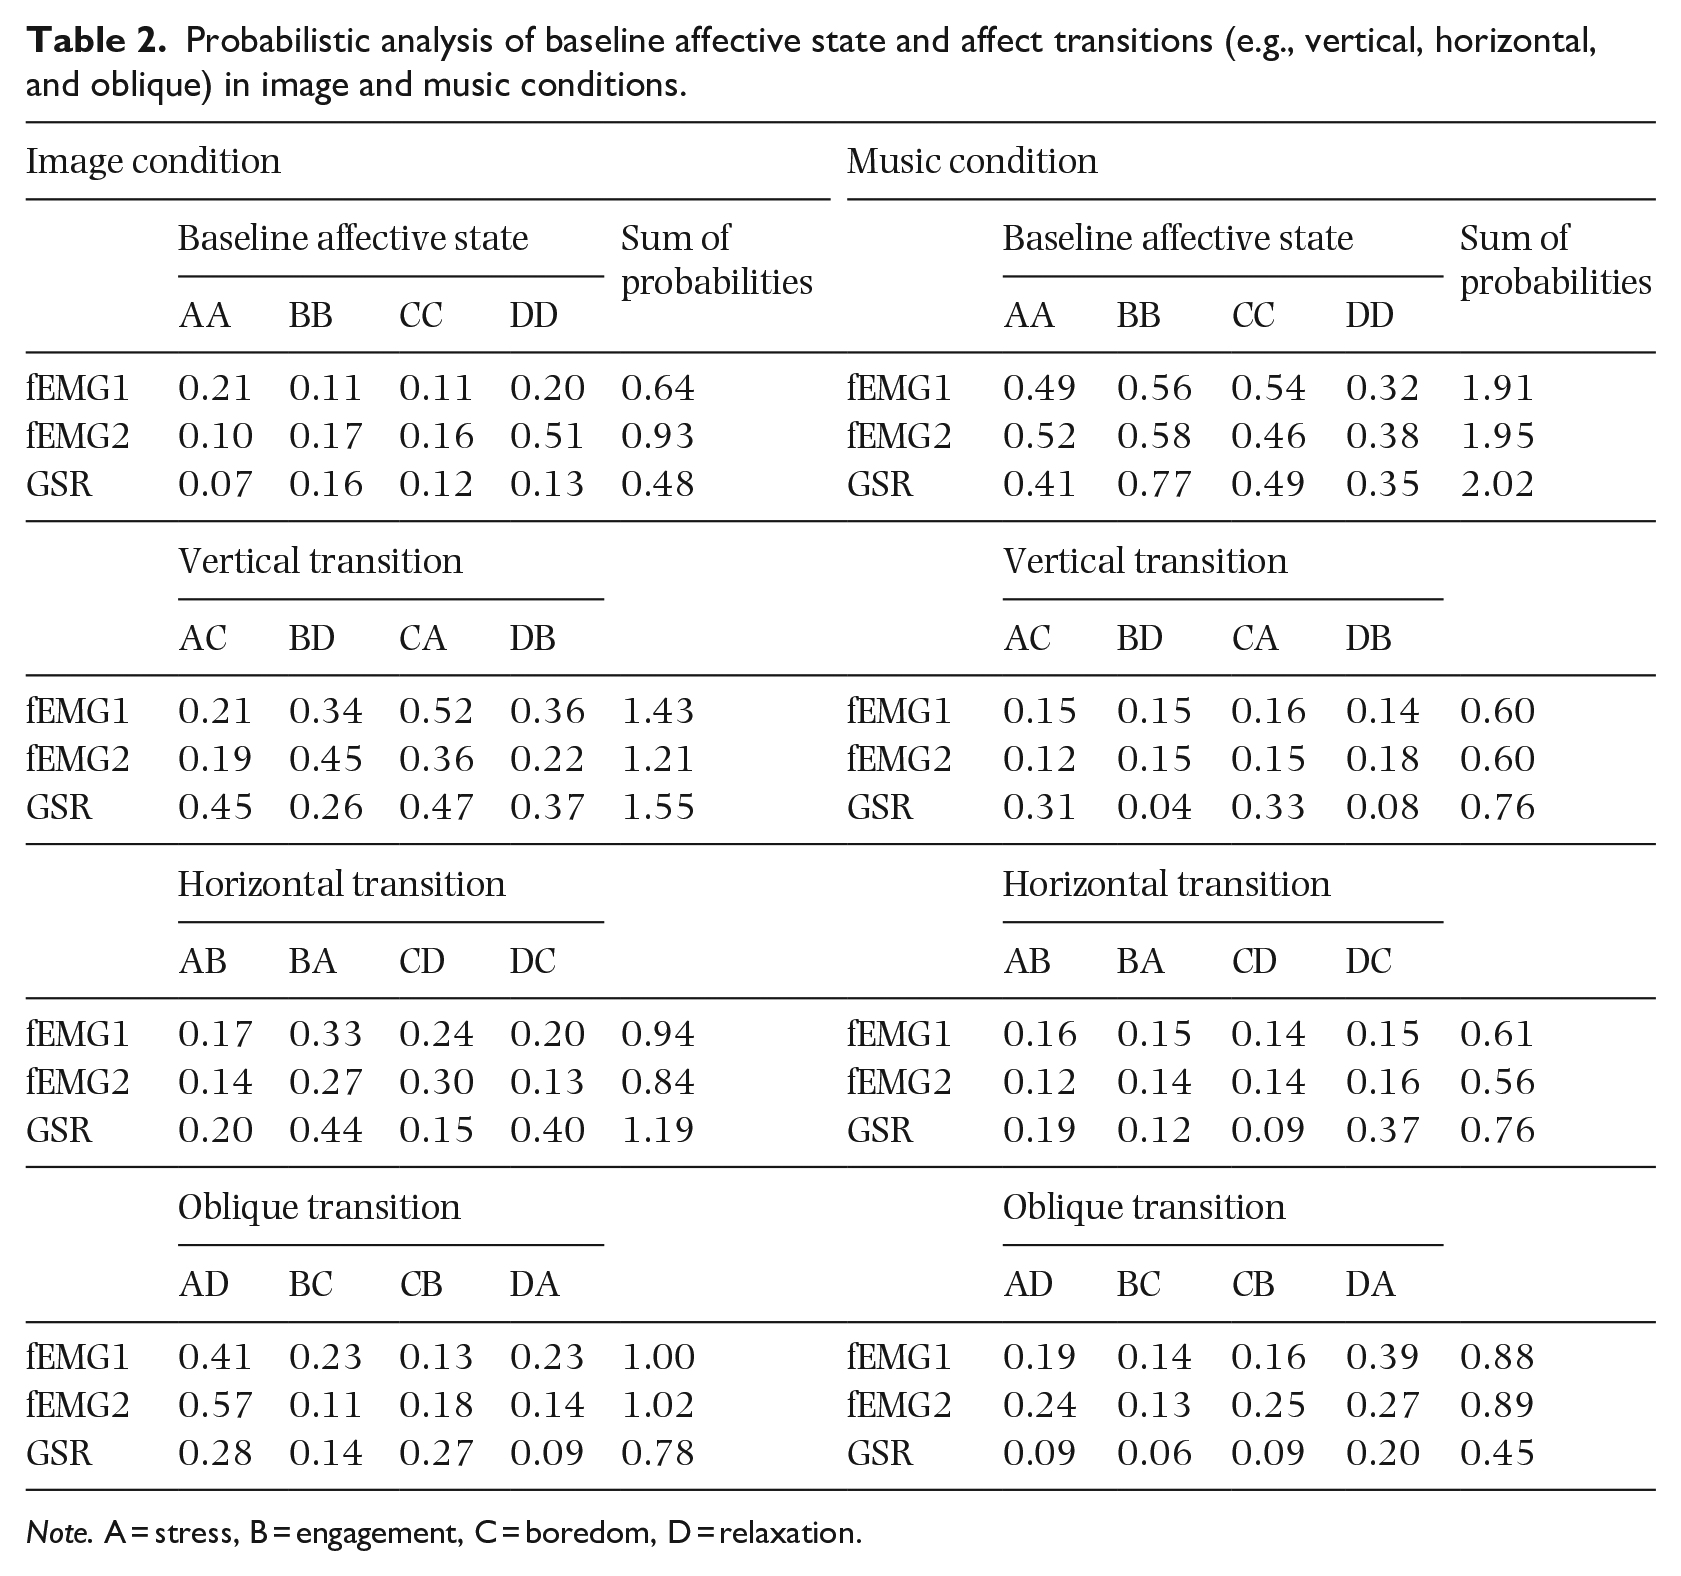
Note. A = stress, B = engagement, C = boredom, D = relaxation.
As shown in Figure 9, there are slightly different patterns of affect dynamics in the image and music conditions. Overall, there was a peak in probabilities for vertical transitions across all three signals (
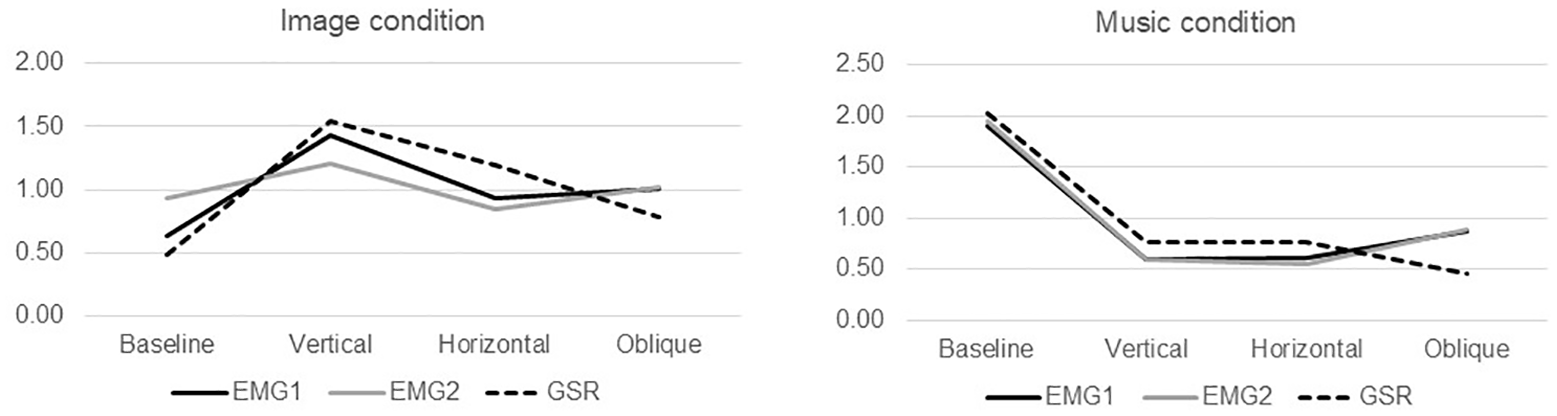
Comparison of transitions from baseline affective states and vertical, horizontal, and oblique affect transitions in image and music conditions.
Discussion
To the best of our knowledge, we are the first to compare affect dynamics in the context of listening to emotion-inducing music with affect dynamics in the context of viewing emotion-inducing images. Our primary goal was to develop and implement an experimental design that would allow us to measure affect transitions in both image and music conditions, and our secondary goal was to test the use of a Markov chain to analyze and compare the data gathered in the two conditions. We met our primary goal by identifying appropriate visual stimuli and commissioning the composition of musical stimuli containing tonal and rhythmic transitions corresponding to the induction of corresponding affect transitions as described in the literature; the use of these stimuli enabled us to examine transitions between affective states rather than the states themselves. We met our secondary goal by using Markov chains to predict the likelihood of remaining in a particular affective state or shifting to another one, as inferred from the results of physiological measurements (fEMG1, fEMG2, and GSR) taken from a single participant representing his emotional responses while viewing images and, subsequently, listening to music.
The participant’s emotional responses differed in the two conditions. Baseline affective state measures yielded higher values for all physiological indicators in the music condition than in the image condition, suggesting that listeners’ initial emotional responses to music are more intense than viewers’ initial emotional responses to images. This heightened baseline response might reflect the intrinsically dynamic and temporally structured nature of music. For affective transitions, however, there was higher variability in all the physiological indicators in the image condition than in the music condition, particularly for vertical (changes in arousal but not valence) and, to a lesser extent, horizontal transitions (changes in valence but not arousal). This suggests that even if viewers’ initial emotional responses to images are less intense than listeners’ initial emotional responses to music, their emotional responses to images may change more dynamically as they view them over time.
The contrast between the patterns revealed by the baseline affective state measures and the affect transitions in the two conditions points to differences between the way musical and visual stimuli are processed emotionally. Music appears to create more stable but more intense emotional states, while visual stimuli seem to facilitate more dynamic emotional transitions. This distinction could reflect their different temporal characteristics: musical stimuli unfold over time with their own inherent emotional trajectories, whereas visual stimuli might allow for more immediate and flexible emotional reappraisal.
These results enhance our understanding of modality-specific emotional processing and suggest that the temporal structure of stimuli plays a crucial role in shaping both the intensity and dynamics of emotional responses. Future research should further investigate these modality-specific patterns, particularly focusing on the mechanisms underlying the differential effects of temporal versus static emotional information processing (Kim & Wedell, 2016; Koehler et al., 2023). An individual’s ability to shift between affective states may both affect and be affected by their emotion-regulation abilities and mental flexibility (Borghesi, Chirico, Pedroli, et al., 2023; Sanseverino et al., 2023); this could be explored in future studies. High levels of affective and cognitive flexibility have been shown to be correlated with more dynamic transitions between affective states, resulting in lower values on the diagonal, indicating consistency with the baseline affective state (Borghesi, Chirico, & Cipresso, 2023; Borghesi, Mancuso, Bruni, et al., 2023). Flexibility could explain how people shift from one affective state to another, while rigidity could make this more difficult. It would be worth conducting future research to establish if correlations between flexibility and affective transitions are specific to or independent of domain (e.g., images vs. music). Such research could provide valuable insights into the affect transitions that pose the greatest challenges for individuals.
Limitations and future directions
Two limitations of the study should be addressed in future research. First, we gathered and analyzed just three physiological measures (fEMG and GSR); additional measures such as heart rate variability could yield a fuller understanding of individuals’ emotional responses to visual and musical stimuli. Second, our goals were to develop and implement an experimental design and to test the use of a Markov chain to analyze data. We met these goals by conducting a case study with a single participant, but in future the methods should be replicated, and the findings validated, in a study with multiple participants.
Theoretical implications
The findings of the study suggest that future theories of the perception of emotions in music, and emotional responses to music, should incorporate affect dynamics. We introduced a novel theoretical framework for examining all potential transitions between initial and ongoing affective states in the form of a Markov chain. Finally, we have contributed to an understanding of emotion perception in different modalities by identifying differences between the affect dynamics elicited by visual and musical stimuli.
Practical implications
The findings of our research have implications for practice in the fields of mental health, generally, and music therapy, specifically. In the field of mental health, affect transitions could be used as a diagnostic tool for recognizing emotion-related problems, such as anorexia, alexithymia, anxiety disorders, depressive symptoms, and bipolar disorders, and managing them (Flaig & Large, 2014; Juslin & Västfjäll, 2008; Wesseldijk et al., 2019). Variation in patients’ moods can be used as an early indicator of improvement or deterioration in patients’ emotional states, so the analysis of affect transitions could allow mental health professionals to intervene promptly where necessary and customize therapies based on patients’ individual needs.
In the field of music therapy, music is typically used as a therapeutic tool. Teaching patients to recognize, accept, and regulate their emotions through affect transitions when listening to music may prove effective in managing emotional disorders. Such transitions can serve as reference points for patients, helping them to understand that changes in emotional state are a normal part of life and can be controlled and even healthy. This approach could have a positive effect on patients’ mental health, encouraging them to develop greater emotional awareness and self-regulation skills (Borghesi, Mancuso, Bruni, et al., 2023). Virtual-reality tools could combine visual and musical stimuli in a fully immersive visuo-auditory representation to induce and regulate affect transitions (Borghesi, Mancuso, Pedroli, et al., 2022; Borghesi, Murtas, Mancuso, et al., 2023; Borghesi, Murtas, Pizzolante, et al., 2023).
Supplemental Material
sj-zip-1-msx-10.1177_10298649251324343 – Supplemental material for A new method of exploring affect dynamics in music: A psychometric model based on stochastic processes
Supplemental material, sj-zip-1-msx-10.1177_10298649251324343 for A new method of exploring affect dynamics in music: A psychometric model based on stochastic processes by Francesca Borghesi, Eleonora Diletta Sarcinella, Valentina Mancuso, Alice Chirico and Pietro Cipresso in Musicae Scientiae
Footnotes
Acknowledgements
We sincerely thank Editor-in-Chief Jane Ginsborg and guest editors Alice Chirico and Andrea Scanziani for their valuable support and guidance. A special thanks to the musician, Mr. Gennaro Garofalo, for his contribution to the melodies composed.
Funding
The authors disclosed receipt of the following financial support for the research, authorship, and/or publication of this article: The research was funded by PON R&I 2014-2020 (FSE REACT-EU), Grants PRIN 2022 PNRR P2022PXAZW funded by European Union NextGenerationEU and 2022-1-NL01-KA220-ADU-000089289 Stichting Anatta Foundation Nurturing Nature Intelligence in Adults through a Mobile App and Training Programme.
ORCID iDs
Data availability statement
The datasets used and/or analyzed during the current study are available from the corresponding author upon reasonable request.
Supplemental material
Supplemental material for this article is available online.
References
Supplementary Material
Please find the following supplemental material available below.
For Open Access articles published under a Creative Commons License, all supplemental material carries the same license as the article it is associated with.
For non-Open Access articles published, all supplemental material carries a non-exclusive license, and permission requests for re-use of supplemental material or any part of supplemental material shall be sent directly to the copyright owner as specified in the copyright notice associated with the article.