
Abstract
In the speech-to-song illusion, certain spoken sentences start sounding like song when repeated several times. This perceptual transformation does not occur for all stimuli, suggesting that acoustic properties of the stimulus may contribute to the illusion. We investigated the contribution of the acoustic properties of vowels to this phenomenon by analyzing the acoustic vowel-space area bounded by formant frequencies of /i/, /æ/, and / ɔ/ in a dataset of transforming (illusion) and non-transforming (non-illusion) stimuli. In general, larger vowel-space areas are associated with more acoustic distinctions between vowel categories. We found that the overall vowel space was larger in non-illusion than illusion stimuli. A possible reason for this difference may be that listeners learn to associate large vowel spaces with speech and small vowel spaces with song through exposure to differences between formant frequencies in spoken and sung vowels. We propose that the shifted vowel spaces in which non-illusion sentences may be associated with speech perception thereby activate speech processing circuitry that inhibits the illusion of their transformation into song.
Keywords
Listeners can usually determine without any effort whether they are hearing speech or song. The fact that the two modes are perceived to be so different implies that there are clear acoustic differences between them. Indeed, some differences between them relate to rhythm and pitch. Song has greater temporal regularity than speech, which usually lacks a steady beat (Dalla Bella et al., 2013). In song, target pitches are maintained relatively steadily, while pitch in speech moves up and down during syllables (Lindblom & Sundberg, 2007). Singing and speaking are similar in that they both involve phrases of connected words that go up and down in pitch and that correspond to breathing patterns. Furthermore, some types of speech—in particular, speech directed to babies and pets—seem to share more acoustic characteristics with song than everyday speech (Ben-Aderet et al., 2017; Kuhl et al., 1997). Interestingly, the acoustic distinction between speech and song disappears in the case of the speech-to-song (STS) illusion whereby spoken sentences are initially perceived as speech, but when they have been repeated several times, begin to sound like song. This illusion shows that, in some circumstances, the distinction between speech and song is purely perceptual rather than acoustic. The STS illusion has attracted widespread interest due to its potential to inform us how auditory information is processed as either music or speech in the brain. However, the acoustic characteristics of spoken sentences perceived to have become transformed into song are not well understood. As a first step, this study aimed to examine the distribution of acoustic vowel features in the STS illusion.
The STS illusion
Diana Deutsch became aware of the effect of repetition on the perception of spoken language when she was editing recordings of her commentary on a CD about music and the brain (Deutsch, 2003, 2019), which included the phrase “sometimes behave so strangely.” Deutsch et al. (2011), showed that short spoken phrases could apparently be transformed into song simply by repeating them, while the sound signal remained exactly the same. In follow-up studies it was found that the STS illusion was not limited to the original stimulus, as it could be achieved with other phrases and in languages other than English (Falk & Rathcke, 2010; Tierney et al., 2013), illustrating the robust nature of the finding. Although Tierney et al. (2013) found a consensus between participants as to the phrases that could and could not be transformed, the illusion does not occur the same way for everyone. It occurs for listeners with differing levels of musical expertise (Vanden Bosch der Nederlanden et al., 2015a), but experience does seem to make a contribution. In particular, the listener’s ability to speak a non-tonal language and the inability to understand the semantic meaning of the stimulus have been shown to predict the transformation of speech to song (Jaisin et al., 2016; Margulis et al., 2015).
The neural foundations of the STS illusion were examined by Tierney et al. (2013), who found heightened activation in several areas of the brain when listeners perceived a stimulus as song rather than perceiving the same stimulus as speech. Similar patterns of activation had previously been found in participants perceiving different song and speech stimuli (Schön et al., 2010). These findings suggest that the brain may process the stimulus, when the transformation has occurred, as though it were more like music than speech.
Not only does the strength of the illusion vary between listeners (Jaisin et al., 2016), it also varies considerably depending on the stimulus. This implies that acoustic, semantic, syntactic, or other linguistic characteristics may inhibit or contribute to the STS illusion. Although several studies have looked at the perception and cognition of the STS illusion (Castro et al., 2018; Graber et al., 2017; Hymers et al., 2015; Jaisin et al., 2016; Margulis et al., 2015; Tierney et al., 2013, 2018b; Vanden Bosch der Nederlanden et al., 2015a, 2015b), few researchers have investigated the contribution of the characteristics of the speech stimulus to the STS illusion (Castro et al., 2018; Falk et al., 2014; Tierney et al., 2018a). This is a complex task because the stimuli used in STS experiments have varied in terms of length, language, number of words, and the gender of the speaker. So far as the acoustic correlates of the STS illusion are concerned, there is evidence that more stable pitch contours within and between syllables contribute to the illusion (Tierney et al., 2013, 2018a), although the fit of the pitches to a musical key does not seem to play a significant role (Falk et al., 2014; Tierney et al., 2018a). Large pitch intervals inhibit the transformation from speech to song, while stimuli with more stable beat patterns are heard as more music-like (Falk et al., 2014; Tierney et al., 2018a).
Vowel space in speech and song
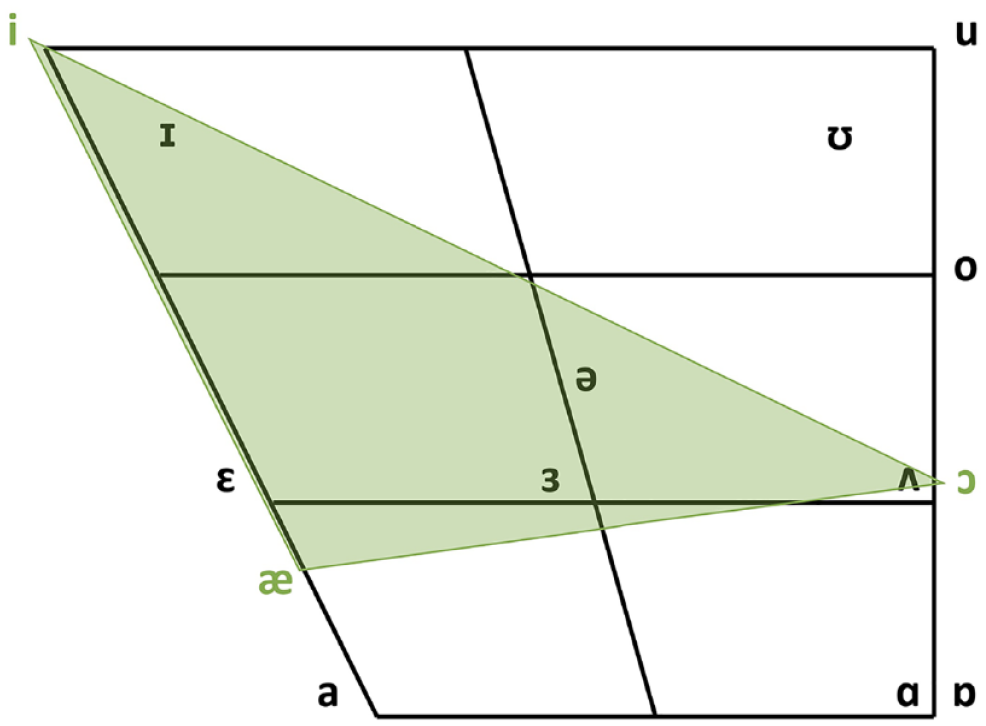
In the current study, we examined the articulatory-acoustic correlates of the STS illusion by looking at the distribution of vowels in transforming and non-transforming sentences. Research in phonetics has shown that during the production of vowels, unlike consonants, the vocal tract is unconstricted, allowing air to pass through it freely. Vowel quality was long thought to be determined by articulation and position of the tongue and lips (the articulators), specifically, tongue height, tongue backness, and roundedness of the lips (Jones, 1976). Acoustically, vowels are more accurately distinguished by the differences between their formant frequencies, which are loosely associated with the position of the articulators (Ladefoged & Disner, 2012). Vowel formants are the frequency components produced by the resonating vocal tract during the production of a vowel. Resonating cavities of different sizes are created by positioning the articulators in such a way as to amplify particular frequencies. Although the vocal tract produces several formants, vowels can usually be differentiated using only the two lowest formants (F1 and F2) by combining them to create qualities that can be identified as belonging to a particular vowel sound. For male voices, for example, the vowel sound /i/ has an average F1 value of 240 Hz and an F2 value of 2,400 Hz, while /a/ has an average F1 of 850 Hz and F2 of 1,610 Hz (Catford, 1988). The positions of vowels are still traditionally described and charted theoretically by reference to the articulatory features of the tongue and lips, but they can also be represented acoustically by plotting F1 values against F2 values. A schematic representation of the articulatory-acoustic vowel space can be seen in Figure 1. The y-axis shows F1 frequencies in inverse order, in which the vowels with the highest F1 values are closest to the bottom of the vowel chart. F2 is represented on the x-axis, also in inverse order. Vowels with higher F2 values are closer to the left of the chart.
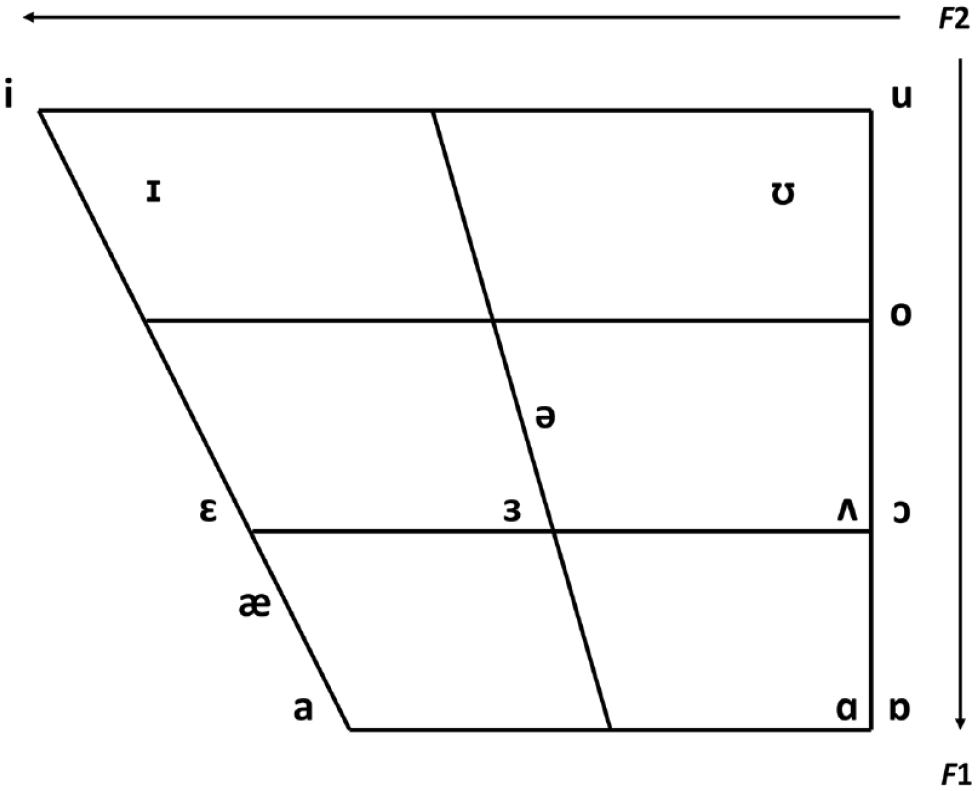
Schematic chart of traditional articulatory positions and acoustic F1–F2 combinations of vowels.
In several studies the characteristics of vowel formants have been investigated in different conditions, such as in children and adults (Pettinato et al., 2016), normal and loud speech (Koenig & Fuchs, 2019), infant-directed speech (IDS) and adult-directed speech (Kuhl et al., 1997; Miyazawa et al., 2017), and pathological speech (Sapir et al., 2010; Skodda et al., 2012). Vowel-space analysis can often provide useful information about the behavior of formants. A speaker’s vowel-space area (VSA) is bounded by lines connecting the F1–F2 values of vowels located at the periphery of the vowel production space. If this space is large, vowel coordinates are far away from each other and the vowels sound highly differentiated or “hyperarticulated” (Kuhl et al., 1997, p. 685). In a compressed vowel space in which vowels are closer together, or more centralized, there may be more overlap between vowel categories so that vowels sound less distinctive. Previous research has shown that clear speech is associated with vowel-space expansion (Lam et al., 2012; Picheny et al., 1986; Whitfield & Goberman, 2017). Perceptually, larger vowel spaces contribute to the intelligibility of speech (Ferguson & Kewley-Port, 2007). Speech traversing a large vowel space may also be perceived as faster speech than speech with more centralized vowels (Weirich & Simpson, 2014). Vowels judged as best instances by listeners tend to have more extreme formant values than those considered as poor examples (Kuhl, 1991). Compressed vowel spaces occur in various speech disorders as well as in the speech of cochlear-implant users (Liu et al., 2005; Neumeyer et al., 2010; Weismer et al., 2001), and lead to speech that is less clear and less intelligible.
Bradley (2018) found that vowel spaces are shifted and more compressed in singing than in speaking. Formant frequencies were found to be lower overall in singing, probably because of differences between articulation when singing and speaking; also, there was less variance in singing than speaking. Bradley suggested that trained singers make aesthetic choices when they prioritize elements of sound production (see Collister & Huron, 2008). For example, the singer’s formant—a formant found at about 2,500 Hz in song but not in speech—is thought to contribute to singers’ ability to project their voices over an orchestral accompaniment (Bradley, 2018; Brown et al., 2000; Howard & Collingsworth, 1992). On one hand, sacrificing vowel differentiation to increase volume and resonance may produce smaller vowel spaces and more overlap between vowels in singing than in speech (Bradley, 2018; Collister & Huron, 2008). On the other hand, intelligibility is likely to be of primary concern in speech, producing larger vowel spaces than in singing.
The current study
Speech and song differ on various acoustic measurements apart from formant frequencies. When comparing listeners’ perception of speech and song, the nature of the contribution of production-related differences between formants is therefore unclear. That is, does a song sound like a song because the vowel space is shifted, or is the shift the result of another characteristic such as increased resonance? The STS illusion provides the opportunity to find out if the size of the vowel space plays a role in the perceptual experience of speech and song. We explored the differences between vowel formant frequencies in a corpus of known transforming and non-transforming sentences (Cornelissen et al., 2016; Groenveld et al., 2020; Tierney et al., 2013). We refer throughout the remainder of this article to the former as illusion and the latter as non-illusion stimuli, respectively. We asked if there were group differences between the distributions of vowel formants in the illusion and non-illusion sentences.
We were particularly interested to know whether the vowel space in illusion sentences was more compressed than the non-illusion sentences, that is, whether vowels were more distinctive from each other in the non-illusion stimuli than the illusion stimuli. Because expanded vowel spaces are strongly associated with clear or hyperarticulated speech (Lam et al., 2012; Whitfield & Goberman, 2017), it is possible that these vowels induce the listener to perceive the stimulus as speech. We therefore predicted that vowels with extreme formant values would inhibit the transformation from speech to song and that we would find more expanded vowel spaces in the non-illusion than the illusion stimuli.
Method
Materials
The corpus of stimuli analyzed in this study consists of 77 recordings of spoken sentences, shown either to become transformed by repetition from speech to song or to remain perceptually stable as speech. The corpus includes the 48 sentences used in Tierney et al.’s (2013) investigation of neural responses to the STS illusion. They gathered the sentences from audiobooks and showed them in experimental tests to be perceived either as speech or as song. This set of stimuli has been used since in several other STS-illusion experiments (Graber et al., 2017; Tierney et al., 2018a, 2018b). Additional sentences were obtained from the UvA Music Cognition dataset, a large collection of transforming and non-transforming sentences collected from audiobooks for use in STS experiments at the University of Amsterdam (Cornelissen et al., 2016; Groenveld et al., 2020), so that the final total of sentences in the complete dataset was 259.
For the purposes of the current study, we removed all the sentences in languages other than English and all those spoken by female speakers. We excluded female speakers because the formant frequencies of female speakers are on average higher than those of male speakers (Whiteside, 1998). Additionally, female speakers exhibit larger vowel spaces than male speakers; in other words, there are greater acoustic distances between discrete vowel categories (Diehl et al., 1996). All the sentences in our dataset were spoken by adult male speakers in American, British, or Australian English. We classified each sentence as illusion or non-illusion stimuli according to the mean ratings, as in previous experiments. The strength of the illusion varies from listener to listener (Tierney et al., 2021) and mean ratings for song can be lowered by listeners who are not susceptible to the effect of repetition. Low ratings imply that listeners did not experience the illusion, while high ratings provide a measure of its strength for those who did experience it. We therefore used the mean of the three highest ratings for each stimulus to filter out hard-to-classify sentences and then selected the stimuli receiving the top and bottom 45% of the ratings. All the sentences and their International Phonetic Alphabet (IPA) transcriptions are presented in Table S1 (Supplemental Material).
Data processing
Phoneme transcription
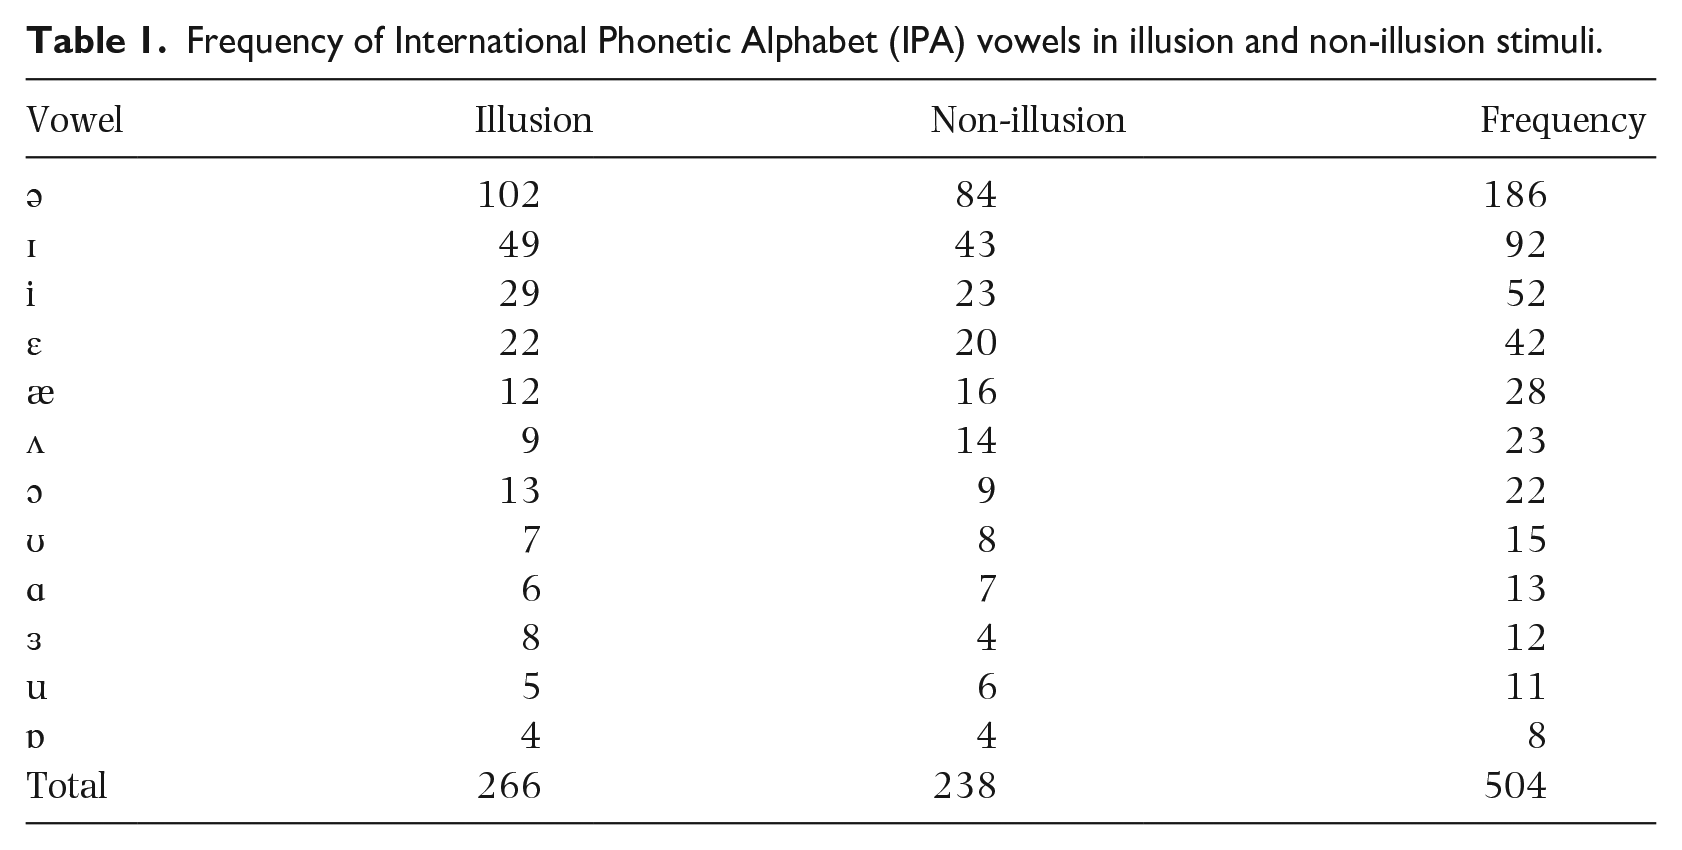
We used the IPA to create phonetic transcriptions of all the sentences. The IPA is a standardized system of notation, based on the Latin alphabet, enabling utterances in different languages and accents to be transcribed and compared, that allows for a standardized transcription of the sounds of languages. In the current study, vowels were of primary interest. Some occur more frequently in English than others. The most frequently occurring sound in English is the schwa (Weber, 2018), shown in Table 1—was most frequently represented in our corpus.
Frequency of International Phonetic Alphabet (IPA) vowels in illusion and non-illusion stimuli.
Segmentation
All the recordings were manually segmented using the Praat software (Boersma & Weenink, 2020). As shown in Figure 2, a Textgrid was created with separate tiers for words, phonemes, and vowels.
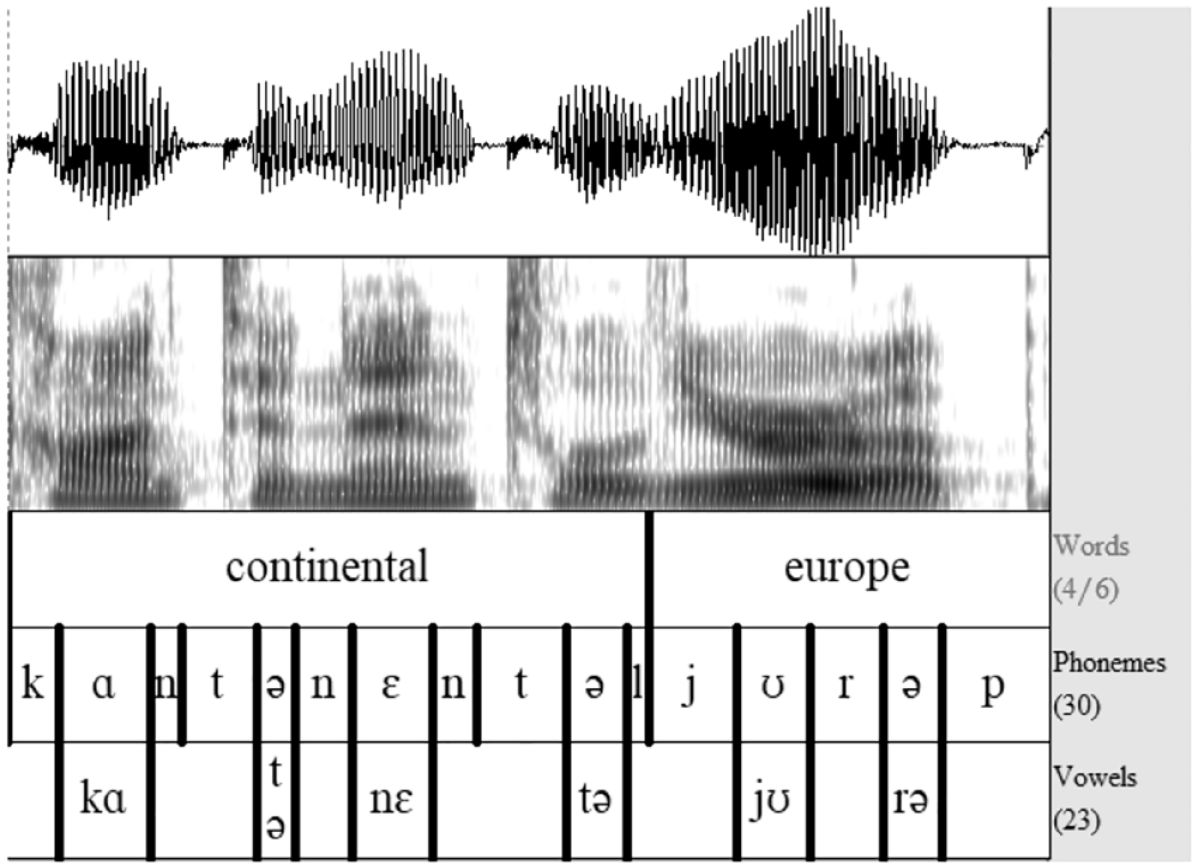
Waveform, spectrogram, and three layers of Textgrids for a sample sentence in Praat (Boersma & Weenink, 2020).
There is much debate about how to segment portions of speech, and particularly where to include transitions and aspirations (Hafer & Weiss, 1974; Pätzold & Simpson, 1997; Peterson & Lehiste, 1960). Ultimately, the choices made when determining phoneme boundaries depend on the purpose of the study. In the current study we aimed to obtain clear vowel formant values, although surrounding consonants are known to influence vowel frequencies (Strange et al., 2007). To reduce the impact of coarticulation, transitions from consonants were not included in the vowel segments, but vowel boundaries were aligned after or at the halfway point of consonant–vowel transitions. Aspirations without clear formants present in the spectrogram were also excluded from vowels. Silent intervals of more than 250 ms were considered as non-speech and left out of all segments. In general, the onset of a vowel was determined to be at the onset of voicing (i.e., vocal cord vibration), or—in the case of vowels following a voiced consonant—at a change in formant frequencies. Vowel offset was set at the offset of voicing, or at a sudden drop in intensity in the waveform and spectrogram. Three elements were thus used to determine vowel onset and offset: the visual shape of the waveform, the visual shape of the spectrogram, and the sound of the segment when played.
Diphthongs were excluded from this study. Diphthongs are characterized by a gliding formant transition between two different vowels. The dynamic quality of diphthong formants does not allow for direct comparison with pure vowel formants (Lee et al., 2013; Pätzold & Simpson, 1997). Furthermore, the formant values of the individual diphthong segments do not appear to be comparable to the formant values of matching monophthongs (Holbrook & Fairbanks, 1962).
Formant extraction
A Praat script was created to obtain duration and F1, F2, and F3 measurements for all vowels automatically using Burg’s algorithm for linear predictive coding (LPC) formant analysis. Because F1 and F2 are most relevant to vowel quality (Bradley, 2018; Lindblom & Sundberg, 2007), F3 values were not subjected to further analysis in this study. The maximum formant frequency was set to 5,000 Hz in Praat. Maximum frequencies depend on average lengths of the male and female vocal tracts, with formant frequency ceilings for female voices usually set to 5,500 Hz (Podesva & Sharma, 2013). The preceding consonant was also obtained for each segmented vowel. However, consonant influence could not be controlled for in this study, as consonants are especially difficult to control for in studies of natural speech (Pettinato et al., 2016).
Several methods of extracting formant frequency values are available, although the results of these methods are comparable (van Son & Pols, 1990). In the current study, four separate methods of formant analysis were compared to eliminate the possible influence of coarticulation of surrounding phonemes into formants in the areas bordering the vowels: (1) whole-vowel average, (2) vowel midpoint, (3) the average of 50% centered around the midpoint of the vowel, and (4) the average of a set interval of 40 ms around the midpoint of the vowel. Method (4) was found to be unsuitable for the present study, as the length of vowels varies greatly in natural speech. After comparing the results of the other methods, Method (3)—measuring the average formants of 50% around the midpoint—was chosen as it provided the most accurate and stable measurements for F1 and F2.
Removal of outliers
Before proceeding with the main analysis of data, we used Mahalanobis distance (MD) analysis in SPSS to identify multivariate outliers in all vowel groups. MD refers to the distance of a data point to the centroid, that is, the mean of all F1 and F2 combinations in a particular vowel category. The further away the data point is from the centroid, the larger the MD. All MD values with a probability of p < .001 were considered potential outliers. The formants of these six potential outliers were checked manually in Praat. In cases of formant tracking errors due to missing formants or misidentified formants (e.g., if F2 was read as F1), formants were recalculated using a slightly different area of the vowel. If these vowels remained outliers after this manual adjustment, they were removed from the sample. A total of two outliers were removed through this method, both from the “ə” vowel category.
Analysis
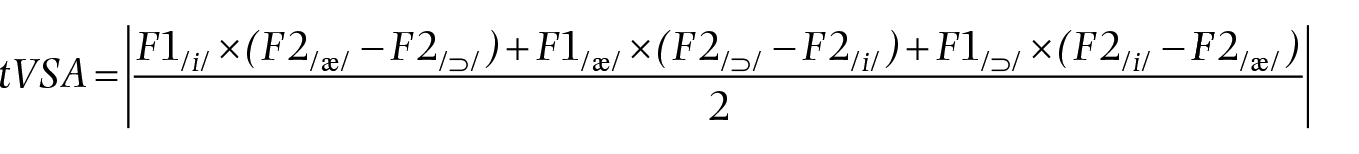
Triangular VSA
In the current study, we were interested in the differences between the vowel systems used in a group of sentences transforming to song and sentences remaining perceptually stable as speech. One way of characterizing a particular vowel system is to determine its acoustic size, that is, the area occupied between the vowels on the periphery of the F1–F2 range (Pätzold & Simpson, 1997). This vowel space area (VSA) can be calculated by drawing a polygon or a triangle between the formant means of three or four corner vowels and is thought to reflect the articulatory working space (Ferguson & Kewley-Port, 2007; Kuhl et al., 1997; Neel, 2008; Rvachew et al., 2008). We present the formant means (in Hz) of all vowels found in the corpus under investigation in this study, and their location in the articulatory-acoustic space in Figure 3. Please note that this is a visualization of a vowel space in which the data are not characterized statistically.
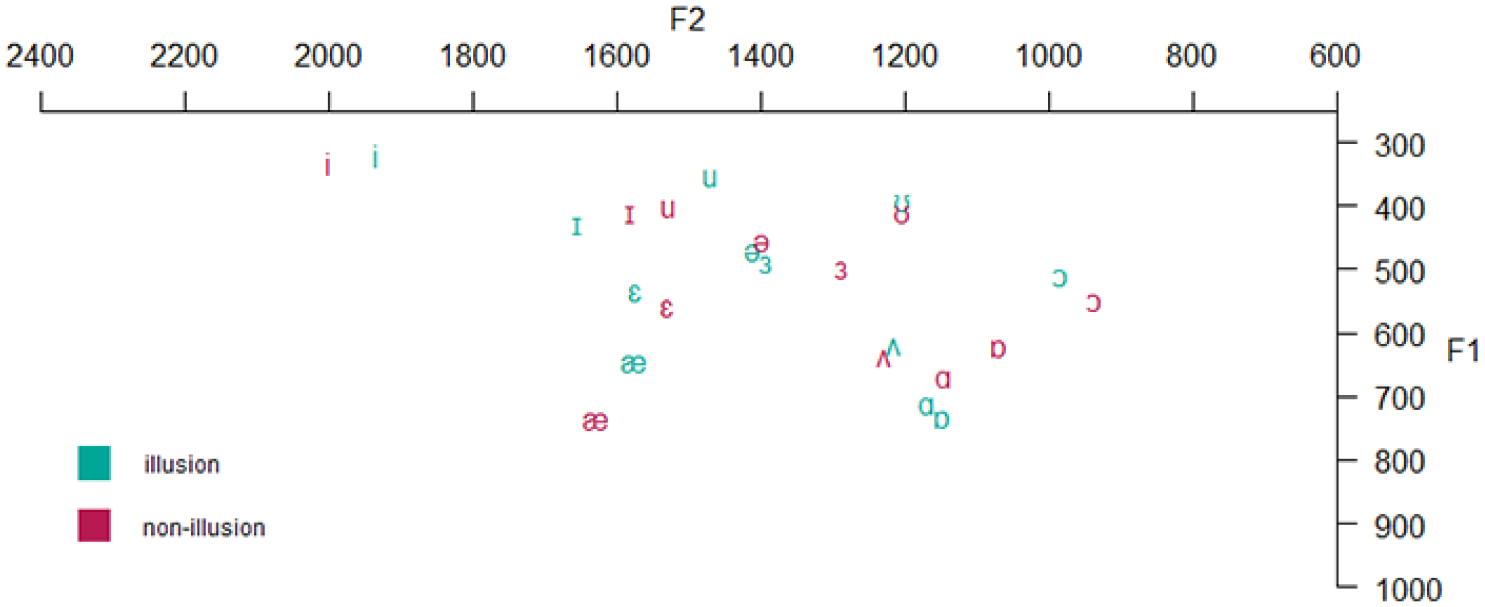
Formant means in F1–F2 space in Hz for all vowels per group (illusion or non-illusion).
Although /i/, /a/, and /u/ are commonly used as boundaries in triangular vowel-space area (tVSA) calculations (Kuhl et al., 1997; Ludlow et al., 2018), we used the vowels /i/, /æ/, and /ɔ/ as the corners of our tVSA, as shown in Figure 4. We chose these vowels over other corner vowels as they occurred more frequently in our dataset and because the resulting tVSA covers a large area of the vowel space. The frequencies of occurrence were /a/ (13), /u/ (11) and /æ/ (28), and /ɔ/ (22), respectively (see Table S2 and Table S3 in the Supplemental Material for further details). These vowels have also been used in previous research analyzing vowel formants in natural speech as opposed to isolated words or phonemes (Pettinato et al., 2016). Due to the limited size of our corpus of STS stimuli, the tVSA can be understood as the mean tVSA over all productions by all speakers, rather than a mean of all speaker-dependent vowel space areas.
Vowel diagram with vowel locations in acoustic space and vowel triangle among /i/, /æ/, and /ɔ/.
To compare the size of the tVSA in the song and speech groups, we first calculated the vowel formant means across all tokens of each of the three vowels in both groups. These averages were then used to calculate the area occupied in the F1–F2 space. The following formula may be used to calculate this area (Sapir et al., 2010; Skodda et al., 2012)
These calculations were performed through R software, using the vowelMeansPolygonArea function available in the phonR package (McCloy, 2016; R Development Core Team, 2017). Vowel triangles were plotted using the plotVowels function in phonR to provide a graphic representation of the area.
Mean vowel formants for the illusion and non-illusion groups
We also calculated the average F1 and F2 values and standard deviations in the illusion and non-illusion groups. These mean values, obtained by finding the mean of the three vowel means, can also be understood as the coordinates of the centroid of illusion and the centroid of non-illusion vowels. We expected to find a pattern in these centroids and standard deviations similar to that found in Bradley’s (2018) comparison of formants during speaking and singing. We therefore expected the centroid of the illusion stimuli to have lower F1 and F2 values than the non-illusion stimuli, and the standard deviation to be lower in the illusion than in the non-illusion stimuli.
Euclidean distances in the illusion and non-illusion groups
To quantify whether the tVSA in the illusion group is significantly different from that in the non-illusion group, we calculated Euclidean distances of tokens in the illusion and non-illusion groups to a reference point in the distribution. Two different reference points were used to compare the groups of stimuli: the centroid and the circumcenter of the combined stimuli.
Distance to centroid
To determine whether there are significant differences in distribution between the illusion and non-illusion stimuli, we calculated how far removed each of our tokens was from the mean of our set of vowels. We first calculated the means of /i/, /æ/, and /ɔ/. As shown in Figure 5, we used these means to find the centroid of the combined illusion and non-illusion stimuli (Figure 5).
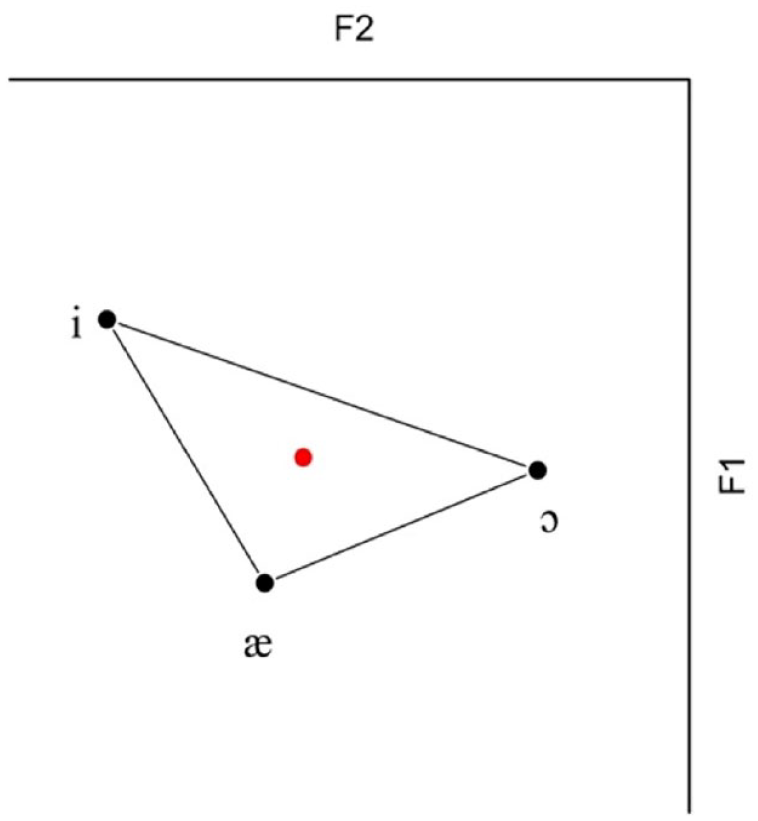
Schematic representation of overall vowel triangle with combined vowel means and overall centroid. The red dot represents centroid of combined vowel categories.
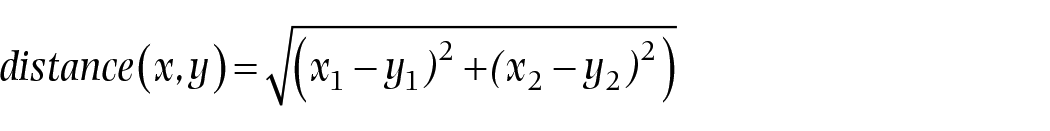
We used the vowel-category means to calculate the centroid, rather than the mean of all tokens, because—as our corpus consisted of natural speech—the three categories did not contain the same number of tokens. Our method ensured that the vowel categories were weighted evenly; if we had used a different method, the uneven distribution of vowel tokens over the vowel space would have caused the mean of the vowel space to shift toward a category with a higher number of tokens. We then measured the Euclidean distance in Hz from each data point to the centroid, using the following formula in which
Welch’s t-test was performed to test whether distances in the illusion and non-illusion stimuli were significantly different. Welch’s test was chosen over the Student’s t-test because of the unequal variance between the groups. All calculations, statistical tests, and plotting were performed in Excel, R, and JASP (JASP Team, 2020).
Distance to circumcenter
The disadvantage of the method described above for measuring the distance to the centroid is that the means of the vowel groups are not equally close to the centroid, due to the unequal sides of the triangle (Figure 5). This makes it difficult to compare the effect of stimuli types between vowel categories. For example, the Euclidean distance between the mean of /æ/ and the centroid is smaller than the distance between the mean of /i/ and the centroid. In the current study, we focused on the overall difference between the illusion and non-illusion stimuli, aiming to eliminate the influence of this difference between vowel categories. Using an alternative method, it is possible to calculate the Euclidean distance to the circumcenter, that is, the center of the circumcircle passing through all vertices of the triangle (Figure 6).
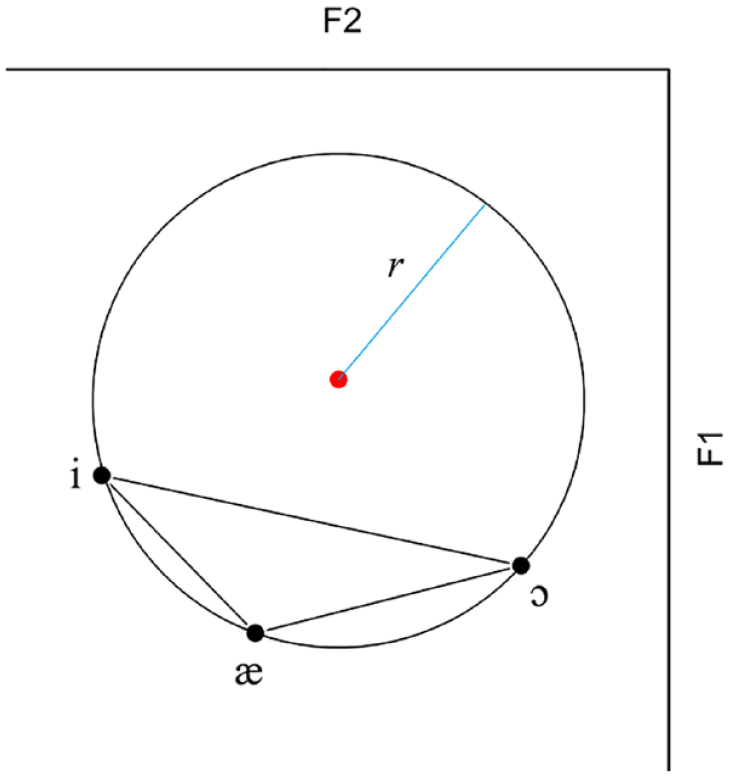
Schematic representation of the circumcircle of the overall vowel triangle area. The red dot represents the circumcenter and the blue radius indicates that all vowel group means are an equal distance r away from the center.
The following equation represents the circumcircle, where F1c and F2c are the coordinates of the center of the circle with radius r for vowel v = {/i/, /æ/, /ɔ/}
This method guarantees that the means of all vowel groups are the same distance r from the center. We compared the results of this method using the circumcenter with the previous method using distances to the centroid. We used the same procedure in which we measured the Euclidean distance in Hz from each token to the circumcenter and performed Welch’s t-test to test for significance.
Results
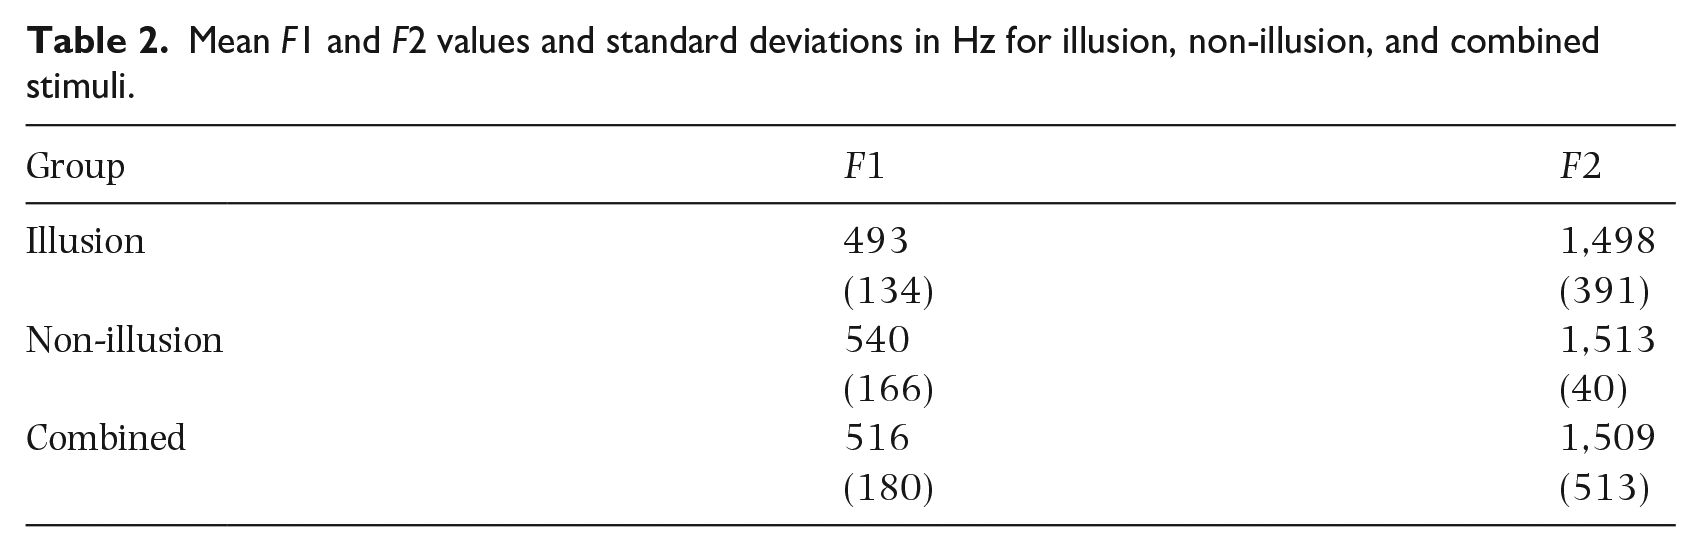
To determine whether the distribution of vowels differed between the illusion and the non-illusion stimuli, we plotted both VSAs using the means of the corner vowels /i/, /æ/, and /ɔ/. As shown in Figure 7, the tVSA—the area occupied by the vowel space triangle—is larger in non-illusion than in illusion stimuli. The tVSA has a size of 120,734 Hz2 in illusion and 175,649 Hz2 in non-illusion stimuli. Table 2 shows the mean F1 and F2 values for illusion and non-illusion stimuli, which are equal to the centroids of the vowel triangles in Figure 7. The overall F1 and F2 values are higher in non-illusion than illusion stimuli, and the standard deviation is also increased. It can similarly be observed in Figure 7 that, in addition to being expanded, the non-illusion tVSA is shifted up in Hz in both the F1 and F2 plane compared with the illusion tVSA.
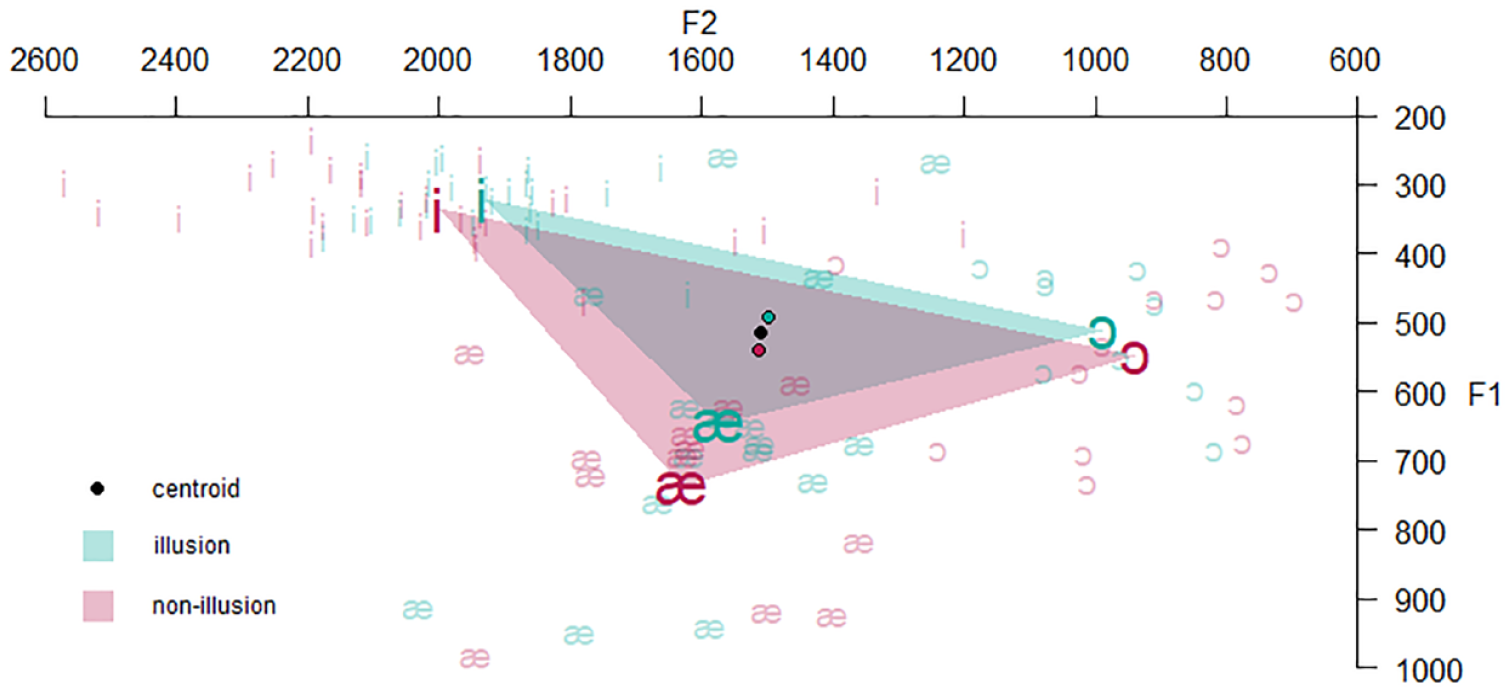
Triangular vowel space area in Hz for the transforming (illusion) and non-transforming (non-illusion) stimuli. Bold vowel symbols indicate vowel means in different categories. Lightly colored vowels represent all tokens in both groups. Colored dots indicate centroids of illusion and non-illusion stimuli, and the black dot represents the mean of the combined illusion and non-illusion stimuli. The open dot indicates the circumcenter of the circumcircle of the combined illusion and non-illusion stimuli.
Mean F1 and F2 values and standard deviations in Hz for illusion, non-illusion, and combined stimuli.
The mean Euclidean distance between the individual tokens in the three vowel categories and the overall centroid [F1 = 516, F2 = 1,509] was found to be larger in non-illusion than in illusion stimuli, and the standard deviation was also greater (Table 3).
Mean Euclidean distances to the centroid in Hz.
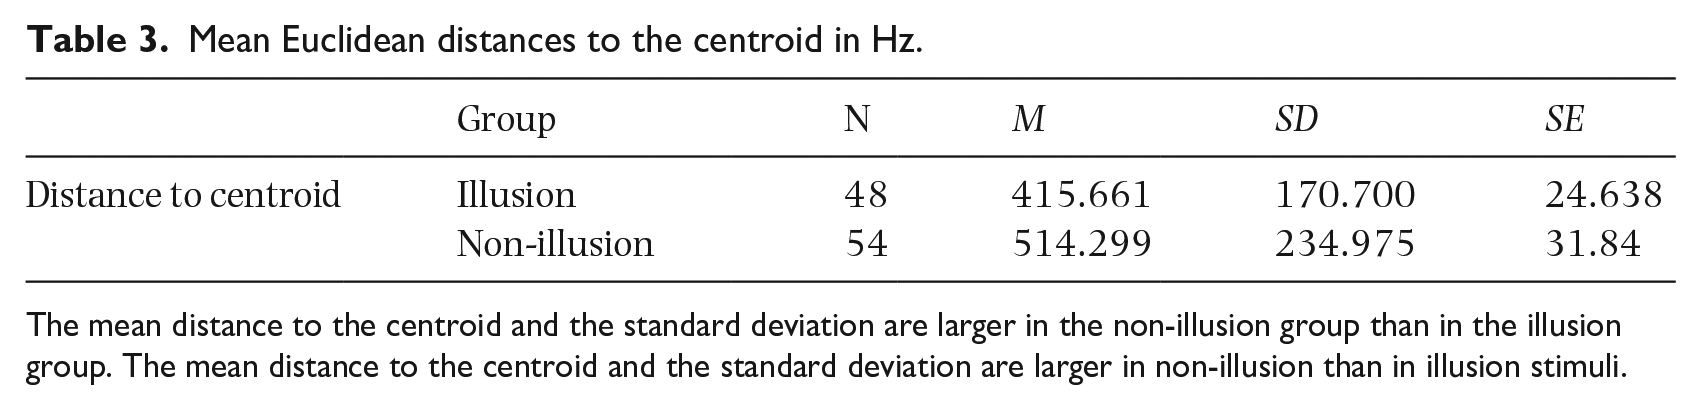
The mean distance to the centroid and the standard deviation are larger in the non-illusion group than in the illusion group. The mean distance to the centroid and the standard deviation are larger in non-illusion than in illusion stimuli.
To test whether these differences were significant, we performed Welch’s test for unequal variances with the Euclidean distance to the centroid as the dependent variable and category (illusion and non-illusion) as the independent variable. Euclidean distances differed significantly between the two groups, according to Welch’s t-test, t(96.47) = −2.450, p = .016.
We also measured the Euclidean distance to a second reference point, the overall circumcenter. Figure 7 also shows the location of the circumcenter of the circle encompassing all vertices of the vowel triangle of the combined illusion and non-illusion stimuli.
The mean Euclidean distances between individual tokens and the overall circumcenter [F1 = 108, F2 = 1,398] were also found to be larger in non-illusion than in illusion, and the standard deviation was also greater (Table 4).
Mean Euclidean distances to the circumcenter in Hz.
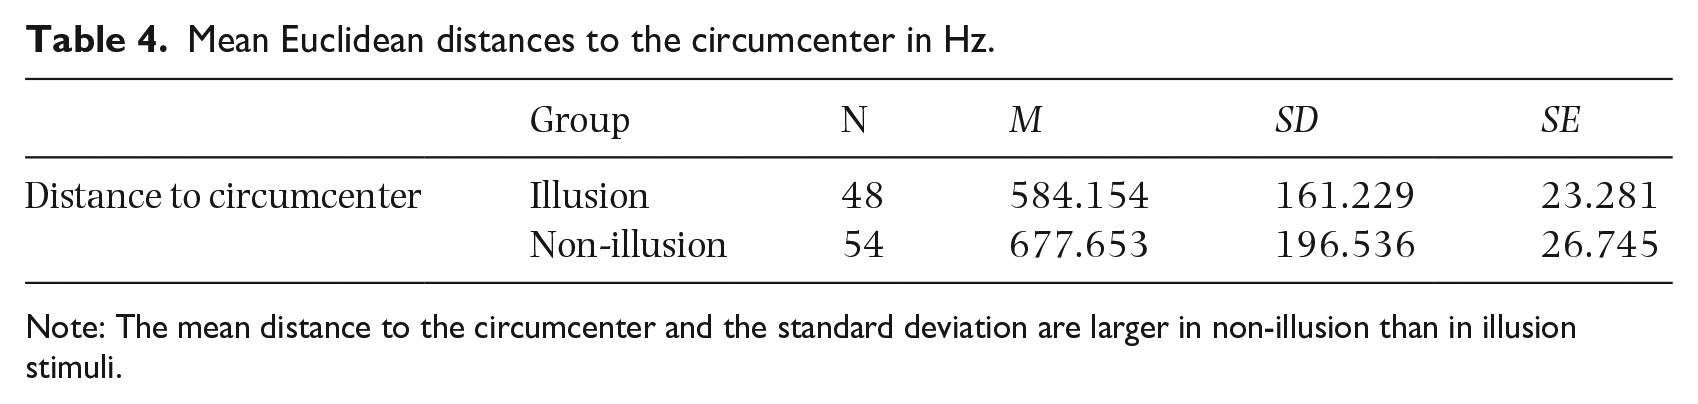
Note: The mean distance to the circumcenter and the standard deviation are larger in non-illusion than in illusion stimuli.
Welch’s test for unequal variances with the Euclidean distance to the circumcenter as the dependent variable and category (illusion and non-illusion) as the independent variable showed that the difference between the two groups was significant, t(99.396) = −2.637, p = .01.
Discussion
In the current study, we investigated differences between the distribution of vowels in a group of spoken sentences that sounded like song following multiple repetitions in the STS illusion and those that continued to be perceived as speech. We predicted that vowels in the non-transforming (non-illusion) category would have more extreme formant values than those in the transforming (illusion) category; in other words, that vowels in song would be more centralized than those in speech. An initial visual inspection of the mean triangular vowel space area (tVSA) in illusion and non-illusion stimuli confirmed that the tVSA in speech is expanded compared with song, in accordance with Bradley (2018), who found a similar shift of the vowel space in sung vowels compared with spoken vowels. We also found that the VSA in illusion stimuli shifted, in both the F1 and F2 dimensions. This is the result of lower mean frequencies in F1 and F2 in illusion compared with non-illusion stimuli, in line with previous research by White (1999) comparing sung and spoken vowels. The quantitative analyses confirmed that the mean distance of non-illusion tokens to the centroid is significantly larger than that of illusion tokens. We obtained the same results having controlled for the distances of the vowel-group means to the centroid by using the circumcenter as reference point. The variance was also higher in non-illusion than in illusion, which corresponds to the reduced variance found in sung compared with spoken vowels (Bradley, 2018). Our findings suggest similar, if less pronounced, formant patterns for illusion and non-illusion vowels in the STS illusion and in spoken and sung vowels (Bradley, 2018), albeit less pronounced. It is not surprising that the distinction between illusion and non-illusion vowels in the present study was weaker than the distinction between vowels that were actually spoken or sung, given that all the stimuli in the STS illusion are initially spoken.
It is important to consider the role of repetition in accessing the learned associations for sung vowel spaces. While the exact function of repetition in auditory perception is still debated (Castro et al., 2018; Deutsch et al., 2011; Margulis et al., 2015; Vitevitch et al., 2021), we propose that repetition allows our internal expectation model to accumulate evidence for making decisions between song-like and speech-like. As the listener encounters multiple repetitions of the stimuli, they begin to emphasize and categorize specific characteristics, such as vowel distributions, pitch stability, and rhythmic regularity. In this way, repetition may serve as a mechanism that brings the learned associations of sung vowel spaces to the forefront, allowing the listener to perceive speech or song.
It has been shown in previous research that the centralization of vowels in song may interfere with word recognition (Collister & Huron, 2008; Hollien et al., 2000), while expansion of the vowel space area in speech is associated with clear speech and intelligibility (Ferguson & Kewley-Port, 2007; Lam et al., 2012), and the production of best examples of vowels (Kuhl, 1991). In studies comparing speech and song, these vowel space modifications are often thought to be a side effect of other, co-occurring articulatory differences, such as singer’s increased projection and resonance in song over speech (Bradley, 2018; Merrill & Larrouy-Maestri, 2017). In other words, singers probably compress vowel spaces when singing for esthetic reasons, rather than deliberately modifying them. This raises the question of whether F1 and F2 differences, separated from other speech and song properties, influence the perception of speech and song. The difficulty is that vowel space modifications always occur in tandem with other acoustic changes in studies comparing spoken and sung stimuli. Additionally, the above-mentioned top–down processing plays a role in the perception of speech and song. This means that pre-existing categories of speech and song shape listeners’ expectations, further complicating the search for context-independent acoustic cues influencing perception of the two modes (Falk et al., 2014; Merrill & Larrouy-Maestri, 2017).
Using experimental stimuli at the boundary of speech and song may limit the influence of top–down processing and allow for the investigation of acoustic features underlying the two modes. For example, Merrill and Larrouy-Maestri (2017) used the vocal technique known as sprechgesang (speech-song), neither wholly speech nor song, to test listeners’ perception. In the current study, we used the perceptual ambiguity in the STS illusion to investigate whether compressed vowel spaces are related to how spoken stimulus would sound more song-like the relationship between compressed vowel spaces and the perception of a spoken stimulus as song. In our corpus of stimuli, we found that the vowels in transforming sentences have, on average, lower and more compressed formant values.
This suggests that sentences including vowels with higher and more extreme formant values are less likely to transform to song than those including centralized vowels. We believe that the learned association between the size of VSA and mode (speaking or singing), may contribute to the perceptual classification of an acoustic signal as belonging to the categories of speech or song. Although differences between the formant frequency values of spoken and sung vowels may result from other articulatory processes specific to speech or song, listeners may nevertheless learn, through repeated exposure, to associate more compressed vowel spaces with speech and expanded vowel spaces with song. Developed expectations about formants may thus contribute to listeners’ recognition of speech and song. In future, researchers should ask if vowel-space differences in transforming and non-transforming sentences co-occur with other acoustic differences identified previously, such as more stable pitch contours in song-like sentences (Tierney et al., 2018a).
As noted in Figure 3, not all vowels adhere strictly to the patterns observed for the corner vowels. This variability could be attributed to a range of factors. It would be worth making use of voice-processing techniques to testing the issue further; these technologies enable the modification or synthesis of speech, providing researchers with opportunities for systematically manipulating specific vocal features and investigating their impact on the perception of speech and song.
In the STS illusion, the repetition of certain sentences is thought to provoke the switch from a linguistic to a musical listening mode (Graber et al., 2017; Tierney et al., 2013). The acoustic differences between such sentences and those that do not provoke this switch are of interest in this study; characteristics of a sentence described as song-like have been shown to predict the listener’s perception of its transformation from speech to song (Falk et al., 2014; Merrill & Larrouy-Maestri, 2017; Tierney et al., 2018a; Vanden Bosch der Nederlanden et al., 2015b). In fact, it has been argued that these song-like characteristics are brought to the fore by the repetition in the STS illusion, switching the listener’s perception from the linguistic to the musical domain (Falk et al., 2014). There is also evidence that the listener’s linguistic analysis of the sentence plays a role in the STS illusion (Jaisin et al., 2016; Margulis et al., 2015). Specifically, when the listener encodes the properties of a stimulus in the form of linguistic information, they may be less likely to perceive it as transforming into song. For example, speakers of tonal languages may be predisposed to perceive pitch patterns as belonging to language and therefore less likely to experience the perceptual shift from speech to song than speakers of non-tonal languages (Jaisin et al., 2016). Similarly, stimuli in languages that the listener cannot understand or finds difficult to pronounce seem to be perceived as music more readily than sentences in the listener’s native language (Jaisin et al., 2016; Margulis et al., 2015). Semantic associations may play a role here: the listener’s speech processing circuitry may be captured by their understanding of the clear semantic meaning of a stimulus, but this will not occur if the listener does not understand the language (Margulis et al., 2015).
Similarly, speech circuitry is unlikely to be captured by environmental sounds, which are more likely to be processed as music following repetition (Simchy-Gross & Margulis, 2018). In sum, while stimuli with musical properties may be susceptible to transformation in the STS illusion (Tierney et al., 2018a; Vanden Bosch der Nederlanden et al., 2015b), stimuli with more linguistic properties are less likely to be susceptible (Graber et al., 2017; Margulis et al., 2015; Simchy-Gross & Margulis, 2018). We interpret our data as showing that sentences exhibiting expanded vowel spaces and extreme formant values may be perceived as belonging to speech, and consequently activate speech circuitry; this is why they are not perceived as transforming into song. Listeners clearly rely on cues such as semantic meaning, pitch, and rhythm when encoding music and speech, but our study suggests that such subtle differences between vowel formant frequencies may also play a role in this process.
On a separate but related note, IDS and sentences transforming to song upon repetition do share certain qualities, such as regularity and stability in pitch and rhythm, which contribute to their musicality. However, when it comes to vowel space, they demonstrate opposite tendencies. While IDS utilizes an exaggerated vowel space, which is thought to support language acquisition in infants (Kuhl et al., 1997), our study has shown that transforming sentences have a more compressed vowel space. Such difference may be attributed to their primary functions. IDS is a production of caregivers aiming to foster language learning in children by exaggerating features that infants prefer to listen to (Fernald et al., 1989). In contrast, the STS illusion may represent a semi-automatic perceptual shift that operates on our existing knowledge of speech and song. Therefore, the different tendencies in vowel space size between IDS and STS may be consistent with the different purposes they serve.
The dataset of segmented STS stimuli we created for this study may be used in the future to investigate vowel spaces within isolated stimuli or within stimuli by the same speaker. Assessing the transformation of a stimulus from speech to song presents challenges, as it is not straightforward to determine when such a change occurs. Although an increase in song-like ratings between the first and tenth repetitions may be considered indicative of this transformation, the extent to which these ratings should change remains unclear. In our study, we adopted an absolute-value approach, concentrating on stimuli that received the highest song-like ratings from the top three raters. Future research could explore the efficacy of using a difference score in comparison with such thresholds for a better understanding of the transformation process.
Eliminating possible intra-speaker formant variability is another important issue for future research. Another direction for future studies could involve focusing on particular vowels in illusion and non-illusion sentences, as previous research on spoken and sung vowels has shown different degrees of shifts and expansion for front and back vowels (Bradley, 2018). Similarly, other point vowels such as /i/, /a/, and /u/ may be used as vertices in vowel triangles to see if distribution differences persist throughout the vowel space. Finally, the database of segmented STS stimuli should be expanded in future research, so that within-vowel F1 and F2 differences and the influence of preceding consonants on vowel formants can be investigated.
Supplemental Material
sj-docx-1-msx-10.1177_10298649231224786 – Supplemental material for Sentences used in the speech-to-song illusion: Comparisons of acoustic vowel space
Supplemental material, sj-docx-1-msx-10.1177_10298649231224786 for Sentences used in the speech-to-song illusion: Comparisons of acoustic vowel space by Anna Hiemstra and Makiko Sadakata in Musicae Scientiae
Supplemental Material
sj-docx-2-msx-10.1177_10298649231224786 – Supplemental material for Sentences used in the speech-to-song illusion: Comparisons of acoustic vowel space
Supplemental material, sj-docx-2-msx-10.1177_10298649231224786 for Sentences used in the speech-to-song illusion: Comparisons of acoustic vowel space by Anna Hiemstra and Makiko Sadakata in Musicae Scientiae
Supplemental Material
sj-docx-3-msx-10.1177_10298649231224786 – Supplemental material for Sentences used in the speech-to-song illusion: Comparisons of acoustic vowel space
Supplemental material, sj-docx-3-msx-10.1177_10298649231224786 for Sentences used in the speech-to-song illusion: Comparisons of acoustic vowel space by Anna Hiemstra and Makiko Sadakata in Musicae Scientiae
Footnotes
References
Supplementary Material
Please find the following supplemental material available below.
For Open Access articles published under a Creative Commons License, all supplemental material carries the same license as the article it is associated with.
For non-Open Access articles published, all supplemental material carries a non-exclusive license, and permission requests for re-use of supplemental material or any part of supplemental material shall be sent directly to the copyright owner as specified in the copyright notice associated with the article.