
Abstract
Background:
Acute gastroenteritis is a clinical syndrome that may cause severe dehydration in affected individuals and a reason of mortality and morbidity in all age groups. Measurement of perfusion index and plethysmography variability index may provide emergency physicians valuable information about hemodynamics of the patient.
Objectives:
Our study aimed to investigate the role of perfusion index and plethysmography variability index measurement at admission for estimating dehydration severity and determiningthe possible change in those parameters after fluid replacement among patients presenting to emergency department with acute gastroenteritis.
Methods:
This was a prospective cross-sectional study. Patients diagnosed with acute gastroenteritis at the emergency department were consecutively enrolled. The two groups were defined according to the severity of dehydration: mild and moderate/severe dehydration groups. The values of perfusion index and plethysmography variability index of all patients were measured.
Results:
A total of 180 patients were included in the study. As compared with the mild dehydration group, moderate/severe dehydration group had a significantly lower perfusion index value and significantly higher plethysmography variability index value on admission (p < 0.001 for both comparisons). Among moderate/severe dehydration patients, perfusion index value significantly increased and plethysmography variability index significantly decreased after treatment (p < 0.001). There was a significant positive correlation between osmolarity and plethysmography variability index (r = 0.298; p = 0.007) and a significant negative correlation between osmolality and perfusion index (r = −0.259; p = 0.019) in the patients with moderate/severe dehydration.
Conclusion:
The study show that perfusion index and plethysmography variability index may be useful for determining the severity of dehydration in acute gastroenteritis and may be use for assessing the response to fluid replacement especially in patients with severe dehydration at emergency department.
Introduction
Acute gastroenteritis (AGE) is one of the most important causes of mortality and morbidity in all age groups. Irrespective of etiology and mechanism of AGE, dehydration occurs due to fluid losses. Depending on the severity of dehydration, patients may have variable clinical presentations ranging from mild symptoms like fever, vomiting, abdominal pain to syncope, and even death. 1 , 2 The first step of dehydration management is to determine the amount of fluid loss. Mild dehydration presented with dry mouth, fatigue, headache, and concentrated urine whereas severe dehydration may manifest with dry mucosa, poor cognitive function, blurred/loss of consciousness, delirium, oliguria, orthostatic hypotension, tachycardia, weak pulse, and prolonged capillary refill time.1–3
In the emergency department, inability to accurately estimate the volume status of patients cause some problems, thus; overestimation of dehydration may lead to unnecessary intravenous fluid administration and hospitalization whereas its underestimation may lead to delays in patient management and worsening of symptoms. Therefore, having timely and accurate information about the clinical course of AGE may both aid to triage of such patients and avoid complications of overhydration.
Perfusion index (PI) is an indirect, non-invasive, numerical, dynamic, and continuous measure of peripheral perfusion obtained from pulse oximeter that provides useful information to the physician in several clinical settings. 4 Plethysmography variability index (PVI) is a measure of the dynamic changes in the PI that occur during one or more complete respiratory cycles. PVI is an algorithm that can estimate the amplitude of respiratory variations of the pulse oximeter waveform, which is strongly correlated to the arterial pulse pressure variation. 5 Previous studies have suggested that variability of perfusion parameters is a noninvasive and easy-to-perform method for determining disease severity.6–8 In clinical settings such as emergency department where clinical decision time is limited PI and PVI measurement may provide clinicians with an overall idea about patient hemodynamics.
A review of the literature indicates that perfusion indexes have been used to assess volume status and fluid responsiveness among mechanically ventilated patients. 6 , 7 It has been shown that at intensive care units lower PI and higher PVI values are associated with disease severity and mortality.6–9 However, at limited number of studies related to PVI and PI measurement on spontaneously breathing patients have provided inconsistent data.10–14 The aim of our study was to investigate the role of admission PI and PVI values in determining severity of dehydration and whether any change in these parameters would occur after fluid replacement among patients presenting to emergency department with AGE.
Materials and method
This study was a prospective, cross-sectional study. It was approved by local ethics committee. Written informed consent was obtained from patients or relatives.
Study population
Our study consecutively included patients aged 18 years or older who presented to the emergency department of a tertiary training and research hospital and were diagnosed with AGE between 31 April 2019 and 31 June 2019. AGE was defined as passing watery feces at least three times within 24 h and/or more than 200 g for a period shorter than 2 weeks. Patients who were pregnant; who had cardiac arrhythmias; patients in whom PI and PVI could not be measured for any reason; and patients who had henna or nail polish on their fingernails were excluded. The patients were categorized into two groups as mild dehydration and moderate/severe dehydration according to The National Early Warning Score (NEWS) and POAC (primary option for acute care) “Clinical Guideline-Acute Adult Dehydration” guidelines. 15 Patients with a systolic blood pressure >90 mm/Hg, mild thirst, and concentrated urine were considered to have mild dehydration; patients with oliguria, postural hypotension (>20 mm Hg), tachycardia >100/min, systolic blood pressure <90 mm Hg, NEWS ⩾4, and confusion were considered to have moderate/severe dehydration. Patients with moderate/severe dehydration were administered intravenous fluid replacement in accordance with National Institute for Clinical Excellence (NICE) 2013 “Intravenous fluid therapy in adults in hospital—clinical guideline” recommendations and by guidance of their clinical conditions, vital signs, urine output, and laboratory results. 16
In addition to the patients’ demographic information, their vital signs, physical examination findings, full blood count, and biochemical tests were recorded. Plasma osmolarity was calculated with the formula: Posm = 2 × sodium + (glucose/18) + (blood urea nitrogen/2.8).
Measurement of PI and PVI
PI and PVI were measured with a pulse oximeter sensor of Masimo Radical 7 Monitor (Masimo Corporation, Irvine, CA, USA) at the same time of examining patients’ vital signs. The first measurements were taken from the 2 to 3 fingers of the dominant hand with the patients being in supine position on a stretcher simultaneously with the triage at emergency department admission. Second measurements of the patients with moderate/severe dehydration were taken at the same position after fluid replacement was done according to NICE 2013 guideline. All measurements were recorded after waiting for at least 5 min after the value on the device was stabilized.
Sample size
The sample size was estimated with G*Power for Mac OS X (version 3.1.9.2; Universität Dusseldorf, Germany). During our study a 2% change in PI between measurements was considered clinically significant. Accordingly, with a type-1 error of 5%, a type-2 error of 5% (power 95%) and a two-sided analysis, the sample size was determined as 146 patients. The standard deviation of PI values was retrieved from previous study groups and considered 2.9% and 4.1%. 10 Considering a possible protocol bias, adding 10% patients to each arm was planned; hence, 160 were determined as the minimum number of volunteers to be included.
Statistical analysis
Study data obtained and recorded on study form during the study period were analyzed using IBM SPSS 20.0 (Chicago, IL, USA) statistical software. Normality of the discrete and continuous variables’ distribution was checked with Kolmogorov Smirnov test. Continuous numeric variables were expressed as median (interquartile range 25–75), categorical variables as number (%). Categorical variables were compared with Chi-square test, continuous variables with Mann Whitney-U test, and pre- and post-treatment measurement variables with Wilcoxon test. The correlation between osmolarity and PI and PVI was tested with Spearman’s correlation test.
p < 0.05 was considered statistically significant.
Results
A total of 212 patients who were eligible for inclusion in the study were admitted to the emergency department during the study period. Four patients were excluded because of pregnancy, three patients had henna on their fingernails, nine patients had rhythm disturbance, six patients had no measurements and 10 patients did not give consent to participate in the study. A total of 180 patients were included in the final statistically analyses. Half of the participants (n = 90) were female. The median ages of patients were 55 (IQR: 25–75, 39–70) years. Demographics and some laboratory results of all patients were shown in Table 1. Blood pressure of patients with moderate/severe dehydration was significantly lower than those with mild dehydration but white blood cell (WBC), urea, creatinine, blood glucose, sodium and osmolarity were significantly higher (p < 0.05 for all values). Compared to the mild dehydration group, the moderate/severe dehydration group had a significantly lower PI and a significantly higher PVI on admission (p < 0.001 for both) (Table 2).
Demographic data of all patients.
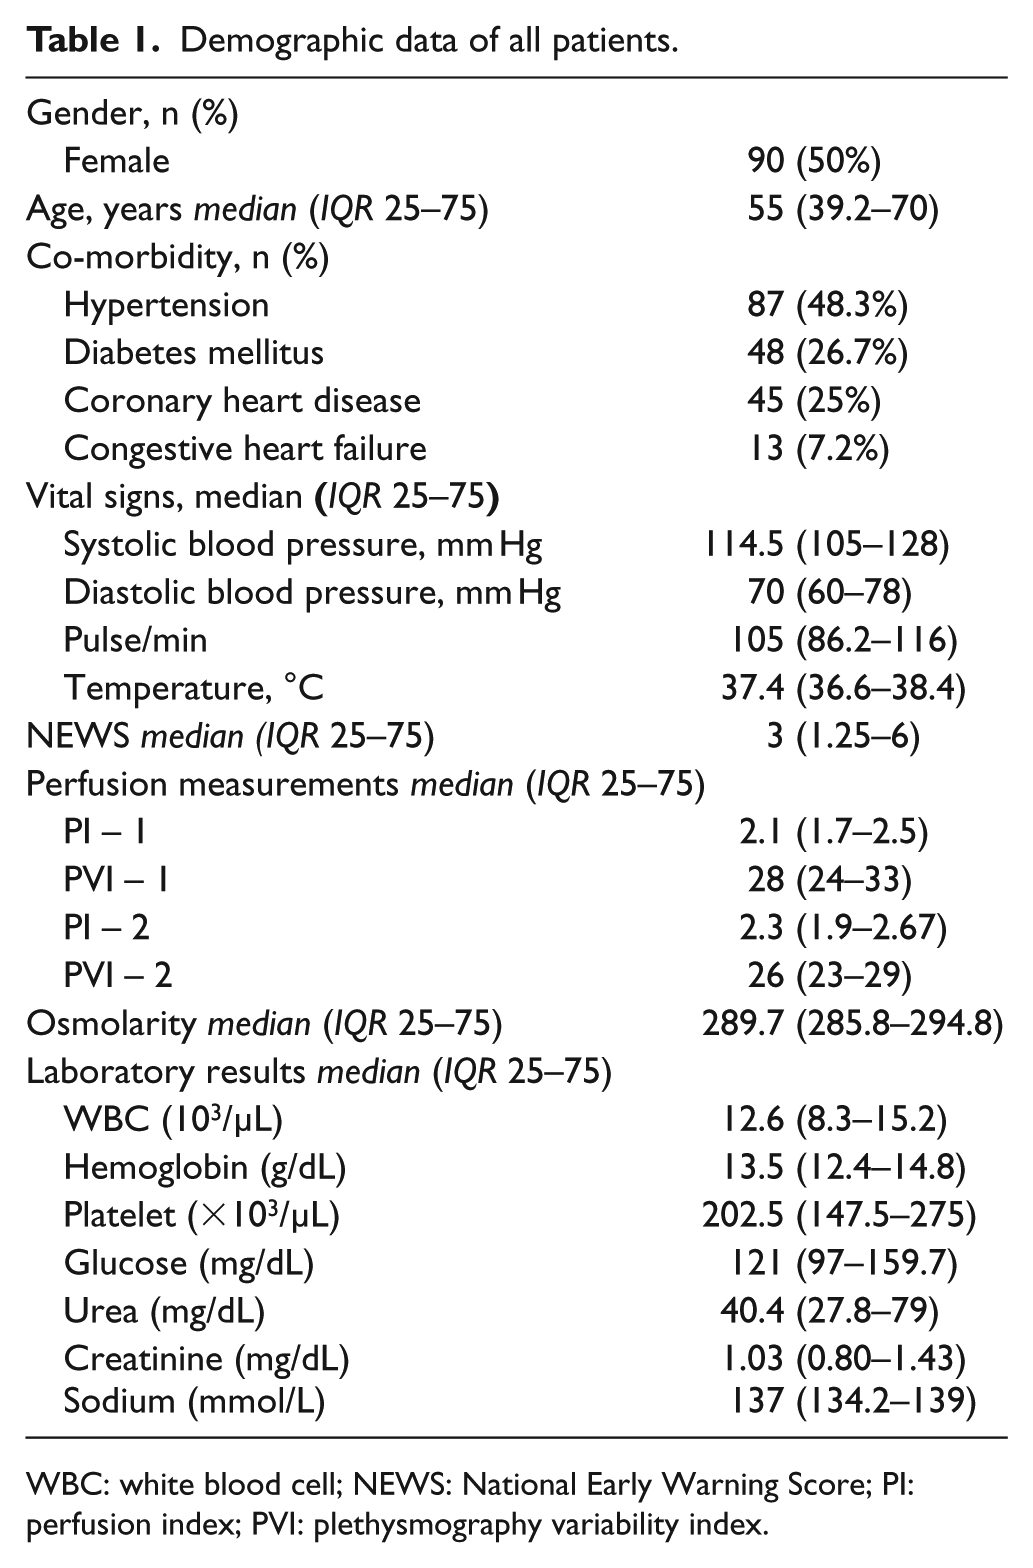
WBC: white blood cell; NEWS: National Early Warning Score; PI: perfusion index; PVI: plethysmography variability index.
Patients characteristics and laboratory findings according to severity of disease.
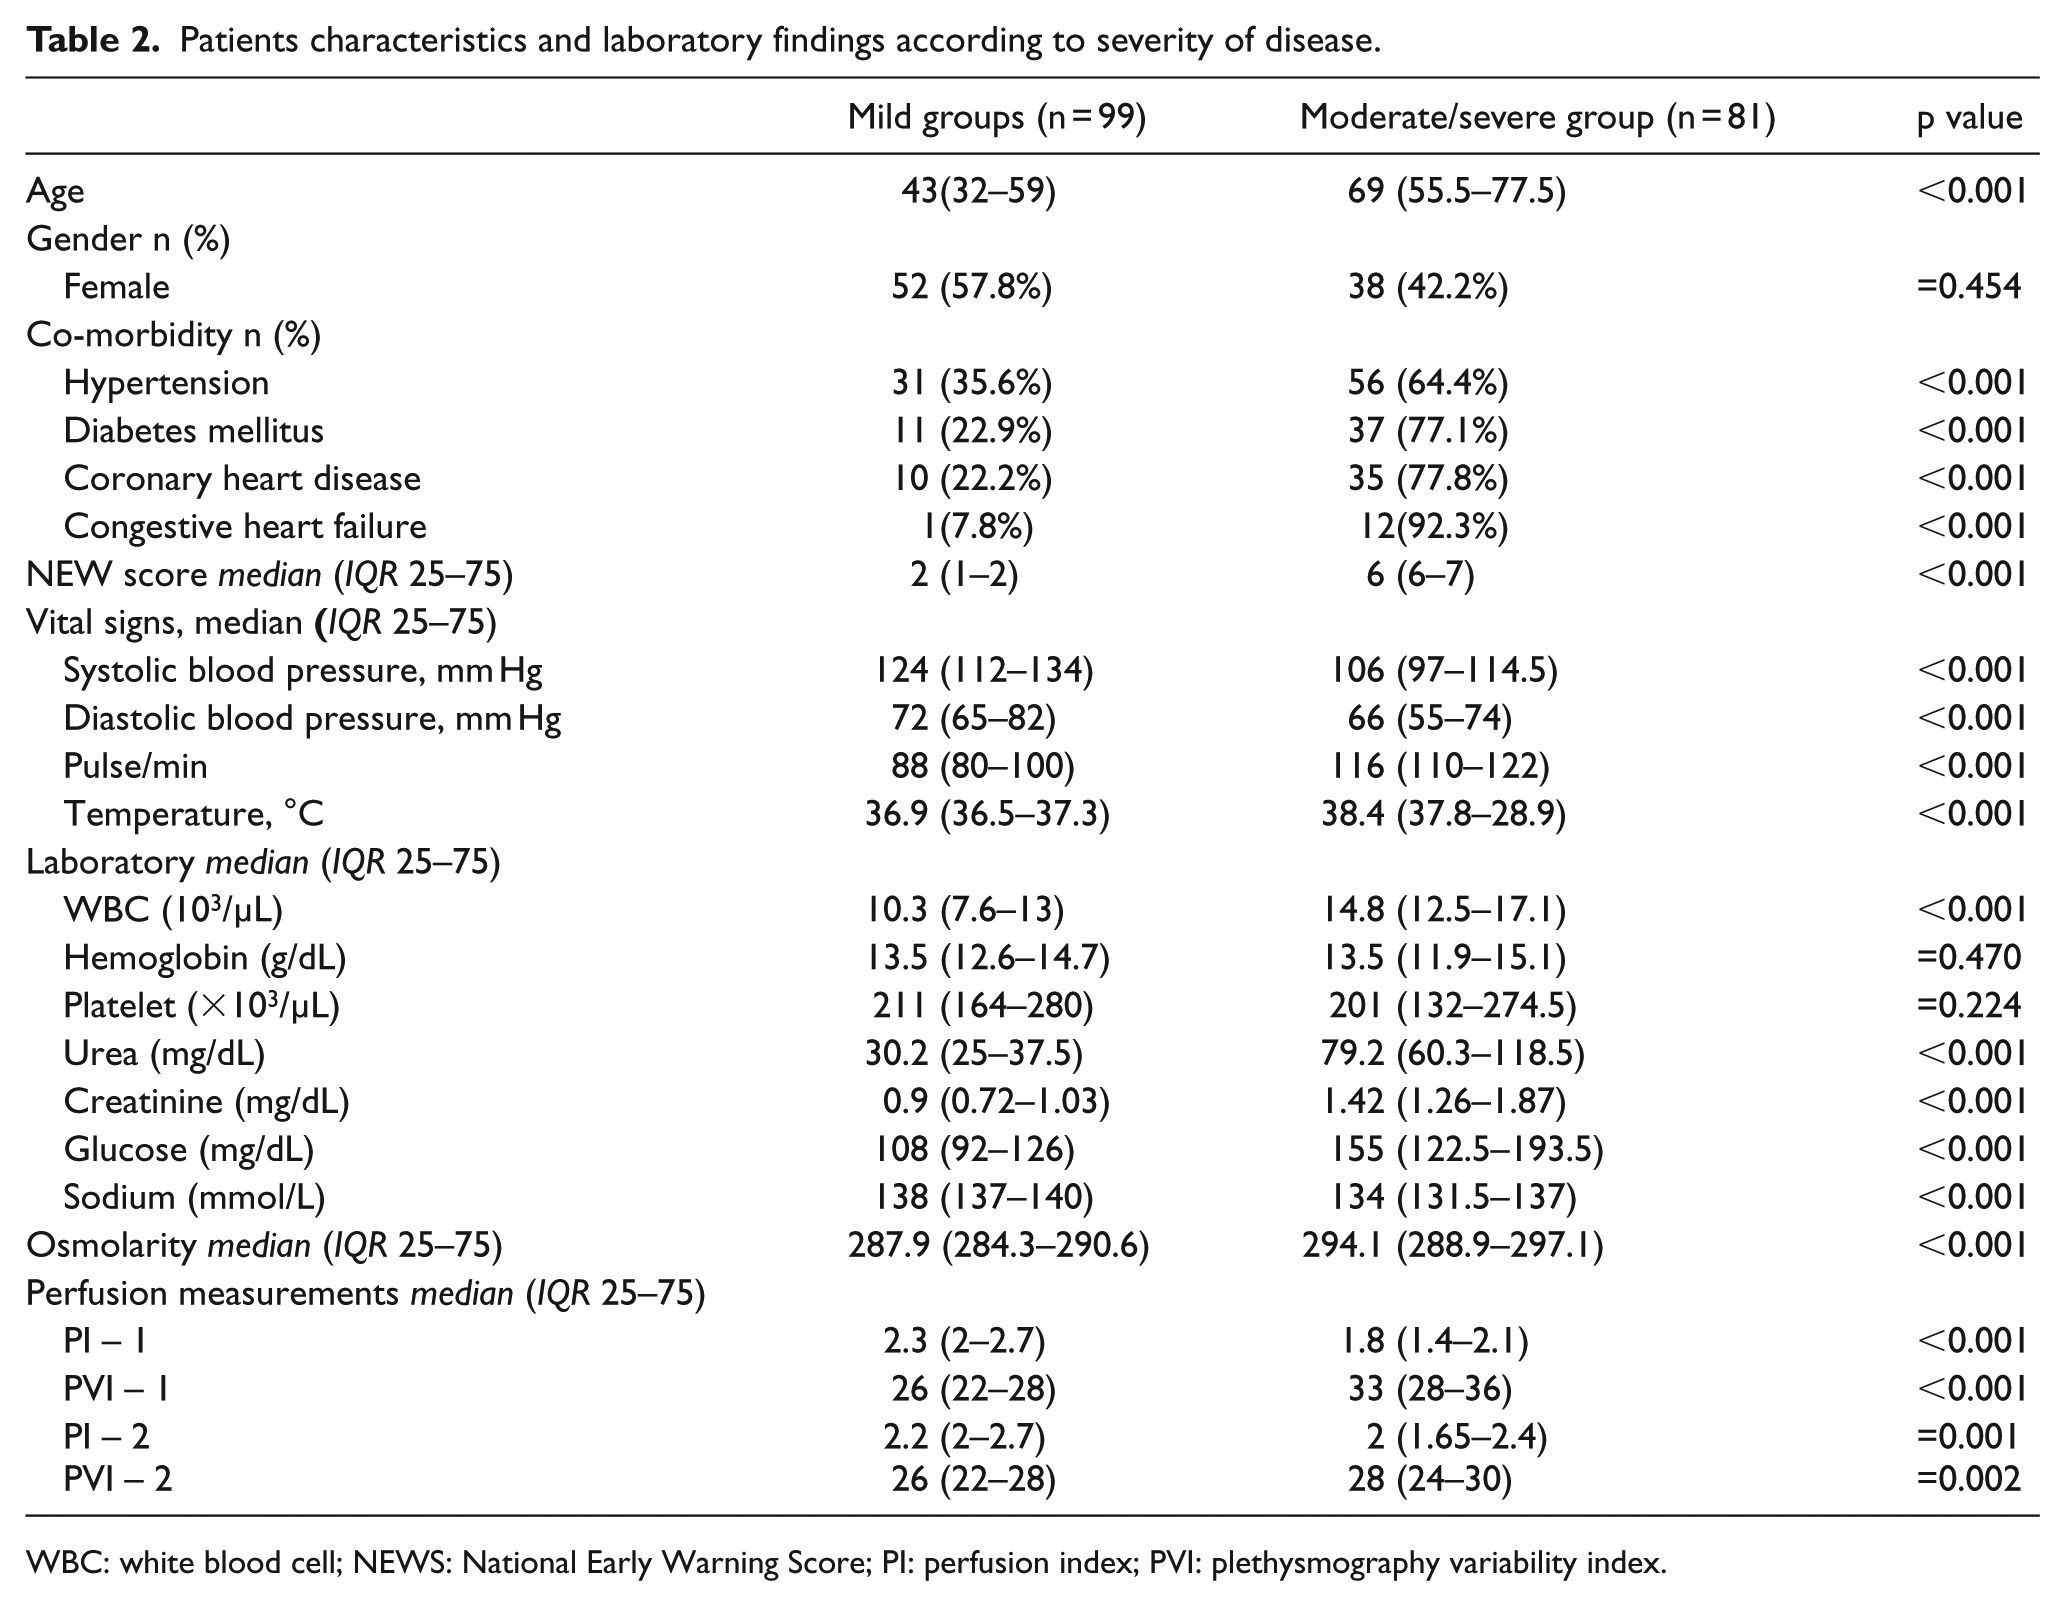
WBC: white blood cell; NEWS: National Early Warning Score; PI: perfusion index; PVI: plethysmography variability index.
An analysis of the correlation coefficients and their level of significance between osmolarity and PI, PVI revealed no significant correlation between perfusion indices and osmolarity in the mild dehydration group. However, among patients with moderate/severe dehydration, there was a statistically significant positive correlation between osmolarity and PVI (r = 0.298; p = 0.007) and a statistically significant negative correlation between osmolarity and PI (r = –0.259; p = 0.019) (Table 3).
Correlation coefficients and levels of significance between PI, PVI, and osmolarity.
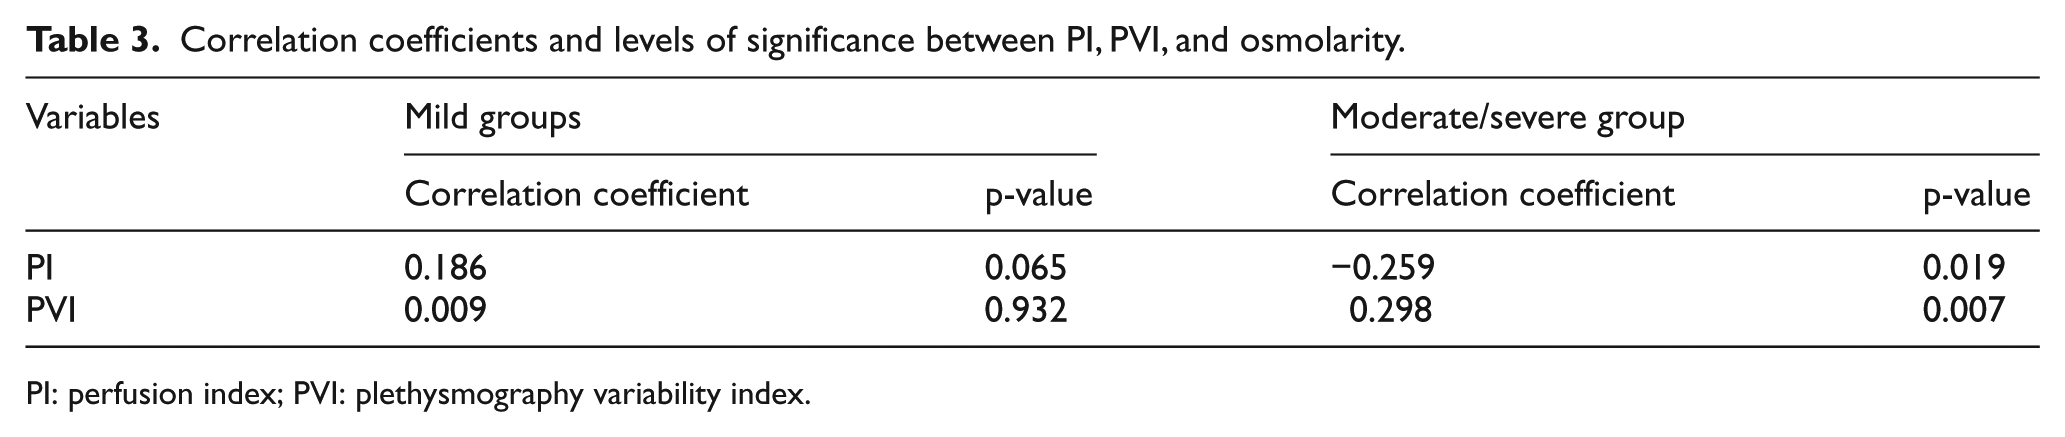
PI: perfusion index; PVI: plethysmography variability index.
An analysis of pre- and post-treatment PI–PVI changes among patients with moderate/severe dehydration showed a decrease in PI value and an increase in PVI value compared to admission levels (p < 0.01 for all values) (Table 4).
Pre- and post-treatment PI–PVI values of the moderate/severe group.
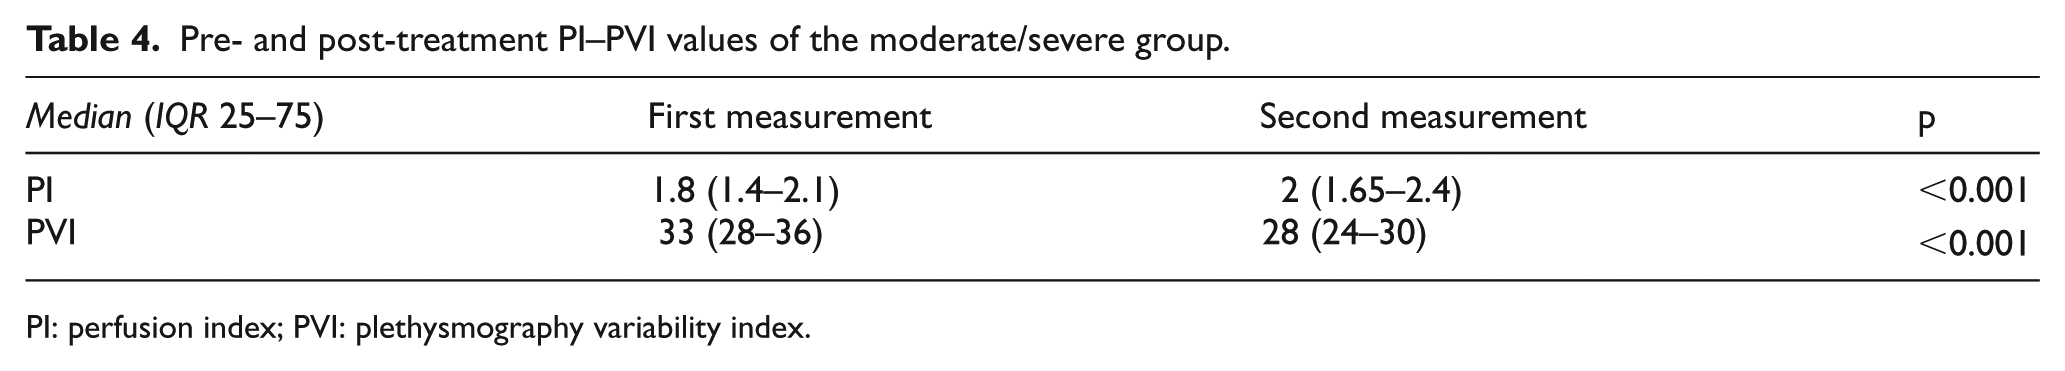
PI: perfusion index; PVI: plethysmography variability index.
Discussion
In this study where we assessed the prognostic value of PI and PVI for determining dehydration severity among patients presenting to emergency department with AGE, we found two important conclusions. First, patients with moderate/severe dehydration had a lower PI value and a higher PVI value at emergency department admission than those with mild dehydration. It is important to determine the degree of fluid loss among patients with dehydration in the emergency department. Bedside, noninvasive, easy-to-measure perfusion indexes may be used to determine the severity of dehydration especially in overcrowded emergency services. Second, especially among patients presenting with moderate/severe dehydration, we detected an increase in PI value and a decrease in PVI value after fluid resuscitation compared to admission values. Hence, we believe that perfusion indexes may be used in emergency department for diagnosis and treatment monitoring of the moderate/severe dehydration.
Acute gastroenteritis, one of the commonest causes of emergency department admissions, is a public health issue that affects millions each year and that potentially causes mortality and morbidity unless treated properly. 1 To determine the disease severity, scoring systems based on a number of variables including age, fever, mean arterial pressure, and WBC count were developed. 2 We detected that the moderate/severe dehydration group showed significant differences with respect to age, having comorbid conditions, WBC, and renal function tests compared to mildly dehydrated group. Plasma osmolarity, the most important indicator of physiological fluid balance, reflects hydration status. Serum osmolarity increases in dehydration. 3 , 17 In our study, while there was no correlation between osmolarity and PI and PVI values among patients with mild dehydration but there was found a statistically significant weak correlation in patients with severe dehydration. In emergency departments with high admission numbers, in assessment of volume status of the patient bedside, noninvasive perfusion indexes that enable continuous monitoring independently of laboratory parameters may provide convenience to physicians in patient management.
In the literature, several studies have investigated the effectiveness of PVI for determining volume status and fluid responsiveness in mechanically ventilated patients. 6 , 7 , 9 Loupec et al. showed the ability of PVI to predict fluid responsiveness in severely ill patients on mechanical ventilation. They found that a threshold value of 17% allows discrimination between responders and nonresponders with good sensitivity and specificity. 7 Similarly, in a study on patients with critically acute circulatory failure, the efficacy of PI changes for determining fluid responsiveness was investigated and it demonstrated an increase in PI among patients with a positive response to passive leg raising (PLR). 18
However, studies on the role of PI and PVI measurements among spontaneously breathing patients were limited and had variable results.10–14 Keller et al. 10 reported that changes in PVI due to PLR were weak in spontaneously breathing patients. As far as to our knowledge, no study has ever studied the role of PI and PVI measurement for determining dehydration severity among spontaneously breathing patients. Considering a volume loss brought about mild dehydration is similar to minimal volume change formed by PLR, it can be argued that our results are in agreement with the literature and PI and PVI are not reliable markers for showing minimal volume changes among spontaneously breathing patients. Schoonjans et al. 11 detected a marked increase in PVI value after hypovolemia among spontaneously breathing patients. Our results also indicated a lower PI and increased PVI levels among patients with severe dehydration. In moderate–severe dehydration fluid loss is more severe. Thus, it can be argued that significant changes occur in PI and PVI values independent of a patient’s respiration mode as the severity of dehydration increases. These indexes may be effective especially for determining excessive fluid losses. We also detected a significant difference between pre- and post-treatment measurements within the moderate–severe dehydration group. In this group of patients these indexes may be used for monitoring treatment response.
Conclusion
Acute gastroenteritis is one of the common causes of emergency department admissions that may cause morbidity and mortality due to fluid loss in at-risk groups. Therefore, it is of paramount importance for emergency physicians to determine dehydration severity and administer appropriate treatment. We are of the opinion that PI and PVI may be used as bedside, rapid, and effective markers for determining dehydration severity among patients with acute gastroenteritis and treatment monitoring among patients with moderate/severe dehydration.
Limitations
First, our study was performed at a single center and enrolled patients in a certain age group. In addition, though definition of AGE was tried to be standardized in the study protocol, etiology AGE was not investigated. The patients were not monitored invasively at the emergency department. Their long-term outcomes and survival status were also not determined.
Footnotes
Declaration of conflicting interests
The author(s) declared no potential conflicts of interest with respect to the research, authorship, and/or publication of this article.
Funding
The author(s) received no financial support for the research, authorship, and/or publication of this article.
Availability of data and materials
The data set generated and/or analyzed during this study are available from corresponding author.
Informed consent
Written informed consent was obtained from patients or relatives.
Ethical approval
Ethical approval for this study was obtained from Kecioren Training and Research Hospital Ethics Committee (KAEK-032019/1886).
Human rights
The study protocol conforms to the ethical guidelines of the 1975 Declaration of Helsinki.