
Abstract
Purpose:
In this study, we aimed to compare cardiac output, echocardiographic pulmonary velocity-time integral, and end-tidal carbon dioxide values before and after the passive leg raising maneuver in healthy volunteers.
Methods:
The Ethical Commission approved the study. A total of 36 volunteers were included after signed informed consent in our study. After 12 h of fasting, vital signs, cardiac output, pulmonary velocity-time integral, and end-tidal carbon dioxide were measured when the participants were lying supine. Then, participants’ legs were elevated to 45° passively, and all measurements were repeated. Pulmonary velocity-time integral was obtained in parasternal short-axis view with the aid of pulse Doppler. Pulmonary root measurements were recorded. Echocardiographic stroke volume and cardiac output were calculated. The differences between values of cardiac output, pulmonary velocity-time integral, and end-tidal carbon dioxide before and after passive leg raising were statistically compared. The level of significance was accepted as p < 0.05.
Results:
Significant differences were found between pre- and post-passive leg raising values of these three measurements. The effect of passive leg raising on pulmonary velocity-time integral measurements was greater. The change in end-tidal carbon dioxide was not correlated with either cardiac output or pulmonary velocity-time integral alteration.
Conclusion:
Our results showed that measurement of pulmonary velocity-time integral changes after passive leg raising is a more useful bedside method to predict fluid responsiveness than measurement of end-tidal carbon dioxide and cardiac output alteration.
Introduction
Uncorrected hypovolemia leads to inappropriate infusion of vasopressors and may result in organ hypoperfusion.1,2 Intravenous fluid replacement is a frequently used way of increasing cardiac output (CO) and correcting hypotension, but excessive replacement of intravenous fluids may result in hypervolemia in this group of patients. Studies in the intensive care unit (ICU) have shown that only 50% of hemodynamically unstable and critically ill patients are volume-responsive.1,3 It is a vital issue to predict if a patient will respond to intravenous fluids or not.
Correlation between volume status and CO can be understood by a Frank-Starling curve.4–6 If a patient’s volume status is coherent with the curve’s steep portion, we can predict that this patient will respond to intravenous fluids; if the volume status is coherent with the curve’s flat portion, the patient will be unresponsive to intravenous fluids. 4 At present, there are some static and dynamic tests to understand which portion of the curve has concordance with the patient’s volume status. The most popular dynamic test is passive leg raising (PLR). PLR is a validated dynamic method to predict fluid responsiveness, and it has been proven in a number of different situations.1,7 PLR increases preload by transferring blood pooled in the lower extremities to the central compartment.4,8 PLR is performed by adjusting the bed to an obtuse angle with the upper section in a flat position and the lower section inclined to 45°. Maximal change in CO or related parameters occurs within 60 s, and an increase in CO suggests that the patient will respond to a fluid bolus. 9
The change in CO due to PLR can be assessed by direct measurement of the stroke volume (SV) with bedside ultrasound and by calculating CO or by measuring end-tidal carbon dioxide (ETCO2) before and after the maneuver.2,10,11 ETCO2 variations correlate closely with CO variations when alveolar ventilation is kept constant, assuming stable production of carbon dioxide.1,12 If CO increases by 10% or ETCO2 increases by 5% following PLR, this finding might be interpreted as predictive of a positive response to intravenous fluids.
There are lots of studies about prediction of volume response by PLR using these two methods, but none comparing the two methods. The cause may be that the populations of these studies are mostly ICU patients who have concomitant other pathologies that can affect both CO and ETCO2.
In this study, we aimed to compare changes in echocardiographic pulmonary velocity-time integral (PVTI) and ETCO2 values before and after the PLR maneuver in healthy volunteers. PLR is used as a non-invasive alternative to fluid infusion. We measured the variation in CO, PVTI, and ETCO2. To exclude confounding factors, the study was conducted in healthy volunteers without any concomitant illnesses.
Materials and methods
This study was conducted in a university hospital. The Ethical Committee of the Kütahya Dumlupinar University Faculty of Medicine approved the study (Approval number: 2017-9/3). Written informed consent was obtained from the participants for their anonymized information to be published in this article. Thirty-eight adult volunteers were prepared for the measurements, but two of them were excluded from the study because of poor ultrasonographic image quality. Thirty-six healthy adult volunteers aged between 18 and 65 were included in this study. Participants had no history of chronic diseases and were healthy at the time of enrollment. Volunteers with known pregnancy were excluded.
Participants were included in the study after 12 h of night fasting. First, vital signs were recorded. Later, pre-PLR measurements of CO, PVTI, and ETCO2 were made when the participants were lying in the supine position. Then, participants rested as they were lying in a semi-recumbent position for 3 min. After 3 min of relaxation, the head of the bed was lowered to the supine position, and participant’s leg elevated to 45° passively; post-PLR measurements were completed in that position in 1 min.13,14 Sidestream ETCO2 and vital signs monitoring was performed using a Mindray® monitor (Mindray Bio-Medical Electronics Co, Shenzen, China) by a nurse blinded to the study. Ultrasonographic images were obtained by an experienced emergency physician internationally certified in ultrasonography. The images were acquired with a commercially available Terason® uSmart 3200T-model portable ultrasound system (Teratech Corporation, USA) and a 3.6 MHz frequency microconvex transducer. Pulmonary valve images were obtained in parasternal short-axis view. The pulmonary valve area was calculated by measuring the pulmonary artery diameter at the valve level during the end of systole, and using the area formula of πR 2 /4. Later, using pulse Doppler with 3 mm sampling (Figure 1), systolic spectral wave forms of the pulmonary valve were recorded for three cycles in order to minimize the effect of respiration. PVTI calculations were made from these pulmonary spectral wave forms and then the mean of three PVTI values was calculated (Figure 1). SV and CO were calculated with the equations SV = PVTI × pulmonary root area, and CO = SV × heart rate. The pulmonary root area was accepted as constant and was calculated only once, during systole, for each participant.
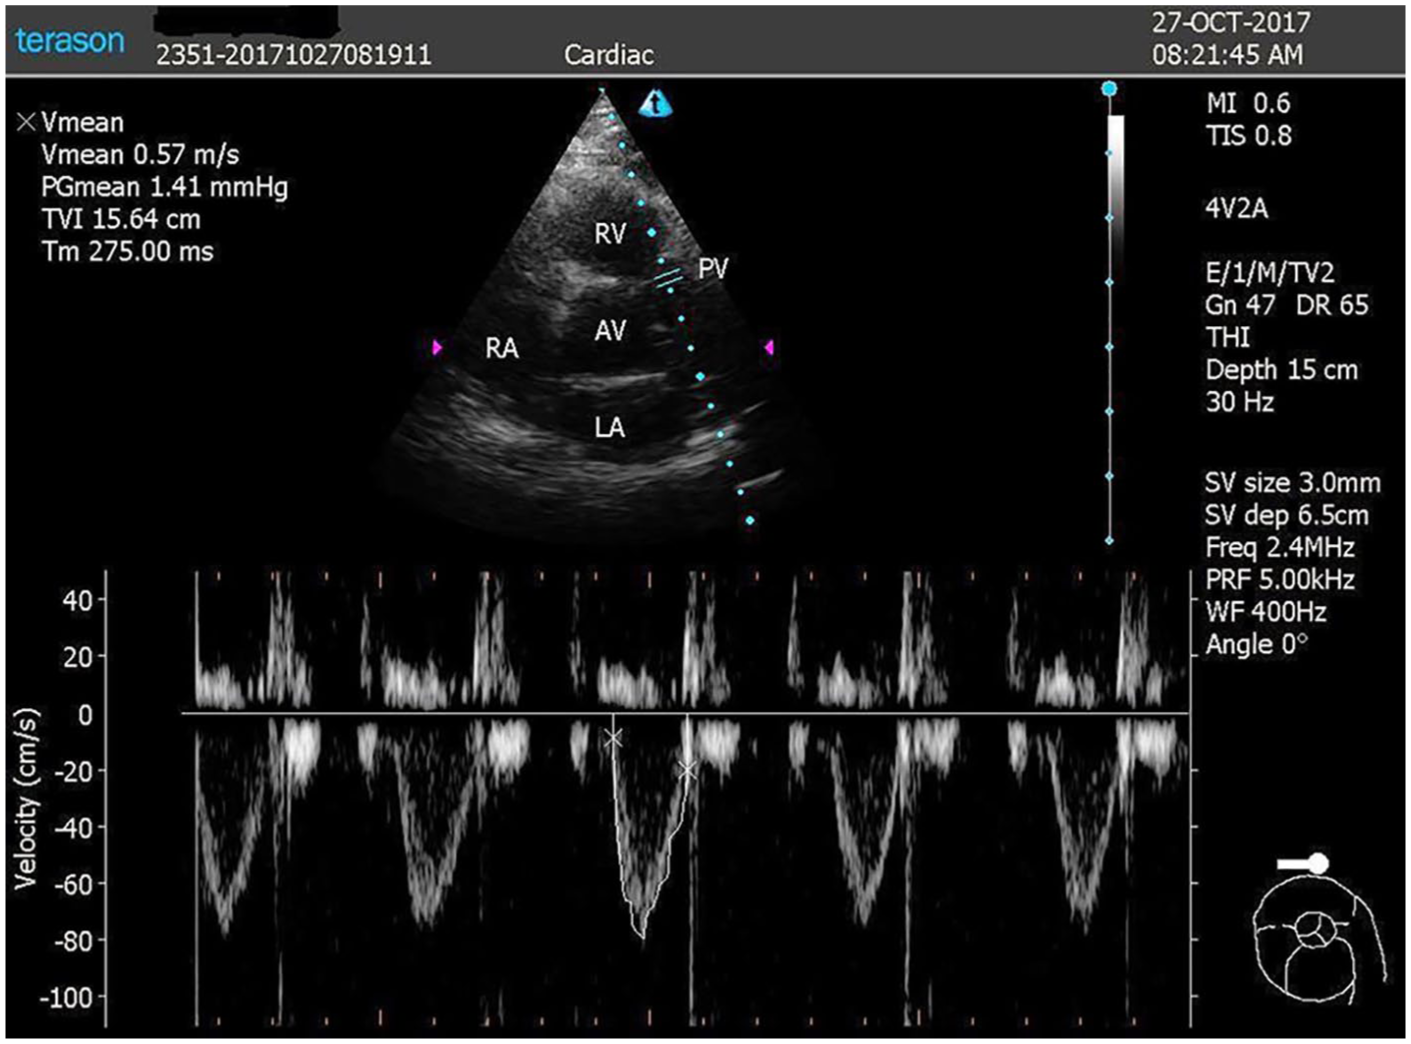
Image of pulmonary valve and pulmonary velocity-time integral obtained in parasternal short axis view using pulse Doppler with 3 mm sampling.
Statistical analysis
A preliminary analysis was performed using the data for nine volunteers before the study, and normality analysis of continuous measures was performed using Kolmogorov–Smirnov power analysis, Shapiro–Wilk test, and Q-Q plots. Power analysis for a repeated-measures analysis of variance (ANOVA) with two groups and three measurements was conducted using G-POWER® statistical software version 3.1 (Universitat Düsseldorf, Germany) to determine a sufficient sample size, using an alpha of 0.05, power of 0.80, and a large effect size (f = 0.25). Based on the aforementioned assumptions, the desired sample size was found to be 28. One-way ANOVA repeated measure statistics were used to determine the effect of PLR on the measurements, and post hoc analysis was done by paired-samples t-tests to compare the differences between before and after values. The correlation between these measurements was calculated by Pearson’s r correlation test. Continuous variables are reported as the means with standard errors and 95% confidence intervals (CIs). The maximum type 1 error was 0.05 in this study, and the level of significance was accepted as p < 0.05. MedCalc® (MedCalc Software bvba, Belgium) was used for statistical computing.
Results
During this study, 37 healthy volunteers were studied following 12 h of fasting. Their mean age was 24 years, and 25 (67%) were male. Using a one-way repeated-measures ANOVA, we found significant differences in the effect of PLR on three measurements (post-PLR vs pre-PLR values, F = 834.17, p < 0.001). Post hoc analysis illustrated that the difference between pre- and post-PLR PVTI values (p < 0.001; M = 3.589, SE = 0.257, n = 36) was greater than the difference between pre- and post-PLR ETCO2 (p < 0.001; M = 1.833, SE = 0.213, n = 36), and the difference between pre- and post-PLR CO (p < 0.0001; M = 1.777, SE = 0.257, n = 36) (Table 1, Figure 2).
Mean values and differences in the values of three variables before and after leg raising.
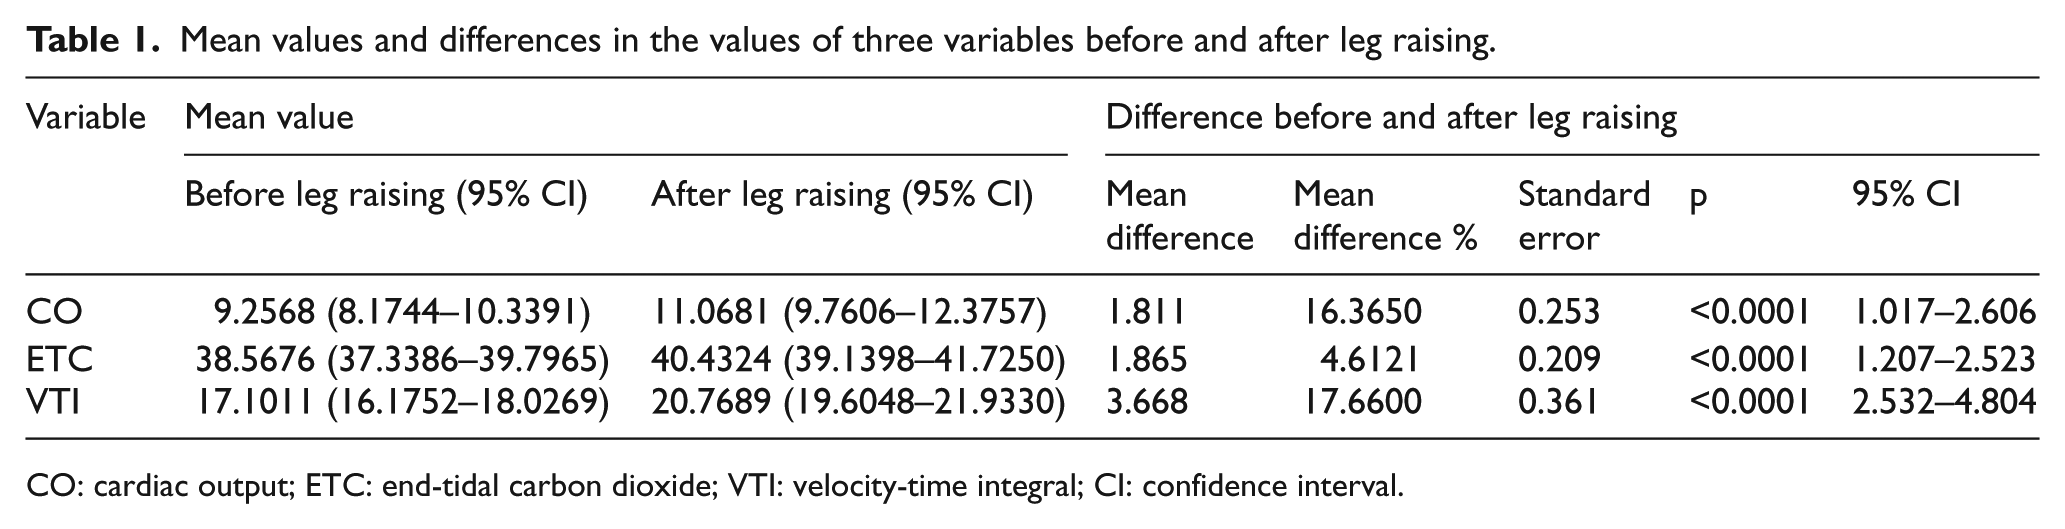
CO: cardiac output; ETC: end-tidal carbon dioxide; VTI: velocity-time integral; CI: confidence interval.
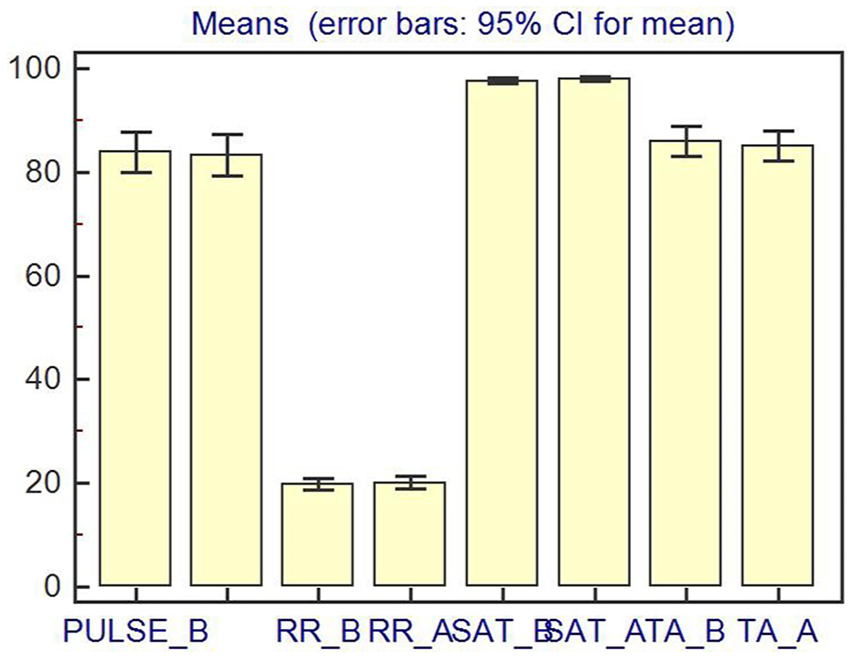
Mean values and error bars for cardiac output, pulmonary velocity-time integral, and end-tidal carbon dioxide before and after passive leg raising.
All paired comparisons of vital signs (pre-PLR and post-PLR values) were statistically insignificant. Differences in pulse rate, respiratory rate, oxygen saturation, and mean arterial blood pressure values pre-PLR (83.8, 95% CI, 80.0–87.7; 19.8, 95% CI, 18.7–20.9; 97.6, 95% CI, 97.0–98.2; 85.9, 95% CI, 83.1–88.8, respectively) and post-PLR (83.3, 95% CI, 79.3–87.3; 20.1, 95% CI, 18.9–21.2; 97.8, 95% CI, 97.4–98.3; 85.0, 95% CI, 82.2–87.9, respectively) were found to be statistically insignificant when compared with paired-samples t-test (Table 2).
Differences in vital signs before and after leg raising.
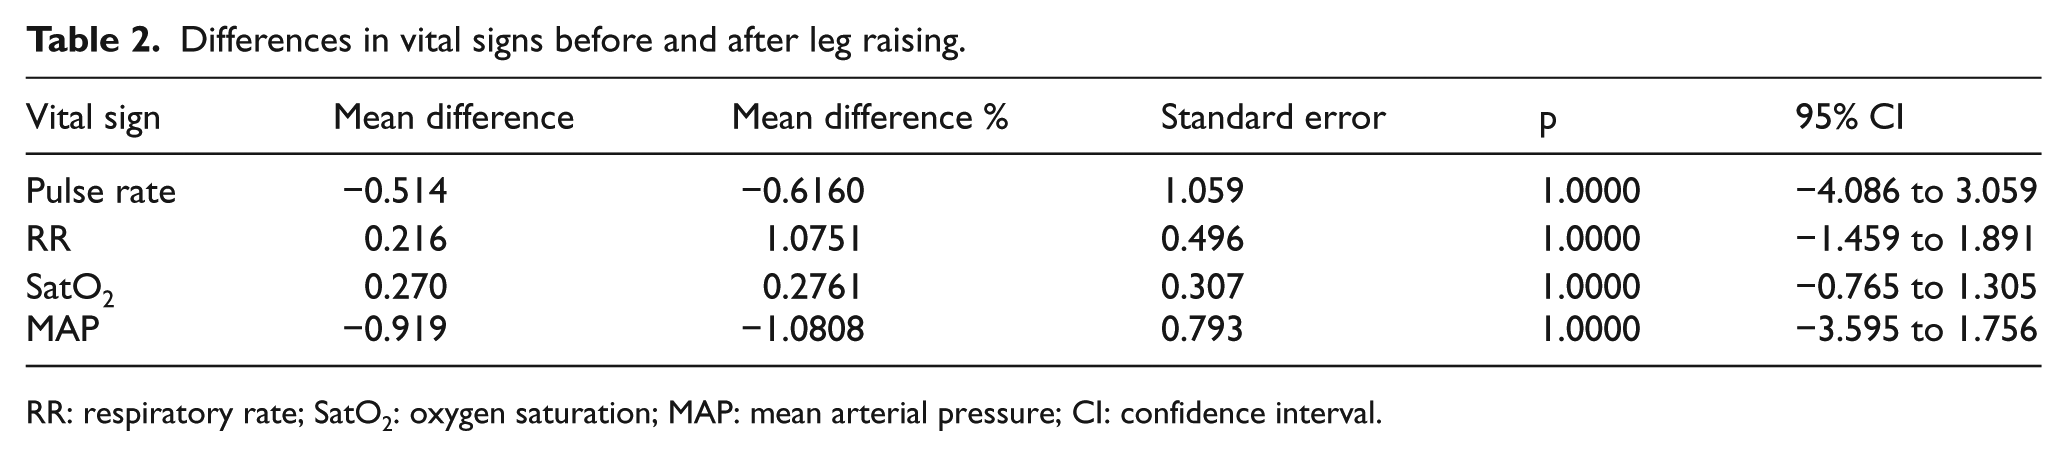
RR: respiratory rate; SatO2: oxygen saturation; MAP: mean arterial pressure; CI: confidence interval.
Our preliminary results showed that the post-PLR CO and PVTI values were well correlated in our study groups (Pearson correlation coefficient, r = 0.49, p < 0.001). Post-PLR ETCO2 was not correlated with either post-PLR CO or post-PLR PVTI values (r = 0.16 and −0.019, respectively).
Discussion
Hypotension is a representative sign in patients with unstable circulation. Volume treatment is the primary treatment, and the goal is to match volume with cardiac function to keep the heart in an optimal working condition. Different patients have different volume status. An adequate preload is determined by the capacity of the heart, which is reflected by fluid responsiveness. The easiest way to test preload responsiveness is to administer fluid and to observe clinical wellness. However, this kind of intervention may result in pulmonary edema and dyspnea in patients with limited cardiac reserve. In recent years, there have been plenty of methods used for the assessment of clinical response to fluid therapy. Variations of ETCO2, SV, and VTI with PLR are among these methods, which are classified as dynamic methods. A PLR test with measurement of CO has been found to have enough sensitivity and specificity for determination of fluid response of the heart, 7 and studies have demonstrated that convenient delta SV index measurements in conjunction with PLR can predict the hemodynamic response to volume expansion in both non-intubated critically ill patients15,16 and intubated ones. 17 We have found also a similar effect in CO variation with PLR in our study. The increase in the percentage of CO after the PLR maneuver was 16% (mean difference, 1.811).
The relationship between CO and ETCO2 has been known for decades,18,19 so measurement of ETCO2 has been proposed to confirm the restoration of spontaneous circulation in patients with cardiac arrest, 20 but it is also a quantitative indicator of the hemodynamic effectiveness of precordial compression during cardiopulmonary resuscitation. 21 Moreover, since ETCO2 is mainly determined by tissue CO2 production, alveolar ventilation, and CO (i.e. pulmonary blood flow 22 ), when stable metabolic conditions are assumed and minute ventilation is kept constant, acute changes in ETCO2 have been shown to correlate strongly with changes in CO in experimental23,24 and clinical settings.25,26 Monge Garcia et al. 27 have demonstrated that ETCO2 values with a 5% increase from the baseline (absolute increase ⩾2 mmHg) during PLR are associated with a positive response in their study population. Our results also depicted a 4.6% (mean difference from the baseline, 1.86 mmHg) increase after PLR, and this finding was also well correlated with these findings. However, we did not find any significant correlation between CO and ETCO2 increase after PLR. This could be related to the factors (cell metabolism, minute ventilation, and different respiratory dead spaces) that can affect the absolute measurement of ETCO2. These studies, together with our study, have some limitations. First, during the PLR maneuver, the variation range of ETCO2 was small. If ETCO2 increased 1–3 mm Hg or 5% compared with the baseline value, it was regarded as a positive fluid response. However, the range is so small that there may have been false-positive decisions in clinical settings. The false-positive rate for ETCO2 can also increase if the CO2 level is increased by repeated inhalation or prolonged expiration. Second, in the critically ill patient, acute respiratory distress syndrome, pulmonary edema, pulmonary atelectasis, and pulmonary consolidation are common. In these patients, the ventilation–perfusion ratio is imbalanced. In these conditions, increased blood volume may be located in an unventilated area after PLR, and CO2 cannot be dispersed from the blood to the alveolus. Because of these obstacles, this method cannot be a reliable method for decisions of fluid therapy management.
Maizel et al. 15 demonstrated that an increase of more than 12% in CO or SV during PLR predicts that a patient will respond to volume. Lamia et al. 28 concluded that PLR induces an increase of 15% or more in SV after volume expansion, with a sensitivity of 77% and a specificity of 100%. Our findings also correlate with the literature, as we have depicted increases in CO and PVTI (16.36% and 17.66%, respectively) compared with the baseline measurements before PLR.
Since the change in heart rate before and after PLR was not statistically significant in our study, we have depicted that increased CO after PLR was totally dependent on the effect of SV changes. PVTI measurements depict these SV changes directly. An increase in ETCO2 of 4.6% and in CO of 16.36% after PLR shows minimal increases in numeric values, resulting in difficulties in decision-making at the patient’s bedside by clinicians.
Limitations
The main limitation of our study is the sample size. Another limitation is that measurements were performed by a single observer not blinded to the study, which made it impossible to take inter-performer variability into account and also may have caused intention-to-measure bias. More advanced studies are needed to clarify the effectiveness of these bedside methods with real patients in challenging conditions and also with multiple observers to externally validate the results.
Conclusion
Despite these limitations, our results showed that measurement of PVTI values with the aid of echocardiography before and after PLR is a useful bedside method than ETCO2 and CO measurements because of the relatively more distinctive change in PVTI. So, we recommend the usage of PVTI by emergency physicians at the bedside to make more reliable, faster, and easier decisions on fluid therapy.
Footnotes
Authorship
E.E.Ü. and S.K. contributed to study conception and design, and acquisition of data. E.E.Ü. and A.K. contributed to analysis and interpretation of data. E.E.Ü., A.K., and K.B.M. contributed to drafting of manuscript. A.K. and E.K. contributed to critical revision.
Availability of data and materials
All data and materials regarding to this manuscript are available from E.E.Ü.
Declaration of conflicting interests
The author(s) declared no potential conflicts of interest with respect to the research, authorship, and/or publication of this article.
Funding
The author(s) received no financial support for the research, authorship, and/or publication of this article.
Human rights
This study is conducted on healthy volunteers and written informed consent was obtained from all healthy adult volunteers participating in this study. This study has been approved by Kütahya Dumlupınar University Ethics Committee (Approval number: 2017-9/3) and has been performed in accordance with the ethical standards as laid down in the 1964 Declaration of Helsinki and its later amendments.