
Abstract
Background:
Fluid responsiveness can be predicted by the effect of passive leg raising on cardiac output.
Objectives:
This research aimed to compare the changes in cardiac output and the peak systolic velocity values of Tricuspid annulus velocity at the free wall (S’) before and after passive leg raising in healthy volunteers.
Methods:
The study was approved by ethical commission. The desired sample size was 28, and 57 volunteers were included after they signed informed consent. The first measurements, including vital signs, S’, and cardiac output, were taken with the participants lying supine and were performed in the morning after 12 h fast. The participants were then asked to lie in a semirecumbent position for 3 min. After 3 min, the head of the bed was lowered to the supine position and the participants’ legs were elevated at 45°. Secondary measurements were repeated in this position. The differences between vital signs, cardiac output, and S’ measurements before and after passive leg raising were statistically compared. The level of significance was set as p < 0.05.
Results:
The mean values of cardiac output and S’ before passive leg raising was 9.59 L/min and 11.57 cm/s, respectively; however, those increased to 11.44 L/min and 13.72 cm/s after passive leg raising. The average increases were 16.17% for cardiac output and 15.67% for S’. The changes of cardiac output and S’ were statistically significant. The changes of vital signs before and after passive leg raising were statistically insignificant.
Conclusion:
This study has demonstrated the concordance of rise in cardiac output with S’ change by passive leg raising in healthy subjects. Further studies are needed to validate the use of S’ values in critically ill subjects.
Introduction
The early treatment and management of hypotension in emergency departments (EDs) is one of the most challenging concepts for emergency physicians (EPs). Hypotension in EDs is associated with a mortality rate of >10%. 1 Prompt and timely decision making by the EP can critically influence the patient’s response to fluid therapy. Their response depends on the status of cardiac compliance and is evaluated using the Frank–Starling curve. 2 , 3 Fluid administration is the first intervention in the management of hypotensive patients in EDs; however, studies in intensive care units showed that only 50% of hemodynamically unstable and critically ill patients were volume responsive. 4 , 5 Early prediction of this response before initiation of the therapy is the most important duty of EPs due to the limited time constraint.
Bedside cardiac ultrasonography (BECH) is an essential tool for EPs when diagnosing and making therapeutic decisions about critically ill patients.6–8 Cardiac output (CO), which is measured by BECH after passive leg raising (PLR), has been studied several times and it has been regarded as a dynamic surrogate of volume responsiveness. 4 , 9 PLR is a validated dynamic method to predict fluid responsiveness in different scenarios. 4 , 9 It increases preload by transferring blood from the lower extremities to the heart 2 , 10 and is performed by adjusting the bed to an obtuse angle with the upper section in a flat position and the lower section inclined to 45°. Maximal change in CO or related parameters occurs within 60 s, and a CO increase >10% suggests that the patient will respond to a fluid bolus. 11 CO from the right and left ventricles are equal, therefore, direct evaluation of venous return to the heart and the function of the right ventricle (RV) is a more targeted and easy approach for ED patients. Tricuspid annulus velocity at the free wall (S’) is easily obtainable with tissue Doppler imaging (TDI). 12 It has an excellent correlation with more time-consuming methods to assess right ventricular systolic function and was proposed as an assessment method of global RV function for clinical applications. 12
The aim of this study was to compare the changes in CO and S’ measurements before and after PLR in healthy volunteers after overnight fasting.
Methods
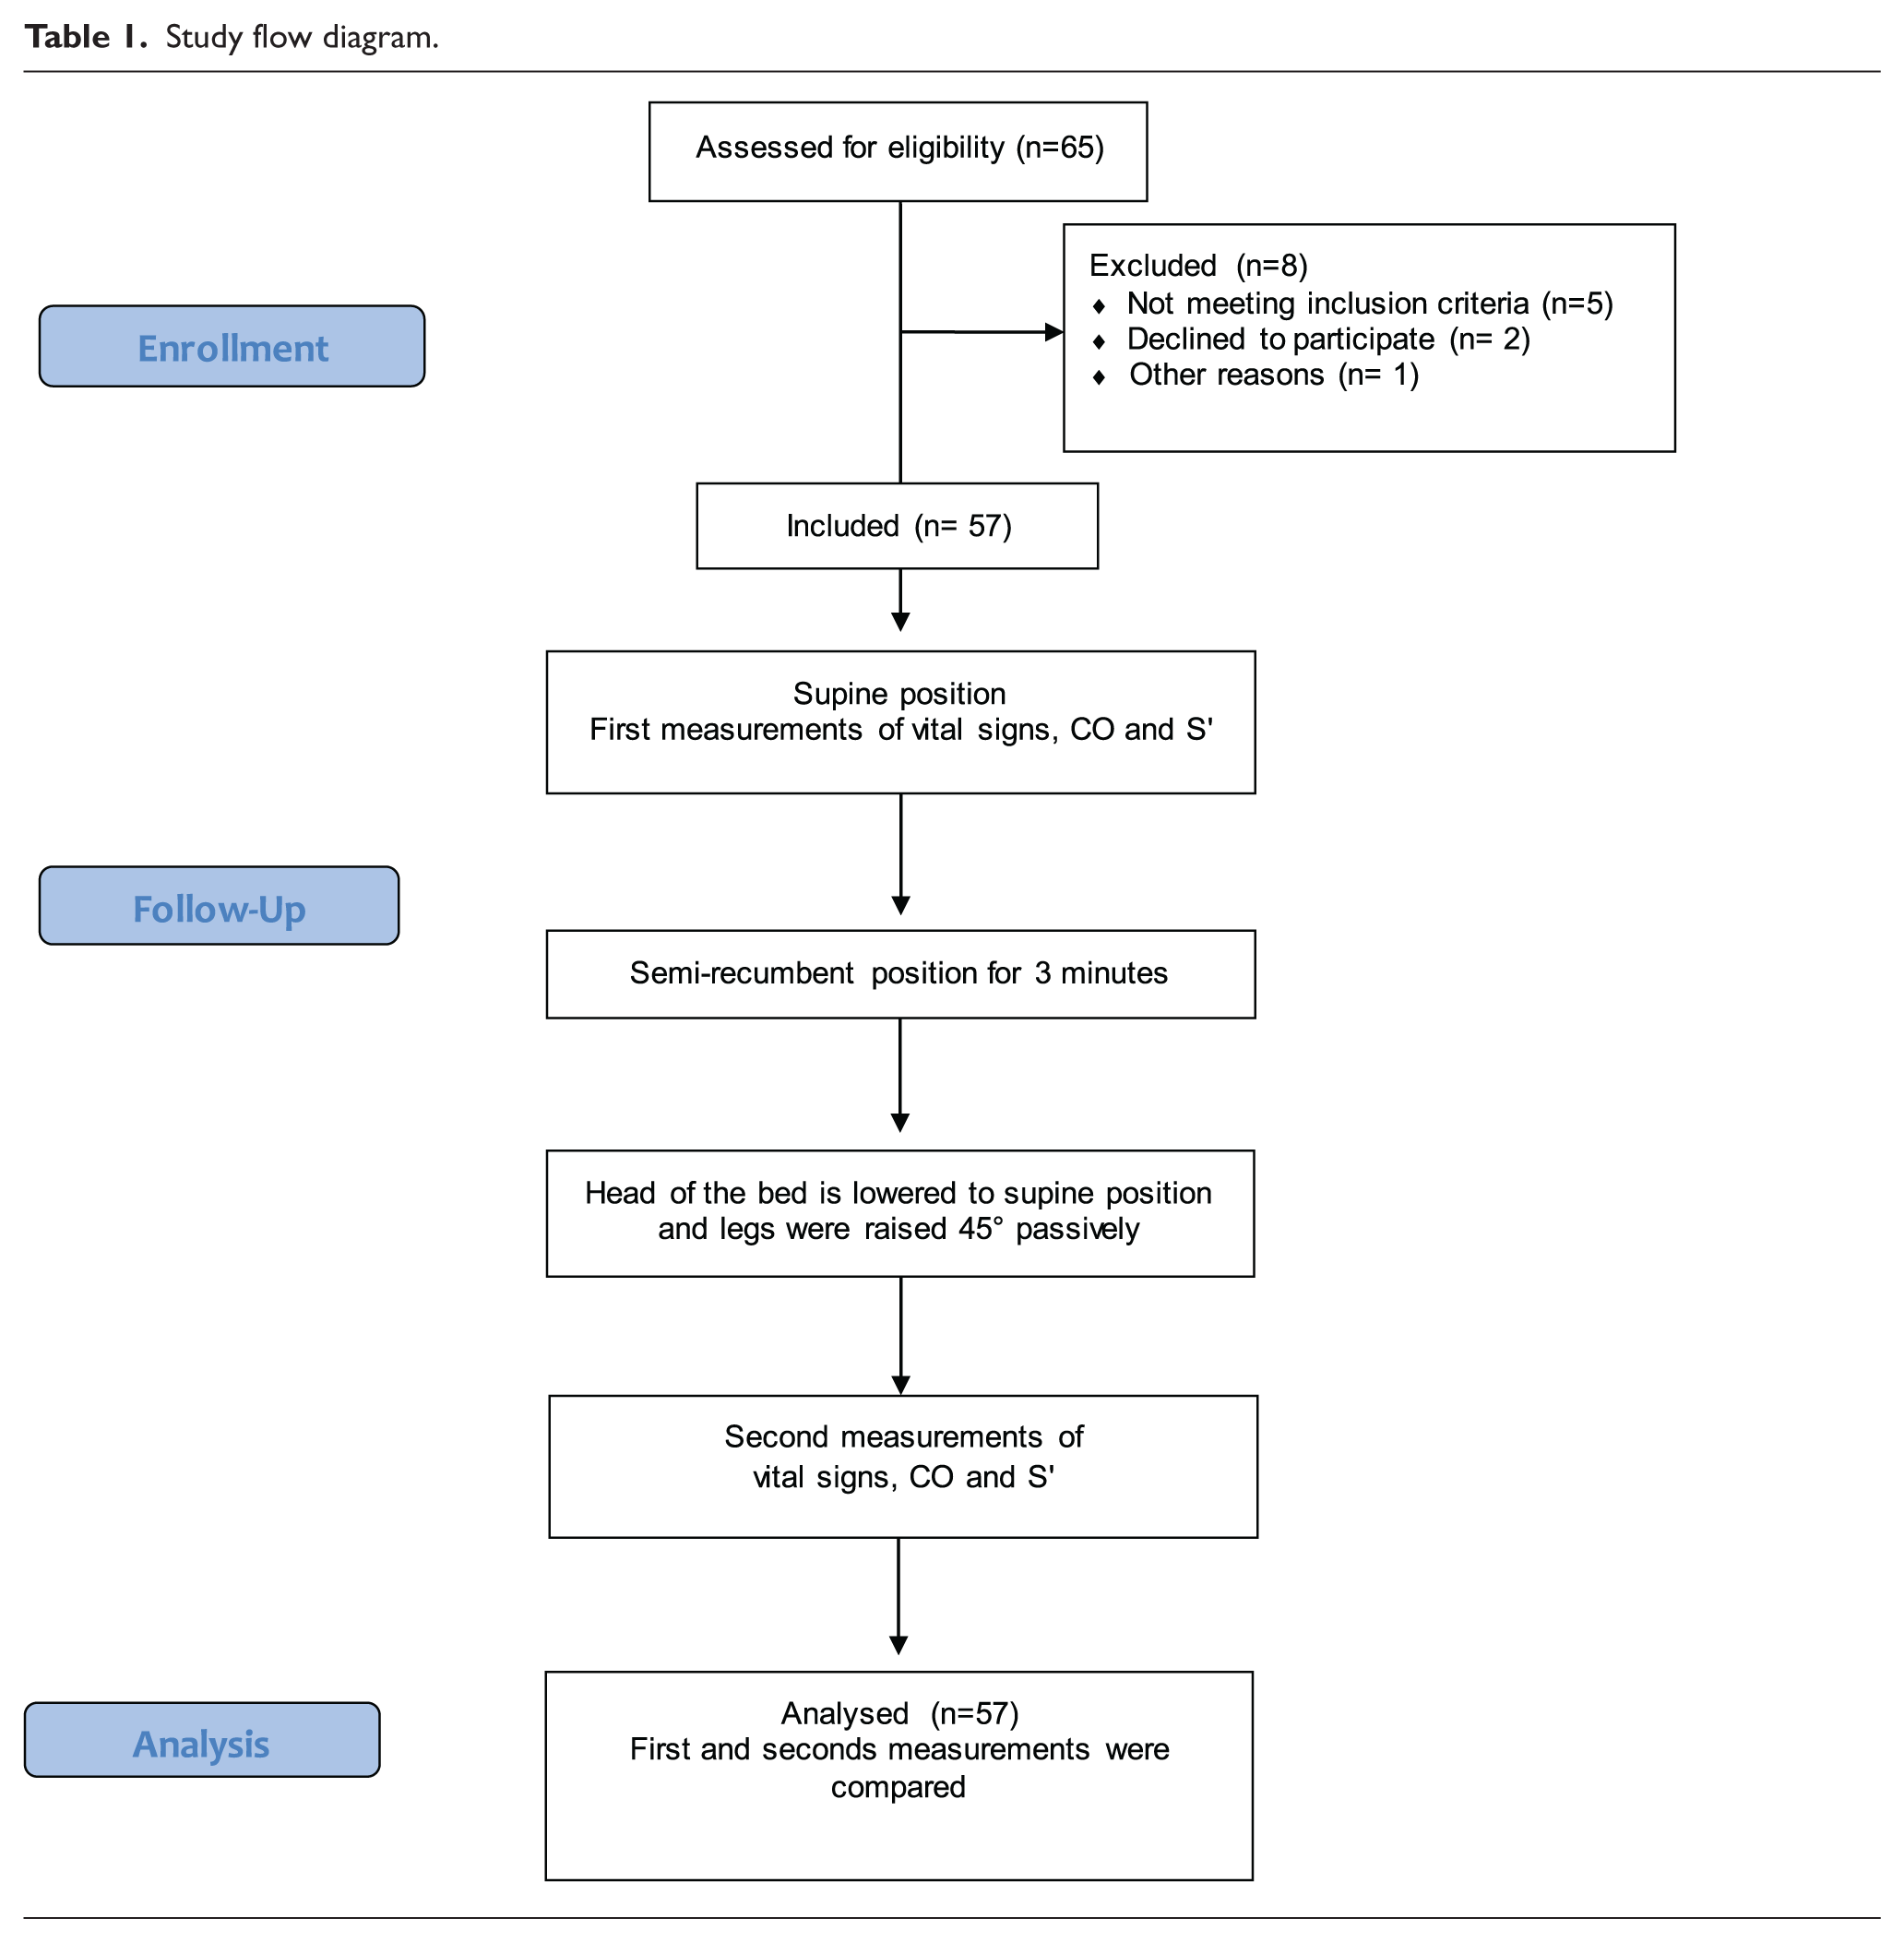
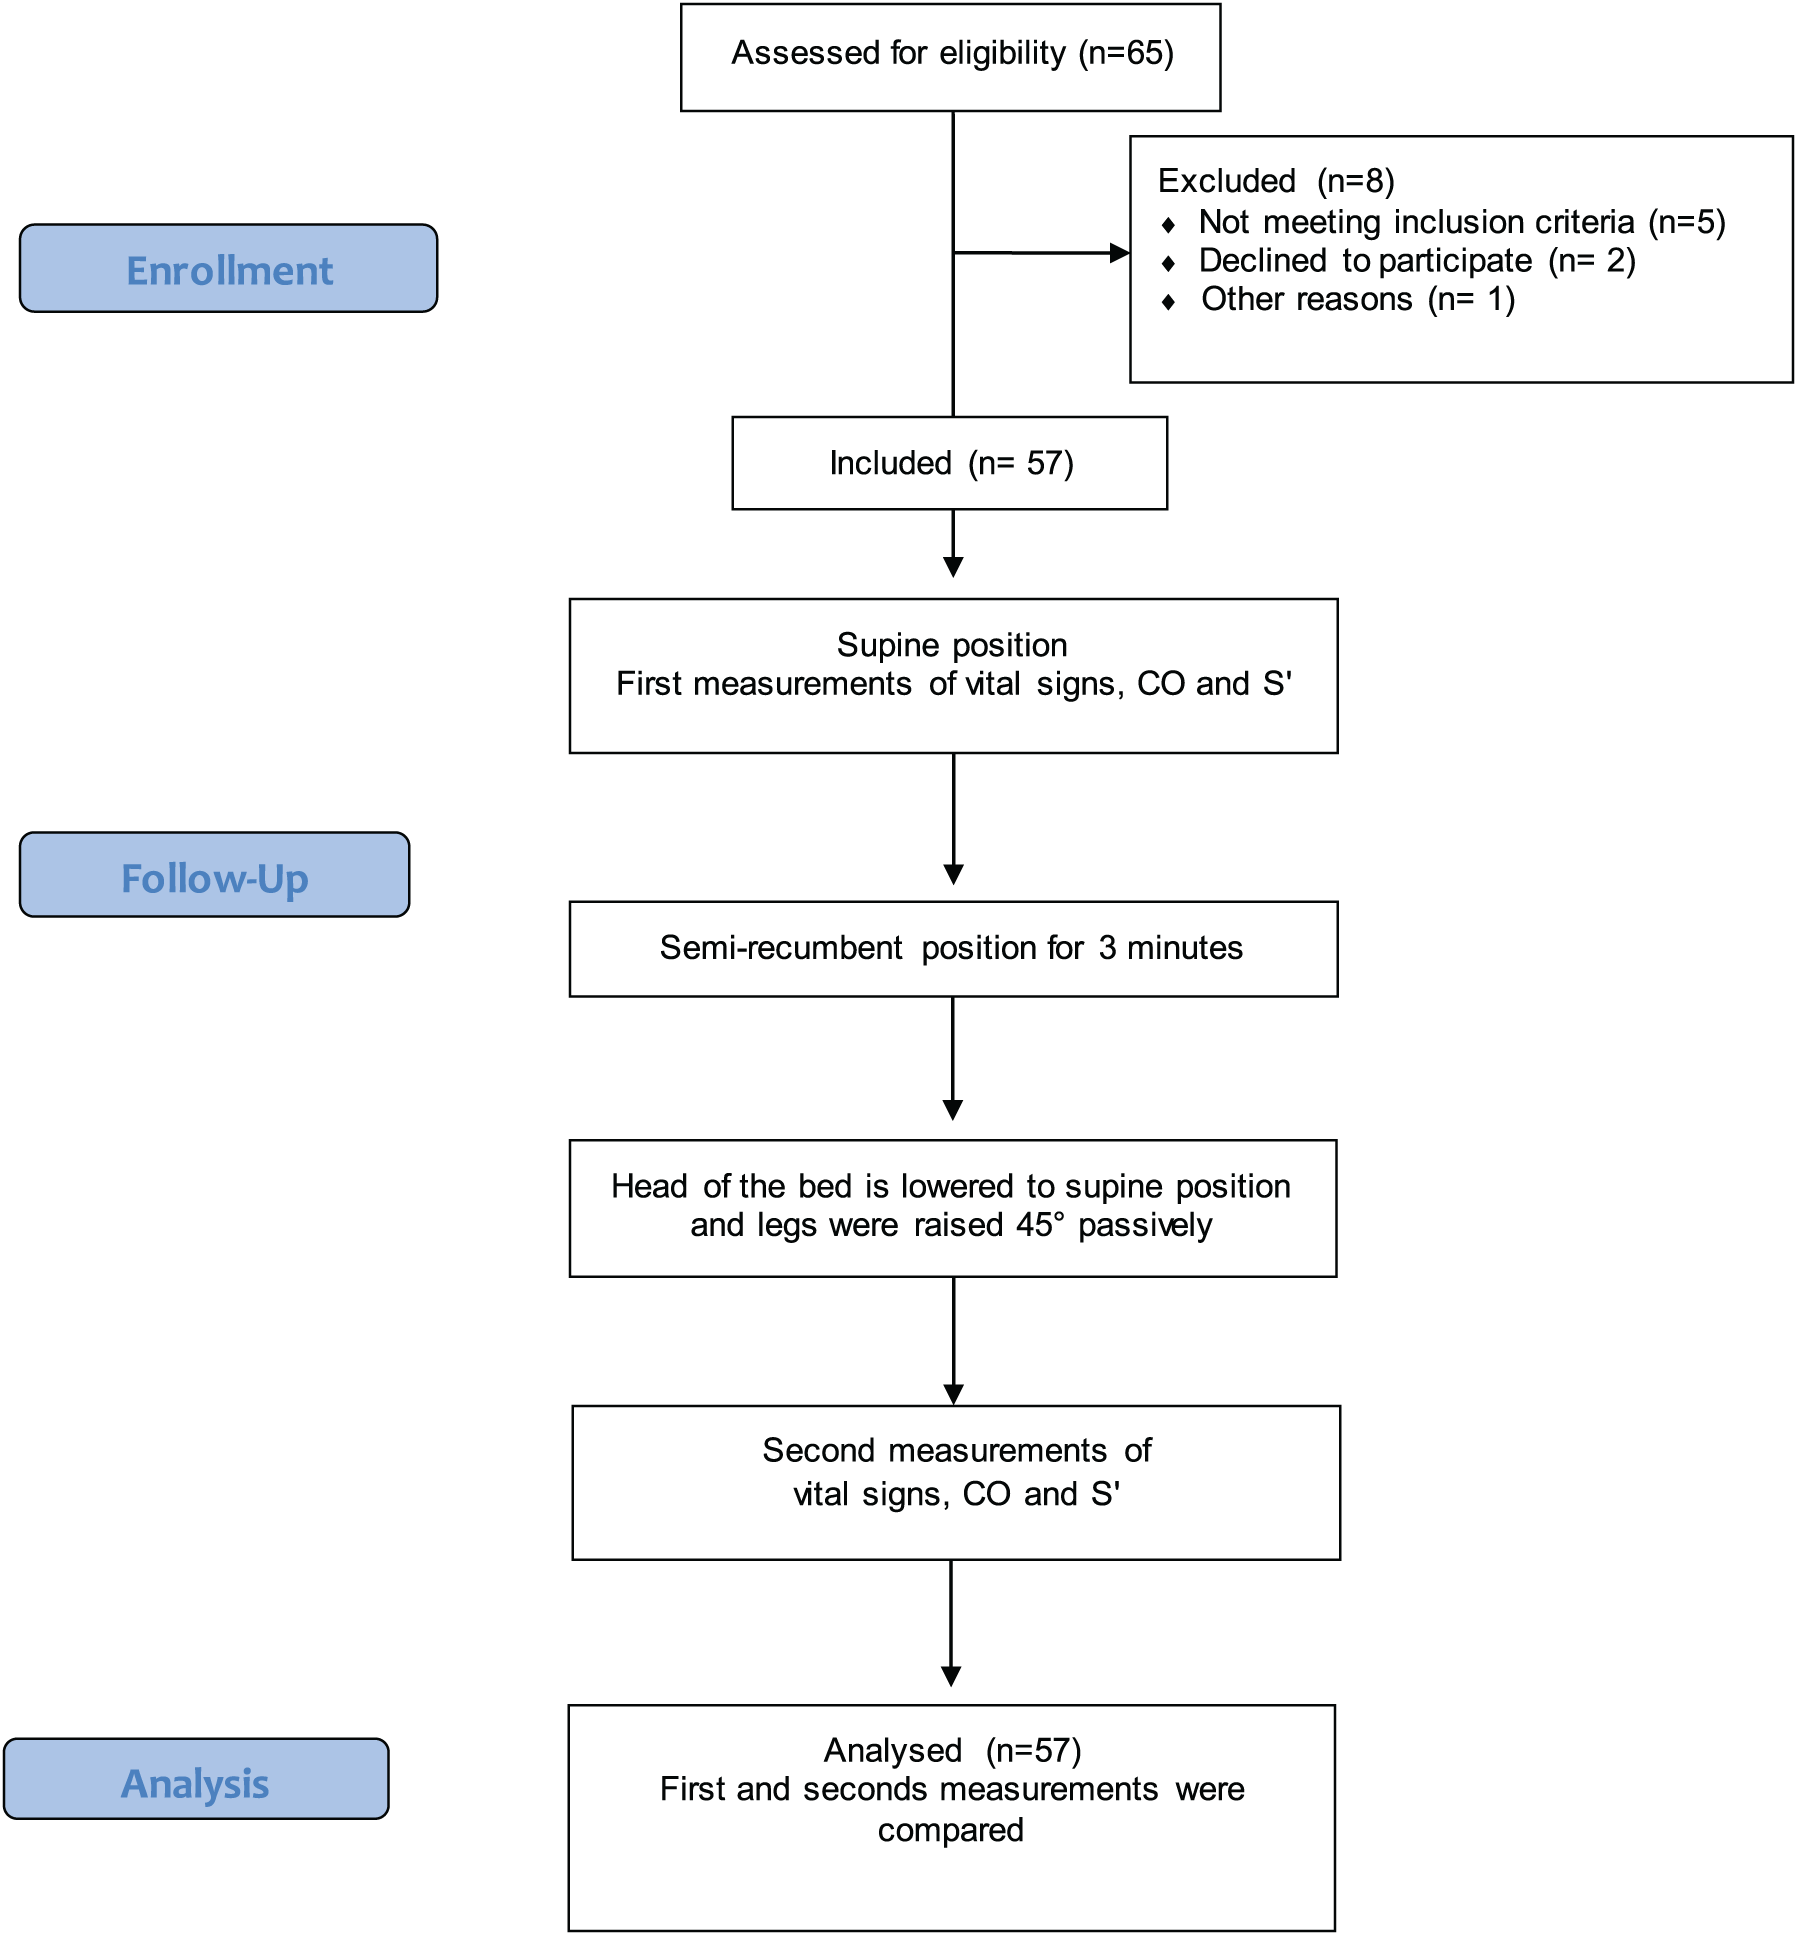
The Ethical Commission of Kutahya Dumlupinar University, Faculty of Medicine, approved the study. We have selected our sample by random sampling; the subjects are selected randomly among the whole population. Sixty-five random people were assessed for eligibility, but eight of them were excluded (5 were not meeting the inclusion criteria because of their chronic illnesses, two were declined to participate, and one could not come to our institution for study on the days agreed for study period). Signed informed consent was obtained from all 57 healthy adult volunteers (Table 1). Study was conducted in Uşak University, Faculty of Medicine, Department of Emergency Medicine between 5 April 2018 and 15 April 2018. Participants were included in the study after 12 h fast. Volunteers were excluded if they were pregnant, experiencing any chronic diseases including any cardiac arrhythmias, receiving chronic drug therapy, or were <18 years old. All echocardiographic measurements made by an EP experienced in bedside ultrasound. The first measurements, including the vital signs, CO, and S’, were taken with the participants lying in a supine position and were performed in the morning after 12 h fast. Before taking first measurements, participants laid in supine position for 3 min. Participants were then asked to lie in a semirecumbent position for 3 min. Semirecumbent position was to induce gravitational effect to cause venous pooling in the lower limbs so as to augment the venous return on adoption of supine position followed by PLR. After 3 min, the head of the bed was lowered to a supine position and the participant’s leg was elevated to 45° through positioning of the bed. Secondary measurements were repeated in this position in 1 min. 13 , 14 Vital signs were monitored using the Mindray® monitor (Mindray Bio-medical Electronics Co., Shenzen, China) by a nurse who was blind to the study protocol. Ultrasonographic images were obtained by an EP who was experienced in bedside ultrasonography. The images were acquired using a commercially available Terason® Usmart 3200T-model portable ultrasound system (Teratech Corporation, the United States) and a 3.6 MHz frequency micro convex transducer. Aortic root measurements were recorded on the two-dimensional parasternal long-axis view at the end of systole (Figure 1). This was before an image of the aortic valve was obtained on the apical five-chamber view using pulse Doppler with 3-mm sampling (Figure 2). Spectral waveforms were displayed for at least three cycles to minimize the effect of respiration on measurements, and the average of the three measurements was recorded for each participant (in cm/s; Figure 2). Stroke volume (SV) was measured as aortic velocity-time integral (aVTI) × aortic root area. CO was estimated using SV × heart rate (HR). aVTI was calculated using pulse wave Doppler with a 3-mm sampling taken at the aortic out flow in the five-chamber view. The aortic root area was accepted as constant during the measurements and was measured only once for each participant. S’ measurements were measured at the apical four-chamber, and TDI velocities of the RV from the lateral annulus of the tricuspid valve were recorded in each position for every participant (Figure 3). The measurements of S’ and TDI velocities of the RV took less than 2 min in experienced hands.
Study flow diagram.
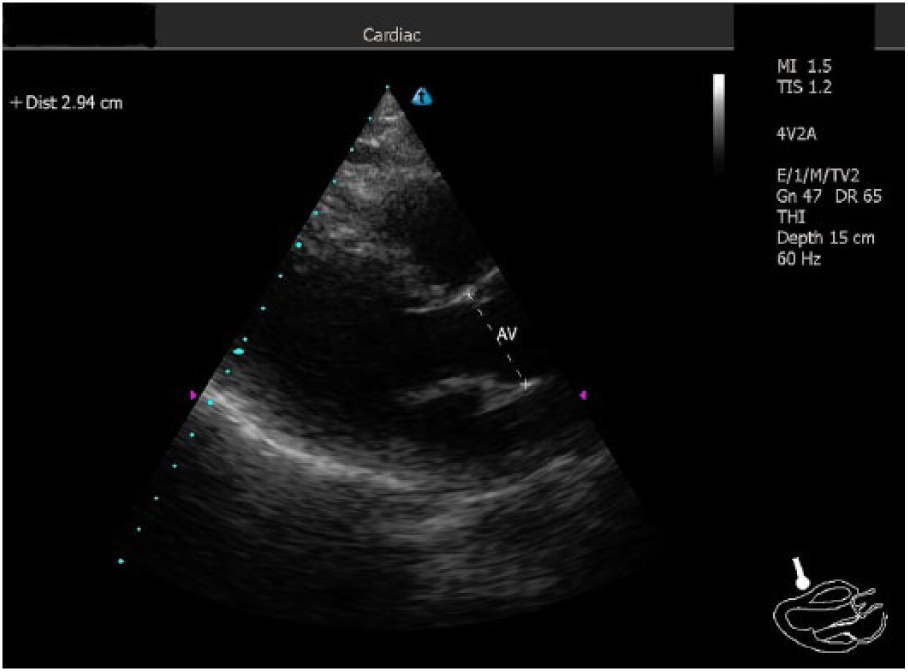
Visualization of the aortic root on the parasternal long-axis view at the end of systole.
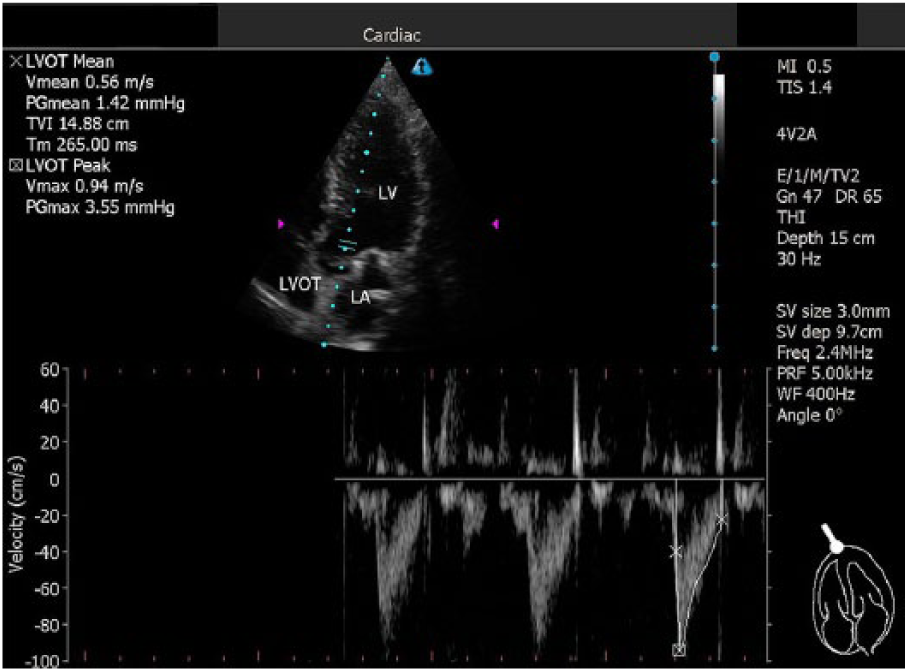
Image of the aortic valve obtained on the apical five-chamber view using pulse Doppler with 3-mm sampling.
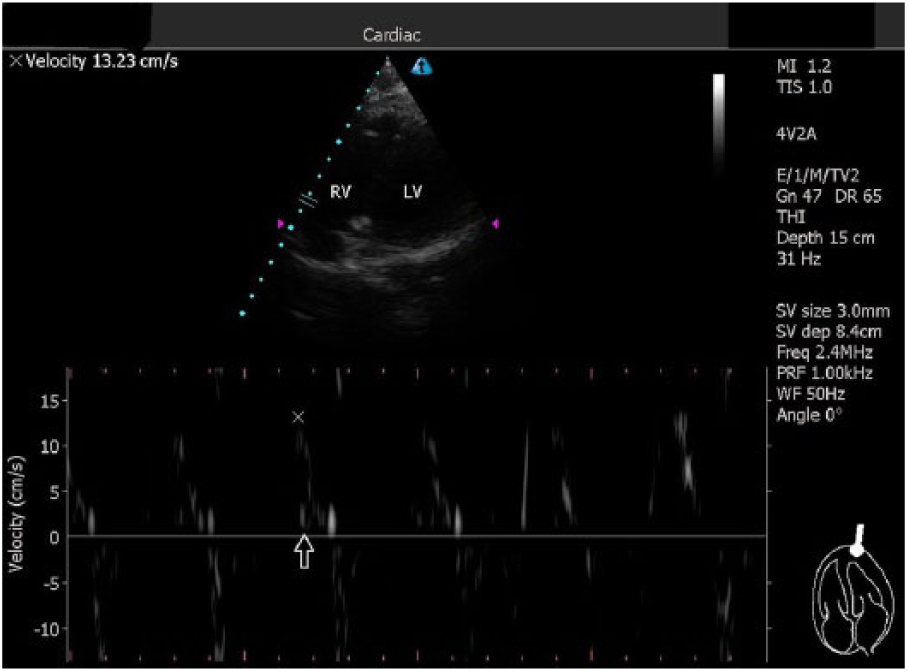
Measurement of tricuspid annulus velocity at the free wall obtained on the apical four-chamber view.
Statistical analysis
A preliminary analysis was performed before the study using data from nine volunteers. Normality analyses of continuous measurements were performed using Kolmogorov–Smirnov power analysis, Shapiro–Wilk tests, and Q–Q plots. Power analysis for a repeated measures analysis of variance (ANOVA) with two groups and two measurements was conducted in G-POWER® statistical software Version 3.1 (Universitat Düsseldorf, Germany) to determine a sufficient sample size using an alpha of .05, a power of 0.80, and a large effect size (f = 0.25). Based on these assumptions, the desired sample size was 28. A one-way repeated-measures ANOVA was used to determine the effect of PLR on the measurements, and post hoc analysis was performed using paired t tests to compare the differences between before and after values. The correlation between these measurements was calculated using Pearson’s correlation test. Continuous variables are reported as the means with standard errors and 95% confidence intervals (CIs). The maximum Type 1 error in this study was 0.05, and the level of significance was accepted as p < 0.05. MedCalc® (MedCalc Software bvba, Belgium) was used for statistical computing.
Results
During this study, 57 healthy volunteers were studied following 12°h fast. Their average age was 31.45 years, and 42 (73.6%) were male. A one-way repeated-measures ANOVA showed that there were significant differences in the effect of PLR on two of the measurements (post-PLR vs. pre-PLR values, F = 28.04, p < 0.001). The mean value of CO before PLR (CO-1) was 9.59 L/min (95% CI = [8.68, 10.50]); however, this increased to 11.44 L/min (95% CI = [10.42, 12.47]) after PLR (CO-2). The mean value of S’ before PLR (S’-1) was 11.57 cm/s (95% CI = [11.17, 11.97]); however, this increased to 13.72 cm/s (95% CI = [13.37, 14.08]) after PLR (S’-2). The average increases were 16.17% for CO and 15.67% for S’ (Table 2). Post hoc analysis illustrated that the differences between CO-2 and CO-1 (mean difference = 1.852, SE = 0.188, n = 57) and S’-2 and S’-1 (mean difference = 2.154, SE = 0.185, n = 57) were statistically significant (Table 2).
The mean values and mean difference between CO and systolic velocity before and after passive leg raising.
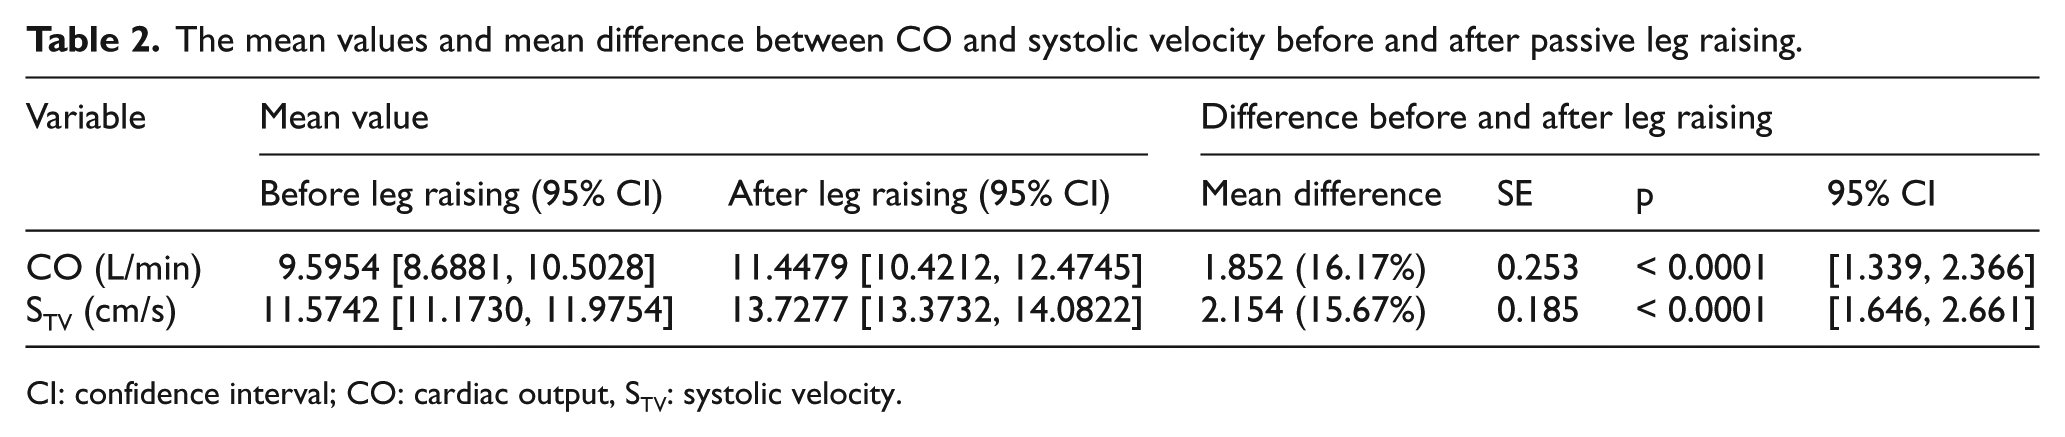
CI: confidence interval; CO: cardiac output, STV: systolic velocity.
All paired comparisons of vital signs (pre-PLR and post-PLR values) were statistically insignificant. Pulse rate, respiratory rate, oxygen saturation, and mean arterial blood pressure values pre-PLR, 83.85 (95% CI = [80.96, 86.75]), 18.89 (95% CI = [17.98, 19.80]), 97.19 (95% CI = [96.71, 97.67]), and 87.91 (95% CI = [85.38, 90.43]), respectively, and post-PLR, 83.92 (95% CI = [80.98, 86.87]), 19.31 (95% CI = [18.31, 20.31]), 97.31 (95% CI = [96.88, 97.74]), and 86.78 (95% CI = [84.24, 89.32]), respectively, were statistically insignificant when compared with paired t tests (Table 3).
Differences in vital signs before and after leg raising.
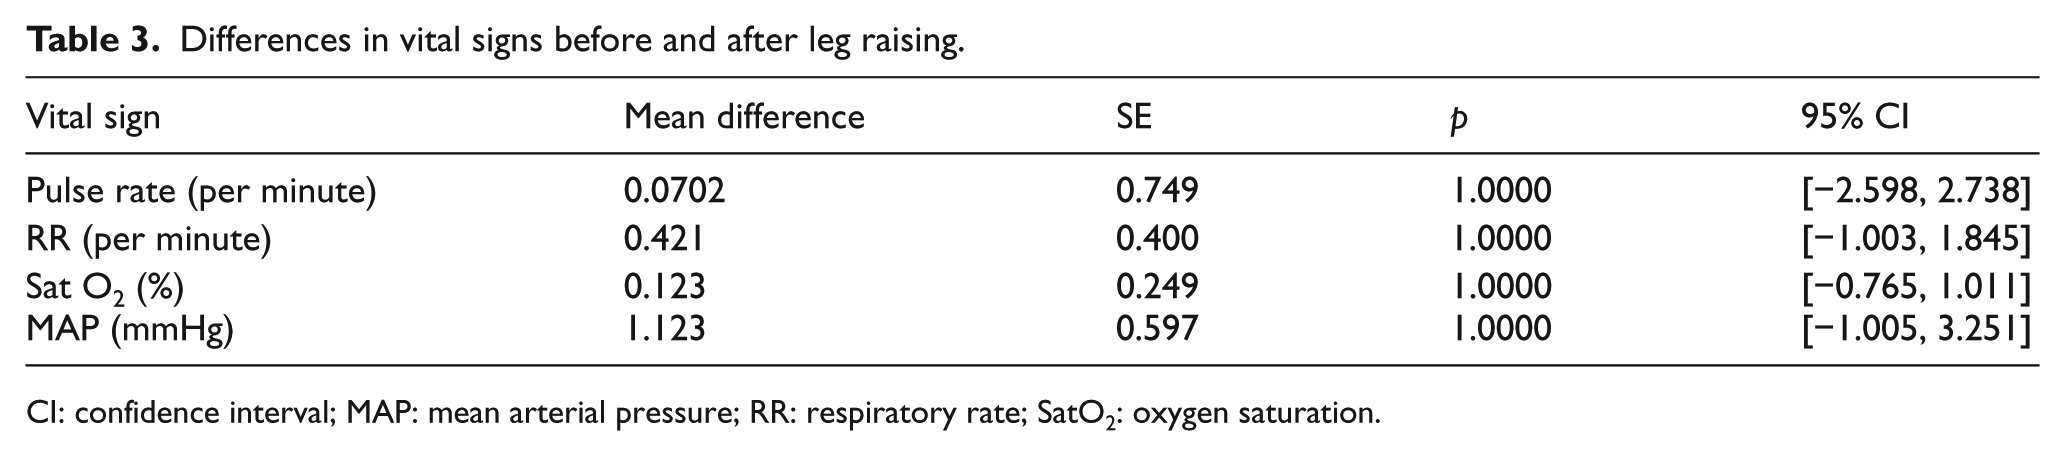
CI: confidence interval; MAP: mean arterial pressure; RR: respiratory rate; SatO2: oxygen saturation.
Discussion
Echocardiography is the most commonly used noninvasive tool for assessing the hemodynamic status of hypotensive patients in EDs. It leads the physician in clinical handling and in making vital decisions such as the control of initial fluid therapy. 15 As volume expansion does not always improve the hemodynamic status, predictive parameters of fluid responsiveness are of great importance.
Dynamic echocardiographic parameters, especially CO variation due to volume infusion or volume shift after PLR, are excellent predictors of volume responsiveness.14,16–19 CO is the amount of blood pumped by the heart per minute and is dependent on the heart rate, myocardial contractility, preload, and afterload. In healthy individuals, the right and left ventricles pump the same volume of blood, therefore, measurements of left and right ventricular CO are equal. 16 , 17 , 20
PLR returns 150 to 200 mL of venous blood from the lower extremities to the central circulation and increases the right ventricular preload. 14 , 21 In a study of hemodynamically unstable patients, Maizel et al. 17 identified a 12% increase in SV after PLR (sensitivity = 69%; specificity = 89%) in response to giving 500 mL of crystalloid infusion. In a study of 89 intermediate care unit patients, Thiel et al. 14 evaluated the change in SV during PLR and compared it with the change in SV after volume infusion. The authors observed that PLR increased SV by 15% and had positive and negative predictive values of 85% and 91%, respectively, with a sensitivity of 81% and specificity of 93% for volume responsiveness. In a prospective observational study in 51 postoperative spontaneously breathing patients, El Hadouti et al. 19 identified an increase in CO of 11% after PLR that predicted a volume response with 68% sensitivity and 100% specificity. Significant results were also obtained in the study reported here, whereby PLR increased the CO in 57 healthy adults by an average of 16.17% (mean = 1.852 mL/min, SE = 2.366–1.339, p < 0.0001).
Another echocardiographic parameter used to estimate the volume status is S’ using TDI. Not only is this an easy-to-determinate parameter, but also one that is effective and reproducible for assessing systolic right ventricular function. 22 , 23 The standard value for S’ is > 10 cm/s. 22 , 23 Wahl et al. compared the routine assessment of S’ using pulsed-wave TDI with cardiac magnetic resonance as a reference method in 254 individuals and observed a linear correlation between right ventricular ejection fraction (RVEF) and S’. Wahl et al. 24 identified an S’ cutoff value of 12 cm/s for patients with normal ejection fraction (EF; > 50%) with 81% sensitivity and 68% specificity, and a threshold of S’ < 9 cm/s for patients with severely reduced RVEF (< 30%) with 82% sensitivity and 86% specificity. Further studies with invasive hemodynamic measurements could also prove that the tricuspid annulus tissue Doppler strongly correlates with RV contractility. 21 , 25
Changes in cardiac contractility, as provoked by increasing preload after PLR, should cause increasing tissue Doppler measurement values; however, data regarding the relationship between volume expansion and peak systolic myocardial velocity derived from the lateral tricuspid annulus are rare. This study examined the changes in S’ after PLR and detected a significant increase from the baseline with a mean of 2.154 cm/s (15.67%, SE = 1.656–2.661, p < 0.0001).
The results of this study clearly demonstrate the effects of PLR on CO and S’ in healthy volunteers and suggest that this technique is a valuable test for identifying volume responsiveness in hypotensive adults. The echocardiographic assessment of CO requires at least two views from different image planes with a corresponding calculation, which may cost precious time in the treatment of unstable patients. Potential heart rate variation in the meantime may also affect the method. As the situation in an ED requires immediate action and valid results, the S’ method is preferred.
How far other mechanisms, such as baroreflex activation, stimulation of the cardiopulmonary reflex, and sympathetic activation due to PLR, can contribute to the hemodynamic effects is disputed; however, this study found no statistical difference between the vital signs before and after PLR. 26 Furthermore, confounding factors such as pain, coughing, or discomfort may provoke adrenergic stimulation and result in misinterpretation of the CO change, 18 therefore, the precise performance of PLR is indispensable.
Limitations
The first limitation of this study is its small sample size. Although the power analysis predicted a sample size of 28 and the study was conducted with 57 volunteers, a greater sample size would help strengthen the results. The study population also only consisted of healthy volunteers; however, it should be noted that hypotensive patients in an ED frequently present with complex clinical findings (i.e. heart failure or heart valve disease). These additional clinical findings have severe hemodynamic effects on different pathological mechanisms and physiological responses (i.e. baroreflex or sympathetic activation) and may limit the application of the test on these patients. This should be the subject of further analyses.
The second limitation is, our findings in this study are not tested in the really sick and hypotensive patients to assess the validity and reliability. This issue can be a topic for a further study.
The third limitation is that, all the measurements are made by one EP who is experienced in bedside ultrasound. Measuring the CO and S’ require expertise of bedside point-of-care ultrasound. It may be not easy for the general EP to acquire the required bedside ultrasound skills. We cannot comment about interrater variability because we had one operator made all the measurements but, interrater variance can be high because these measurements are operator-dependant. There is no standard way to determine the qualification of an EP to make these measurements too.
Conclusion
Despite its limitations, this study has demonstrated the concordance of rise in CO with S’ change by PLR in healthy subjects. Further studies are needed to validate the use of S’ values in critically ill subjects.
Footnotes
Author contributions
EEÜ, AK, and SB researched literature and conceived the study. EEÜ, SÇ, and HB were involved in protocol development, gaining ethical approval, patient recruitment, and data analysis. EEÜ and AK wrote the first draft of the article. All authors reviewed and edited the article and approved the final version.
Declaration of conflicting interests
The author(s) declared no potential conflicts of interest with respect to the research, authorship, and/or publication of this article.
Funding
The author(s) received no financial support for the research, authorship, and/or publication of this article.
Availability of data and materials
The data sets generated and/or analyzed during the current study are available from Erden Erol Ünlüer, MD, Professor.
Ethical approval
This study has approval from Kütahya Dumlupınar University Medical Faculty Ethics Committee (approval date and number: 19 July 2017, 2017-9/3).
Human rights
The study protocol conforms to the ethical guidelines of the 1975 Declaration of Helsinki.
Informed consent
Written informed consent was obtained from each patient included in the study.