
Abstract
Background:
In 2016, the Sepsis-3 Task Force introduced a simpler algorithm, named quick sepsis-related organ failure assessment, for patients in a non-intensive care unit setting.
Objectives:
The study was designed to investigate the predictive performance of quick sepsis-related organ failure assessment for intensive care unit admission using the area under the curve of receiver operating characteristic specifically in patients of clinically diagnosed urinary tract infection in the emergency department and to compare its performance with that of systemic inflammatory response syndrome and sequential (sepsis-related) organ failure assessment.
Methods:
Retrospective analyses on adult urinary tract infection patients presenting to the emergency department between June 2015 and May 2016 were undertaken. We compared patients who were admitted to the intensive care unit to those who were not.
Results:
Of the total 220 urinary tract infection patients, 20 (9.1%) were hospitalized to the intensive care unit and there was no in-hospital mortality. Independent predictors for intensive care unit admission using multiple logistic regression were HCO3− and creatinine. The area under the curve of receiver operating characteristic values of systemic inflammatory response syndrome, quick sepsis-related organ failure assessment, and sequential (sepsis-related) organ failure assessment were 0.759, 0.752, and 0.824 on intensive care unit admission, respectively, and there was no significant difference between any of them. Interestingly, adding HCO3− to quick sepsis-related organ failure assessment improved the predictive performance compared to quick sepsis-related organ failure assessment alone (AUC: 0.844 vs 0.752, respectively; p < 0.05), and a cut-off value of 20 mmol/L for HCO3− yielded the largest area under the curve of receiver operating characteristic value. Moreover, when lowering the cut-off value of quick sepsis-related organ failure assessment to 1 and combining to HCO3−, its sensitivity was increased from 22% to 90%.
Conclusion:
Among patients presenting to the emergency department with clinically diagnosed urinary tract infection, the use of a new model, which is adding HCO3− to quick sepsis-related organ failure assessment with a lowered cut-off value of 1, resulted in greater predictive performance regarding intensive care unit admission than original quick sepsis-related organ failure assessment.
Keywords
Introduction
The identification of patients with possible sepsis in the emergency department (ED) is vitally important because timely recognition and the corresponding treatment improve survival. No accurate diagnostic tests are currently available to identify patients with sepsis or those at a high risk of developing sepsis. However, clinical judgment to identify sepsis could be potentially supported by validated criteria.
In 2016, sepsis was redefined as a life-threatening organ dysfunction caused by a dysregulated host response to infection. 1 Organ dysfunction was characterized by the acute increase of at least two points in the sequential (sepsis-related) organ failure assessment (SOFA) score. Given that SOFA requires laboratory results which are not routinely measured outside the intensive care unit (ICU), the Sepsis-3 Task Force introduced a simpler algorithm, named quick sepsis-related organ failure assessment (qSOFA), for patients in a non-ICU setting. Sepsis-3 specifically promotes the use of SOFA in ICU patients versus qSOFA in non-ICU patient including ED patients.
There have been studies for evaluating the validity of qSOFA in non-ICU patients. Above all, Seymour et al. 2 evaluated encounters with suspected infection outside of the ICU and concluded that the predictive validity for in-hospital mortality of qSOFA was statistically greater than those of SOFA and systemic inflammatory response syndrome (SIRS). Freund et al. 3 also examined patients presenting to the ED with suspected infection and found that qSOFA resulted in greater prognostic accuracy for in-hospital mortality than did SIRS. Even, there was a study with patients of pneumonia in the ED by Chen et al., 4 which showed that qSOFA is better than CRB-65 for identification of a high risk of mortality and requirement of ICU.
However, there have been no studies to validate qSOFA for identifying sepsis, specifically in patients with urinary tract infection (UTI). This study was designed to investigate the predictive performance of qSOFA, SIRS, and SOFA regarding ICU admission in patients with clinically diagnosed UTI in the ED.
Material and methods
Study design
This study was a single-center, retrospective analysis of patients with clinically diagnosed UTI at the ED from June 2015 to May 2016. It was conducted in a university hospital in Korea which is a tertiary hospital with 60,000 patients according to an annual census of ED visits. The decision to admit a patient to the ICU was made by the treating emergency physician on the basis of the patient’s overall clinical status.
Study population
Cases were identified by a search for the diagnosis of UTI in the electronic medical record database of the patients visiting the ED between June 2015 and May 2016. Then, two emergency medicine doctors did a manual chart review, and it was confirmed by a doctor of infectious diseases. Adult patients (age ≥ 18 years) with clinically diagnosed UTI at the ED were enrolled. The criteria of clinically diagnosed UTI were based on two or more symptoms and signs plus one or more of positive work-up results. Symptoms and signs consistent with UTI included fever (≥38°C), urinary symptoms (dysuria, frequency, nocturia, sensing of residual urine), or tenderness of costovertebral angle on physical exam. Positive work-up results included pyuria (positive leukocyte esterase on dipstick analysis or ≥5 WBC/high-power field with standardized microscopy) or bacteriuria (bacterial growth of ≥100,000 colony forming units/mL) from either catheterized urine specimen or voided midstream sample, or radiographic evidence of pyelonephritis. The exclusion criteria were as follows: age younger than 18 years, pregnant women, patients who had been transferred from another hospital and if they were transferred to another hospital, patients who were in a state of arrest at ED arrival, patients with the order of do not resuscitate, and those admitted for palliative therapies.
Data collection and outcomes
Data on demographic characteristics, comorbidities, vital signs, results of laboratory tests including cultures of urine and blood, ICU admission, and in-hospital mortality of enrolled patients were recorded. The initial vital signs at triage upon ED arrival were used to calculate the qSOFA and SIRS criteria. The enrolled patients were followed up until discharge.
Statistical analyses
Data with a normal distribution were expressed as mean ± standard deviation and were analyzed by independent samples t test. Data with a skewed distribution were expressed as medians and quartiles and were analyzed by Mann–Whitney U test. Categorical variables were compared using χ2 test or Fisher’s exact test depending on the sample size. We compared patients who were admitted to the ICU to those who were not, and all variables with statistical difference were analyzed by a multiple logistic regression to determine the independent predictors of outcome. Receiver operating characteristic (ROC) curves were constructed, and the area under the curve (AUC) was calculated to assess predictive values of three scoring systems (SIRS, qSOFA, and SOFA) for the primary and secondary outcomes. Also, we constructed ROC curves of the independent predictors with and without qSOFA for the outcomes. Finally, we compared the sensitivity and specificity of each model. All statistical analyses were performed using SPSS software version 16.0 (SPSS, Inc., Chicago, IL, USA) and MedCalc for Windows, version 17.6 (MedCalc software, Ostend, Belgium).
Results
Baseline characteristics
A total of 220 patients with clinically diagnosed UTI at the ED were enrolled in this study, and their baseline characteristics are listed in Table 1. There was no in-hospital mortality. Out of 220 patients, 20 (9.1%) were admitted to the ICU, while the remaining (90.9%) were hospitalized in the wards or discharged from the ED with oral antibiotics. In total, 23 patients out of 220 presented shock (systolic blood pressure (SBP) lower than 90 mmHg or diastolic blood pressure (DBP) lower than 60 mmHg) during their ED stay. Blood pressures were restored by hydration with crystalloid solution in 5 of them, yet 18 patients needed infusion of vasopressor and admitted to the ICU. There were no cases who needed mechanical ventilation or renal replacement therapy.
Baseline characteristics of the study cohort and comparison between the ICU admission and non-ICU admission groups.
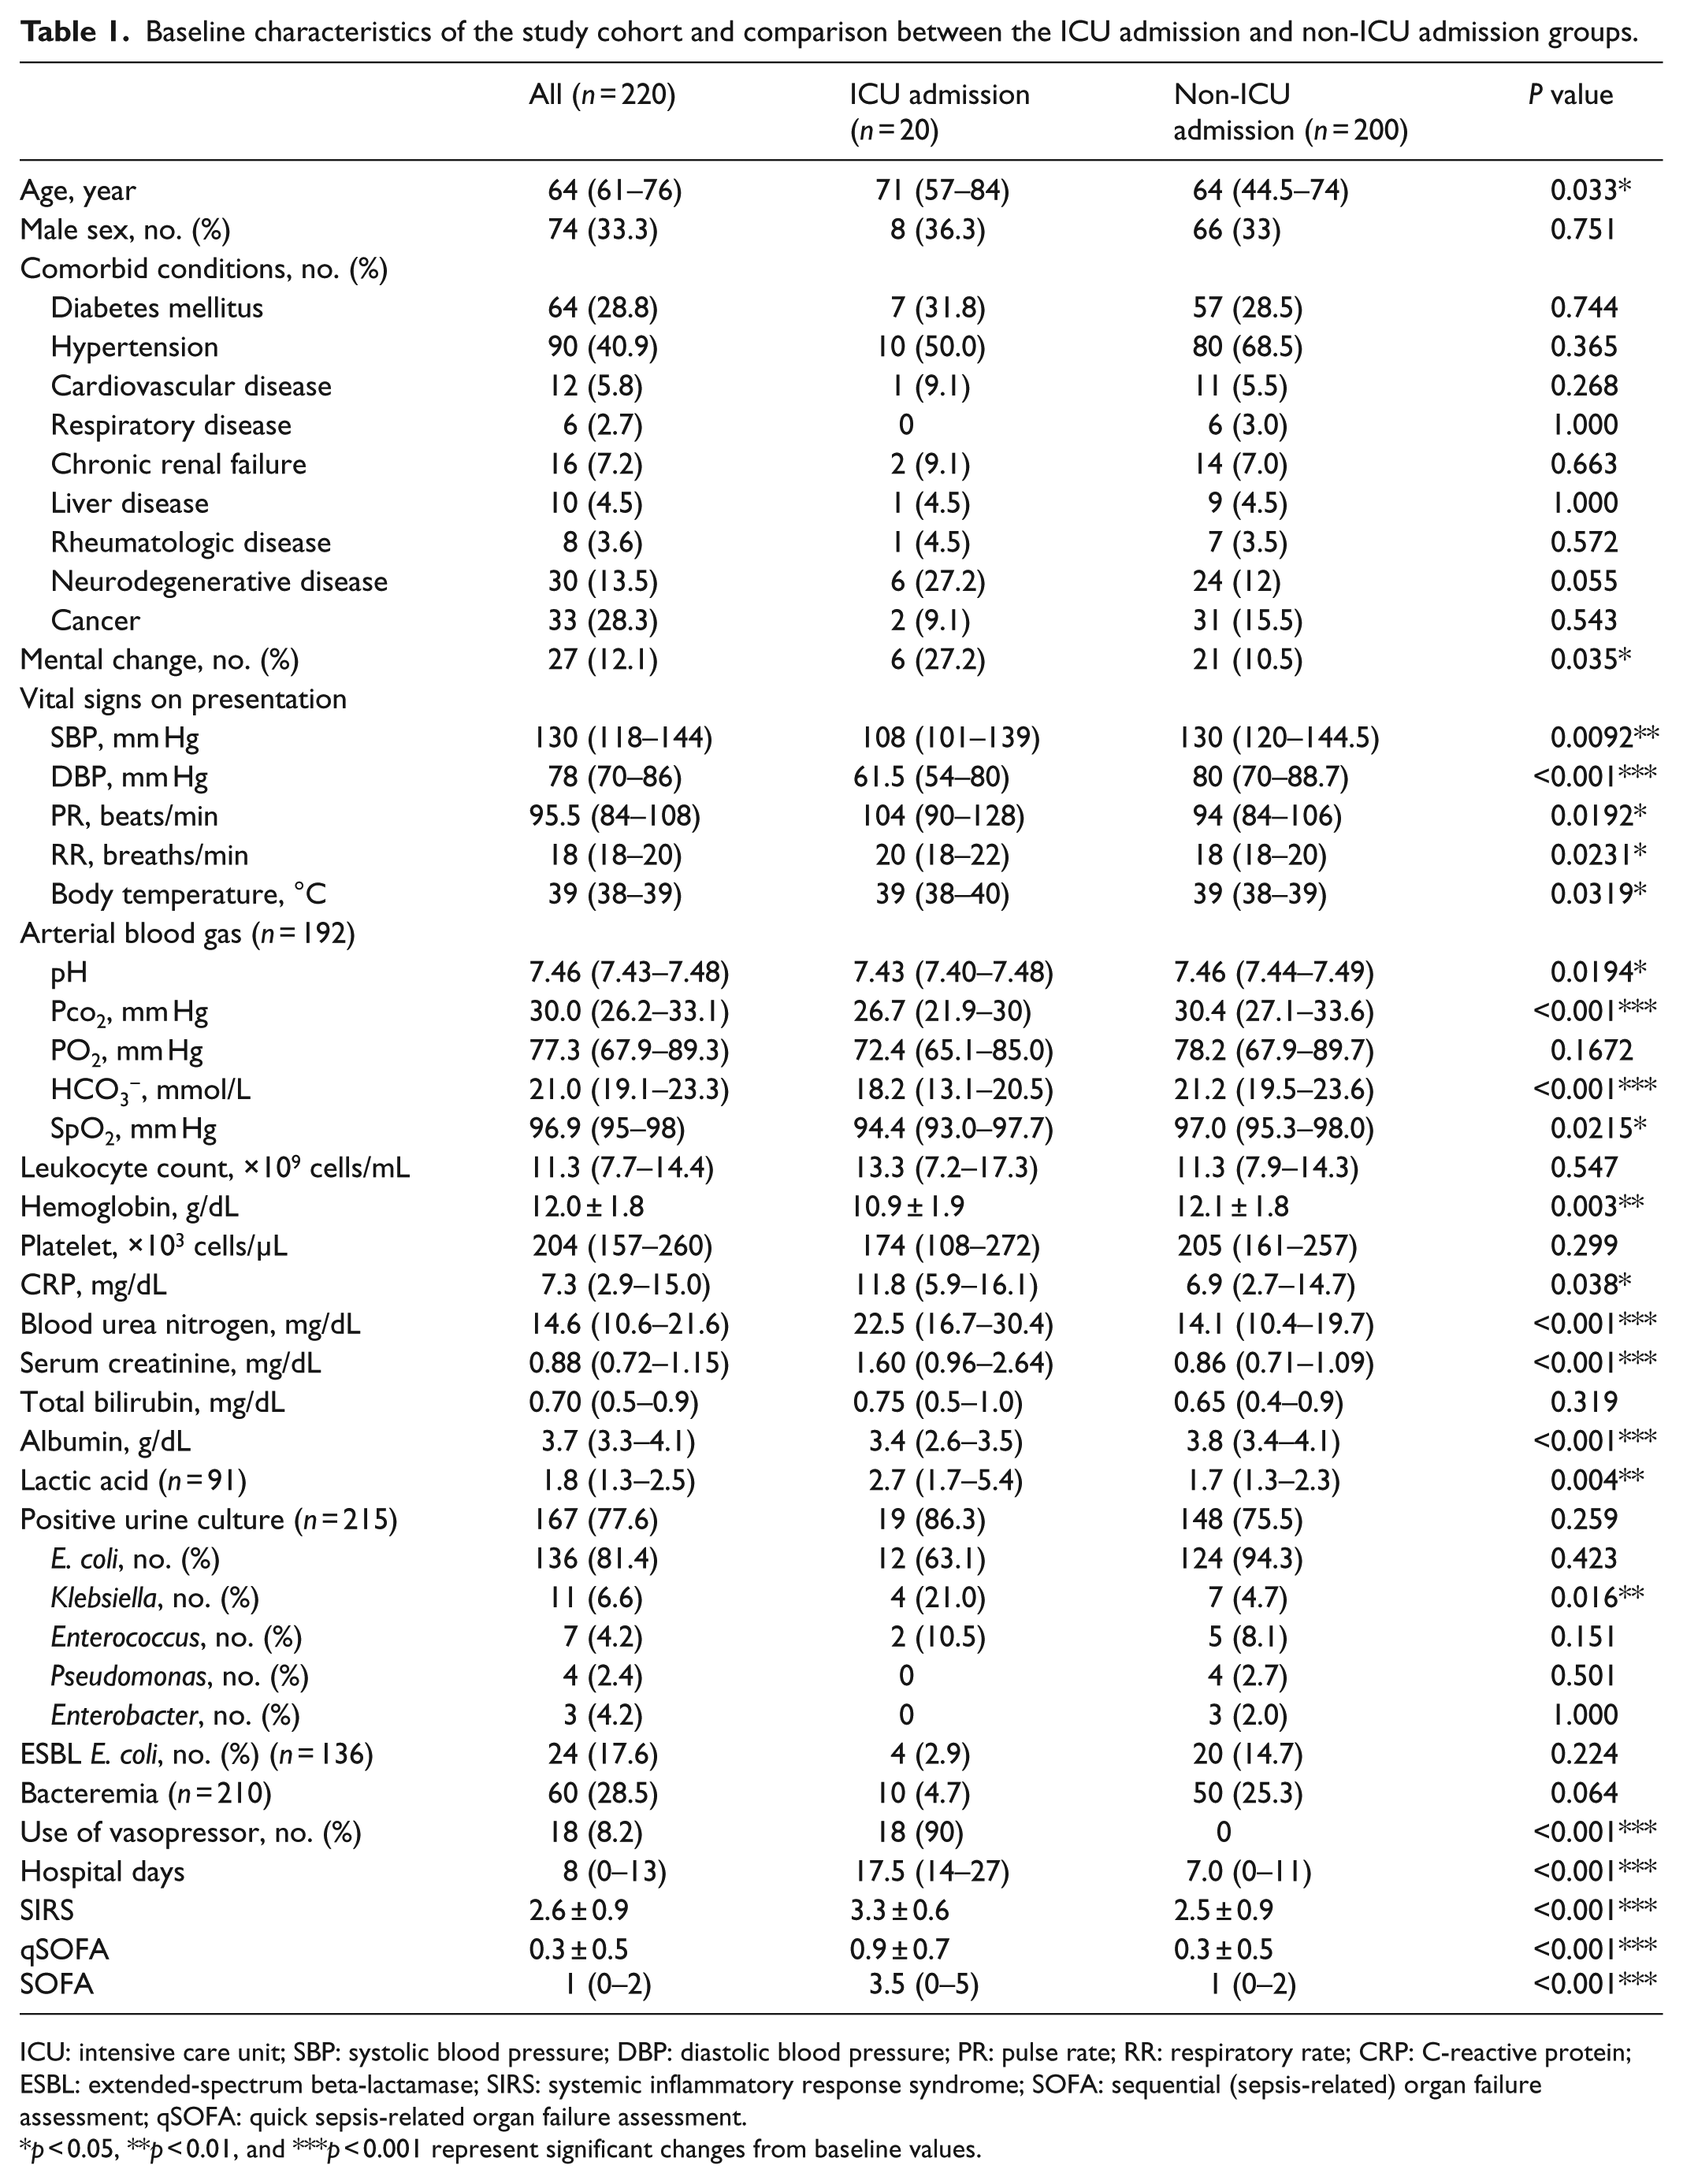
ICU: intensive care unit; SBP: systolic blood pressure; DBP: diastolic blood pressure; PR: pulse rate; RR: respiratory rate; CRP: C-reactive protein; ESBL: extended-spectrum beta-lactamase; SIRS: systemic inflammatory response syndrome; SOFA: sequential (sepsis-related) organ failure assessment; qSOFA: quick sepsis-related organ failure assessment.
p < 0.05, **p < 0.01, and ***p < 0.001 represent significant changes from baseline values.
Results of urine culture were available in 215 patients and revealed positive in 77.6% (167/215). E. coli was most commonly grown (81.4%, 136/167) and 17.6% of them (24/136) were extended-spectrum beta-lactamase (ESBL)-producing bacteria. Results of blood culture were available in 210 patients, yet bacteremia was disclosed in 28.5% (60/210). The mean scores of SIRS and qSOFA were 2.6 ± 0.9 and 0.3 ± 0.5, respectively, and the median SOFA score of the entire cohort was 1 (0–2). The qSOFA score was 2 or higher in 10 patients (4.5%), SOFA was 2 or higher in 100 patients (45%), and SIRS was 2 or higher in 193 patients (87%).
Comparison of patients regarding ICU admission
Table 1 also shows the comparison of patients who were admitted to the ICU and those who were not. There were no significant differences found in gender or comorbidities between patients who were admitted to the ICU and those who were not, but the mean age was higher in the patients admitted to the ICU (71 vs 64 years; p < 0.05). Mental change at ED arrival was observed more frequently in the ICU admission group as well (27.2% vs 10.5%; p < 0.05). As for initial vital signs, blood pressures were lower in the group of ICU admission compared to the non-ICU admission group, yet pulse rate (PR), respiratory rate (RR), and body temperature (BT) were higher. On arterial blood gas analysis, the ICU admission group showed lower levels of pH, Pco2, HCO3−, and SpO2. Laboratory results revealed higher levels of C-reactive protein (CRP), blood urea nitrogen (BUN), creatinine, and lactic acid in the ICU admission group, but lower levels of hemoglobin and albumin. Regarding urine culture, Klebsiella was more commonly found in the ICU group than in the non-ICU admission group (p < 0.05). Use of vasopressor was more frequently observed in the ICU group, and the mean duration of hospitalization was 25.9 days for the ICU group and 8.8 days for the non-ICU group (p < 0.001). The average values of SIRS, qSOFA, and SOFA scores were statistically higher in patients admitted to the ICU than those in the non-ICU admission group (p < 0.001)
Independent predictors of ICU admission
Although several variables including age, PR, BT, hemoglobin, and CRP were significantly different between the patients who were admitted to the ICU and those who were not, the only independent predictors of ICU admission were HCO3−, creatinine, and albumin when analyzed by multiple logistic regression (Table 2).
Multiple logistic regression analysis of the baseline risk variables.
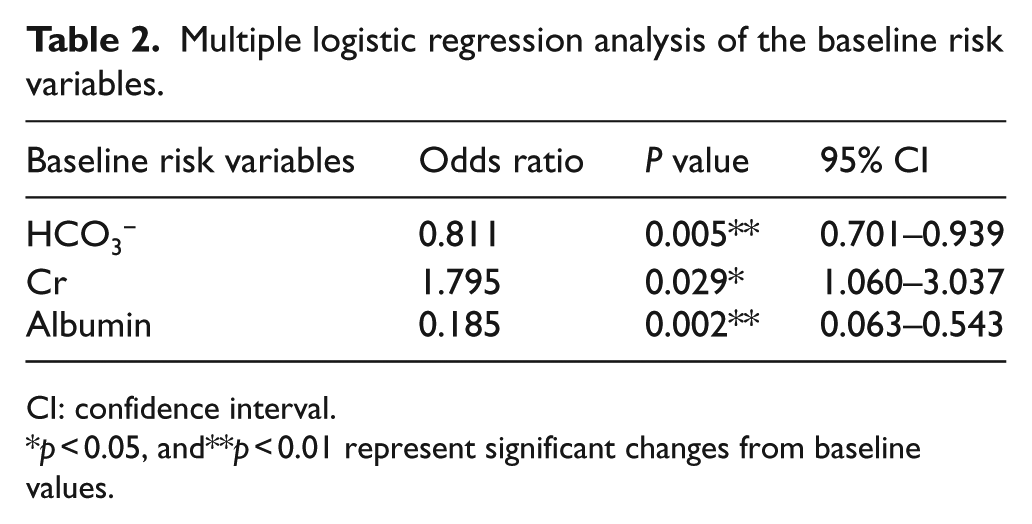
CI: confidence interval.
p < 0.05, and**p < 0.01 represent significant changes from baseline values.
Predictive performance of scoring systems
The ROC curves for the three scoring systems in predicting ICU admission are shown in Figure 1. The AUCs of SIRS, qSOFA, and SOFA were 0.759, 0.752, and 0.824, respectively. There was no statistically significant difference between any of them.
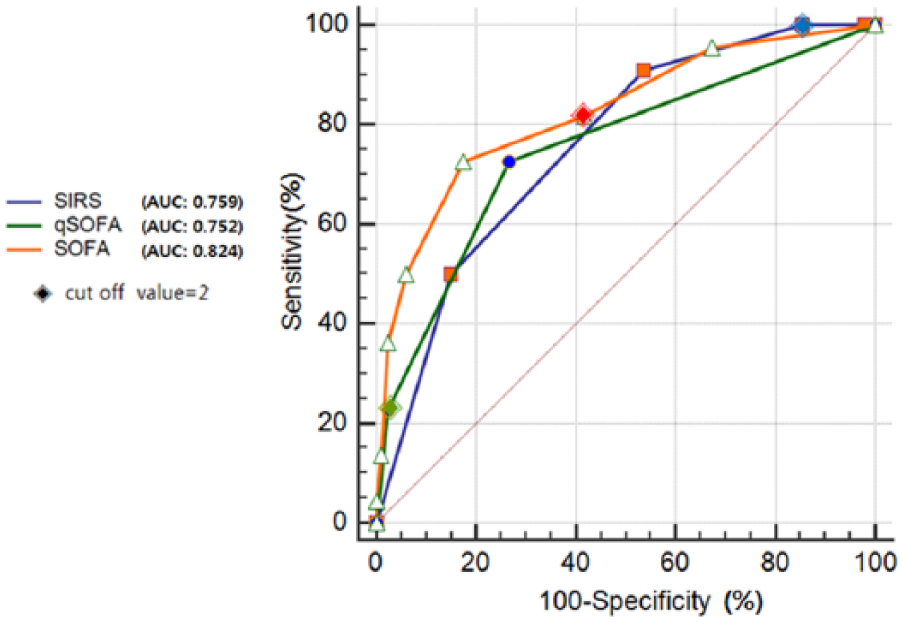
Comparison of ROC curves between SIRS, qSOFA, and SOFA.
Effect of HCO3− on the predictive performance of qSOFA
Adding HCO3−, which was found to be an independent predictor using multiple logistic regression to qSOFA (qSOFA + HCO3−), improved the predictive performance regarding ICU admission (AUC, 0.844; 95% confidence interval (CI), 0.784–0.892; Figure 2). The increment of AUC of this new model was 0.092 compared to AUC of qSOFA alone and showed significant difference (p < 0.05). The cut-off value of HCO3− yielding the largest area under the curve of receiver operating characteristic (AUROC) value was 20 mmol/L.
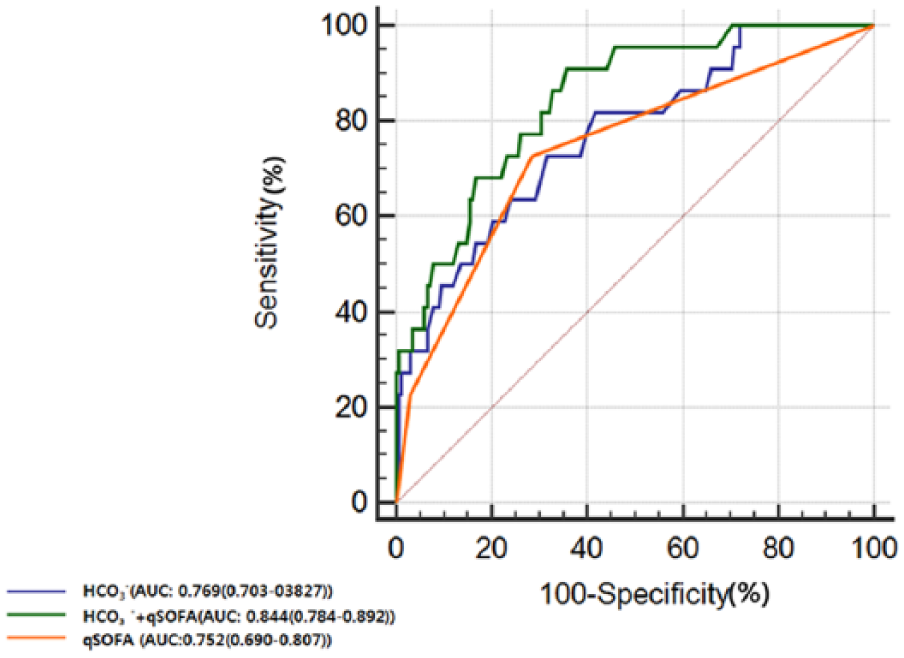
Comparison of ROC curves between qSOFA and qSOFA with HCO3−.
Prognostic performance of qSOFA at different cut-off points with or without HCO3−
Sensitivity and specificity of qSOFA at different cut-off points are summarized in Table 3. A qSOFA score greater than or equal to two (cut-off value = 2) had 22% sensitivity and 97% specificity for ICU admission compared to 72% sensitivity and 73% specificity for qSOFA greater than or equal to one (cut-off value = 1). When HCO3− was added to qSOFA of cut-off value 1, its sensitivity and specificity to predict ICU admission were 90% and 64%, respectively.
Prognostic performance of qSOFA at different cut-off points without or with HCO3− for prediction of ICU admission.
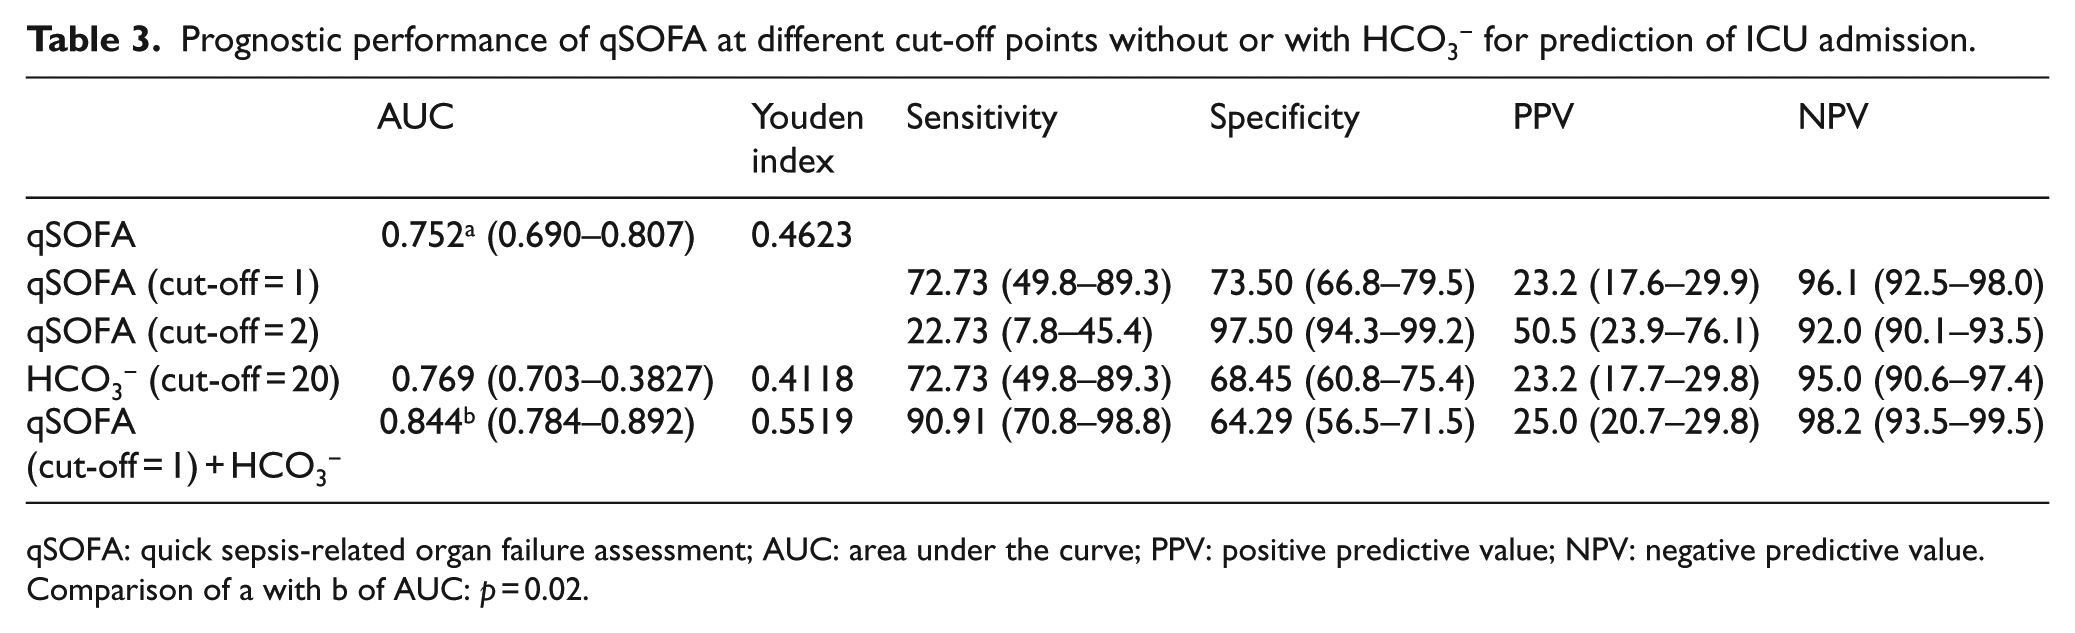
qSOFA: quick sepsis-related organ failure assessment; AUC: area under the curve; PPV: positive predictive value; NPV: negative predictive value.
Comparison of a with b of AUC: p = 0.02.
Discussion
The qSOFA score included a systolic BP of ≤100 mmHg, RR of ≥22/min, and altered mental status. 1 One point was awarded for each of the above conditions and the score ranged from 0 to 3. Clinically, high RR related to infection is observed in the cases as follows: decreased effective lung volume by pneumonic infiltration or parapneumonic effusion, pulmonary congestion due to increased vascular permeability or decreased cardiac function, and metabolic acidosis compensating by respiratory alkalosis. Therefore, patients with pneumonia are likely to have higher RR and subsequently higher qSOFA scores than other infections. Higher RR is commonly accompanied by higher rates of ICU admission for close monitoring, application of invasive mechanical ventilation, and accordingly development of ventilator-associated pneumonia and higher mortality. On the contrary, high RR in patients with UTI is less frequently observed, and thus the qSOFA point as for RR is hardly awarded in UTI compared to pneumonia.
Accordingly, there is a chance that qSOFA score could be overestimated in general as if it had a higher sensitivity and better predictive performance than it really does because the respiratory tract is the most common site of sepsis.5,6 In fact, respiratory tract infection accounted for 52% and 80%, respectively, in two single-center retrospective studies.7,8 There was also an international prospective study by Freund et al. 3 and 42% of the included patients had pneumonia. Moreover, in this large-scale study, they collected the worst value of qSOFA criteria during the ED stay of the patient, which could have biased the results to an even higher qSOFA score.
Meanwhile, our study investigated the predictive performance of the scoring systems with patients of clinically diagnosed UTI in the ED, and the assessment for scoring was strictly done upon the ED arrival. Considering urosepsis has a lower mortality compared with that of sepsis in general, 9 and we used ICU admission as a prognostic predictor in the ED. Our results showed that there was no significant difference in the predictive performance for ICU admission between the scoring systems. Given that the qSOFA score was 2 or higher only in 10 patients (4.5%) and a low sensitivity of 22% of qSOFA, we adjusted the cut-off value of qSOFA into 1 and combined it with HCO3−, which disclosed the independent predictors of ICU admission by multiple logistic regression. Because only HCO3− is promptly reported in the ED using a blood gas analyzer, we did not include albumin and creatinine which were revealed to be independent predictors as well to maintain the advantages of bedside availability of qSOFA. This new model showed a significant improvement in predictive performance compared to qSOFA with a cut-off value of 2 (p < 0.05). It also disclosed considerable prognostic performance with a sensitivity of 90% and a specificity of 64%.
Recently, there was a prospective study about acid–base abnormalities in infants with acute pyelonephritis, and hypobicarbonatemia was found in 18 out of 80 patients. 10 Nonetheless, the causal relation between HCO3− and UTI has not been clarified. Abraham et al. 11 reported that transient pseudohypoaldosteronism (type 4 renal tubular acidosis) may develop secondary to UTI. Meanwhile, Hains et al. 12 found that carbonic anhydrase 2 deficiency leads to increased pyelonephritis susceptibility. Given that the acid–base balance is maintained by excretion of acid by the kidneys which affects the plasma HCO3− concentration, we assume that UTI may interfere with the normal physiologic process resulting in low levels of HCO3−, yet further studies are needed.
The first limitation of our study is that we conducted a single-center study. Hospitalization and decision made regarding ICU admission were based on institutional or departmental guidelines. However, out of 20 patients admitted to the ICU in our study, 18 patients needed vasopressor infusion due to sustained shock in the ED. Other two patients were admitted to the ICU for close monitoring on the possibility of renal replacement therapy. Therefore, we believe that objectivity was retained in the decision regarding ICU admission in this study. Another limitation lies in its retrospective design. Although blood lactate was known to be associated with severe outcome in patients with sepsis, 13 we did not analyze serum lactate levels by multiple logistic regression because of missing data.
Conclusion
We all agree on the fundamental importance of identifying sepsis early and of applying appropriate treatment immediately in the ED. It has been stressed that low sensitivity of qSOFA may lead to a delay in the identification of sepsis and may limit utility as a screening tool.14,15 In our study, by lowering the cut-off value of qSOFA to 1 and combining it with HCO3−, we improved not only sensitivity but also the discriminatory capacity for ICU admission of UTI patients presenting to the ED. To the best of our knowledge, our study is the first to investigate the predictive accuracy of qSOFA, SIRS, and SOFA specifically in UTI patients presented to the ED. Our study could help clinicians gain further insight into the usefulness of qSOFA by pointing out the possibility of overestimation of qSOFA in the previous studies and suggesting the new model of adding HCO3− to qSOFA with a cut-off value of 1, yet it should be validated with multicenter prospective studies.
Footnotes
Acknowledgements
A.K. and S.K. reviewed and analyzed the patient data. Y.J.S. helped with the statistical analysis. A.D. was a major contributor in writing the manuscript. All authors read and approved the final manuscript.
Declaration of conflicting interests
The author(s) declared no potential conflicts of interest with respect to the research, authorship, and/or publication of this article.
Funding
This work was supported by INHA UNIVERSITY HOSPITAL Research Grant.
Availability of data and materials
The datasets used during the current study are available from the corresponding author.
Informed consent
Informed consent was waived.
Ethical approval
This study was approved by the Institutional Review Board of Inha University Hospital, Incheon, Korea (IRB no. 2017-10-013).