
Abstract
Introduction:
To determine the association between both abnormal individual vital signs and abnormal vital sign groups in the emergency department, and undesirable patient outcomes: hospital admission, medical emergency team calls and death.
Method:
We undertook a prospective cohort study in a tertiary referral emergency department (February–May 2015). Vital signs were collected prospectively in the emergency department and undesirable outcomes from the medical records. The primary outcomes were undesirable outcomes for individual vital signs (multivariate logistic regression) and vital sign groups (univariate analyses).
Results:
Data from 1438 patients were analysed. Admission was associated with tachycardia, tachypnoea, fever, ≥1 abnormal vital sign on admission to the emergency department, ≥1 abnormal vital sign at any time in the emergency department, a persistently abnormal vital sign, and vital signs consistent with both sepsis (tachycardia/hypotension/abnormal temperature) and pneumonia (tachypnoea/fever) (p < 0.05). Medical emergency team calls were associated with tachycardia, tachypnoea, ≥1 abnormal vital sign on admission (odds ratio: 2.3, 95% confidence interval: 1.4–3.8), ≥2 abnormal vital signs at any time (odds ratio: 2.4, 95% confidence interval: 1.2–4.7), and a persistently abnormal vital sign (odds ratio: 2.7, 95% confidence interval: 1.6–4.6). Death was associated with Glasgow Coma Score ≤13 (odds ratio: 6.3, 95% confidence interval: 2.5–16.0), ≥1 abnormal vital sign on admission (odds ratio: 2.6, 95% confidence interval: 1.2–5.6), ≥2 abnormal vital signs at any time (odds ratio: 6.4, 95% confidence interval: 1.4–29.5), a persistently abnormal vital sign (odds ratio: 4.3, 95% confidence interval: 2.0–9.0), and vital signs consistent with pneumonia (odds ratio: 5.3, 95% confidence interval: 1.9–14.8).
Conclusion:
Abnormal vital sign groups are generally superior to individual vital signs in predicting undesirable outcomes. They could inform best practice management, emergency department disposition, and communication with the patient and family.
Keywords
Introduction
Vital signs commonly monitored in the emergency department (ED) include heart rate (HR), respiratory rate (RR), systolic blood pressure (SBP), oxygen saturation (SaO2), Glasgow Coma Score (GCS), and temperature (Temp). Vital sign monitoring may provide indications of clinical improvement or an adverse change in the patient’s condition.1–4
There are reports of associations between abnormal vital signs and undesirable patient outcomes.5–9 However, these studies only examined individual vital signs at designated time points (e.g. at triage). Furthermore, while there are reports of which individual abnormal vital signs are associated with undesirable outcomes, the findings are inconsistent.7,8,10
To date, there are no reports of associations between ED abnormal vital sign groups and undesirable patient outcomes. We aimed to use routinely collected ED data to determine the association between both abnormal individual vital signs and abnormal vital sign groups, and undesirable patient outcomes. The findings may provide valuable information that could potentially highlight high-risk patients and affect patient management and disposition decisions.
Methods
We undertook a prospective cohort study in a single tertiary referral ED between February and May 2015. The department has a mixed (adult/paediatric) annual census of approximately 77,000 patients. The study was approved by the institution’s Human Research Ethics Committee (HREC).
A convenience sample of patients was recruited and comprised consecutive patients who presented during the periods when the principal investigator was available, mainly on weekdays between 08:00–18:00 h. All patients aged 18 years or more were eligible for inclusion. They were excluded if a full set of vital signs was not recorded. Patient consent was waived by the HREC.
During each patient’s ED stay, the principal investigator collected data from the electronic medical record as it was generated: demographics, Australasian triage category (categories 1–5, 1 = highest priority), all vital signs, co-morbidities, medications, presenting complaint, presenting time and day of the week, and ED discharge diagnosis. All vital signs were collected by the ED nursing staff in accordance with usual practice and clinical indications only. No changes were made for this study.
Data on management that could have affected the vital signs were not recorded (e.g. oxygen, intravenous fluids). In this preliminary study, we deliberately did not adjust for these potential confounding variables. A subsequent study will adjust for them and explore the magnitude of their effects. HR was measured either manually or with an oxygen saturation probe or cardiac monitor. RR was measured manually, SBP with an electronic sphygmomanometer, SaO2 with an oxygen saturation probe and Temp with an electronic aural thermometer.
At least 2 weeks post-discharge from the ED, each patient’s electronic medical record was accessed to determine whether they had experienced one or more of the undesirable outcomes of interest. The death could occur at any time during the hospital stay and was not confined to a specific period post-admission.
A random selection of 5% of patients was selected and their medical records examined by a separate investigator (D.T.). The original data were found to be accurate. No errors were found in data transcription or identification of medical emergency team (MET) calls or deaths.
The outcomes were three undesirable patient outcomes: admission to hospital, an MET call in the inpatient ward, and death in the ED or ward. An MET call is made for ward patients if they deteriorate and meet MET call criteria (Box 1).
Definitions of abnormal emergency department vital signs and MET call criteria.
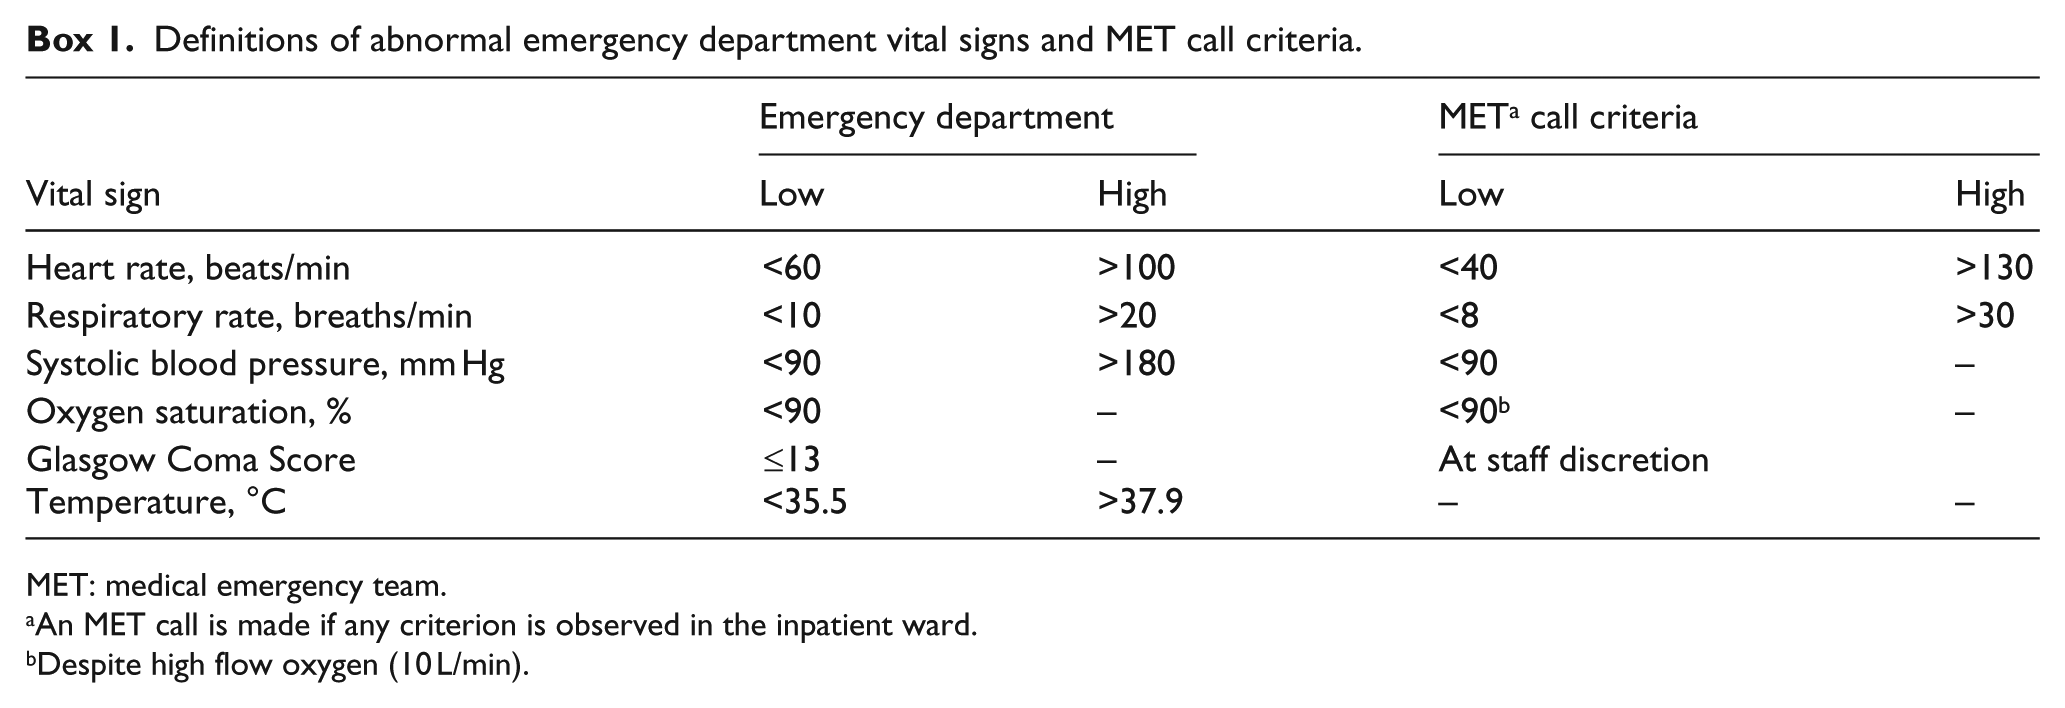
MET: medical emergency team.
An MET call is made if any criterion is observed in the inpatient ward.
Despite high flow oxygen (10 L/min).
We determined the association between these outcomes and individual abnormal vital signs (Box 1) and six abnormal vital sign groups (Box 2). The ranges of abnormal vital sign values were drawn from definitions in the hospital clinical guidelines. In this preliminary study, the vital sign groups were chosen as each represents a type of vital sign abnormality observed in the ED. The first three groups (≥1 abnormal vital sign at some time point) are commonly observed. The last three groups are consistent with, but not diagnostic of, important clinical conditions: septic shock, 11 respiratory infection, 12 and hypothermia. 13 The vital sign group groups were not mutually exclusive. For example, a patient classified as having an abnormal vital sign on admission to the ED would also have been classified as having an abnormal vital sign at any time during the ED stay. Other vital sign groups could have been defined and examined although this was beyond the scope of this study.
Definitions of abnormal vital sign groups.
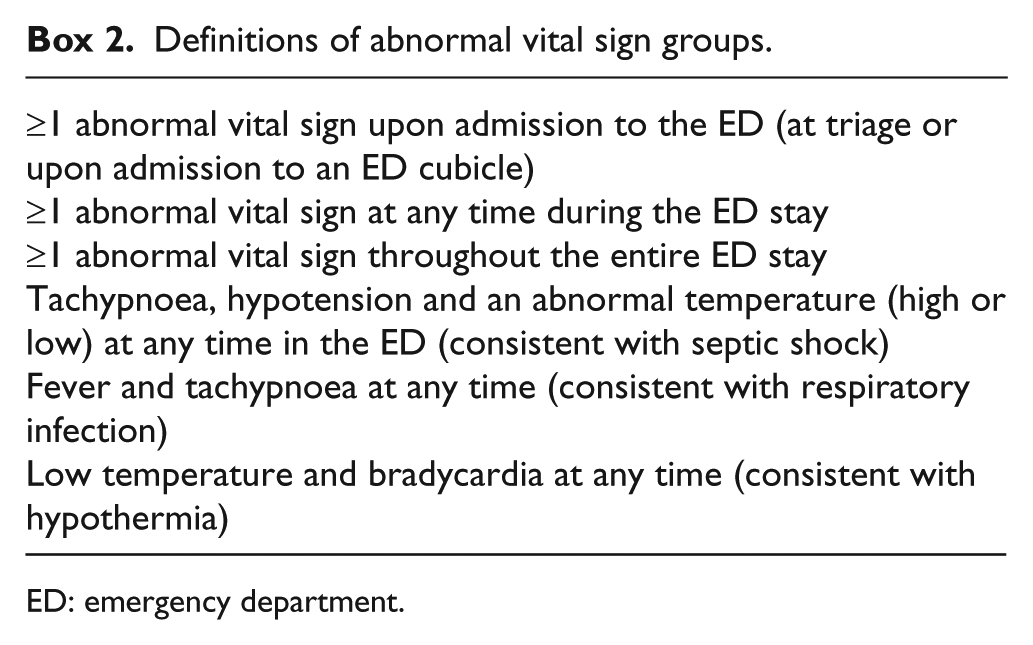
ED: emergency department.
The sample size was based upon comparisons of the percentage of undesirable outcomes observed in the normal and any abnormal vital sign category. In order to demonstrate a clinically significant difference in undesirable outcomes of 5% (normal vital sign category) versus 15% in any abnormal category, at least 160 patients were required in each category (level of significance: 0.05, two-sided, power: 0.9). With 160 patients in each of the seven vital sign groups (one normal and six abnormal), a total of 1120 patients were needed. As unequal patient numbers were expected in the categories, the total sample size was increased to 1600.
Univariate analyses and multivariate logistic regression were employed to determine which demographic variables (age, gender, triage category) and individual vital signs were associated with each of the three undesirable patient outcomes.
The vital sign groups were composites of individual vital signs. As there was co-linearity between the individual vital signs and vital sign groups, it was inappropriate to include the vital sign groups in the logistic regression models. Hence, examination of the association between vital sign group categories and the undesirable patient outcomes was limited to univariate analyses. Intercooled Stata 6.0 for Windows 98/95/NT (Stata Corporation, College Station, TX, USA) was employed for all analyses.
Results
Of the 1600 patients enrolled, 162 had incomplete vital sign data and were excluded (Figure 1). Of the remaining 1438 patients, 691 (48.1%, confidence interval (CI): 45.4, 50.7) were male and the largest age group was 60–79 years (Table 1).
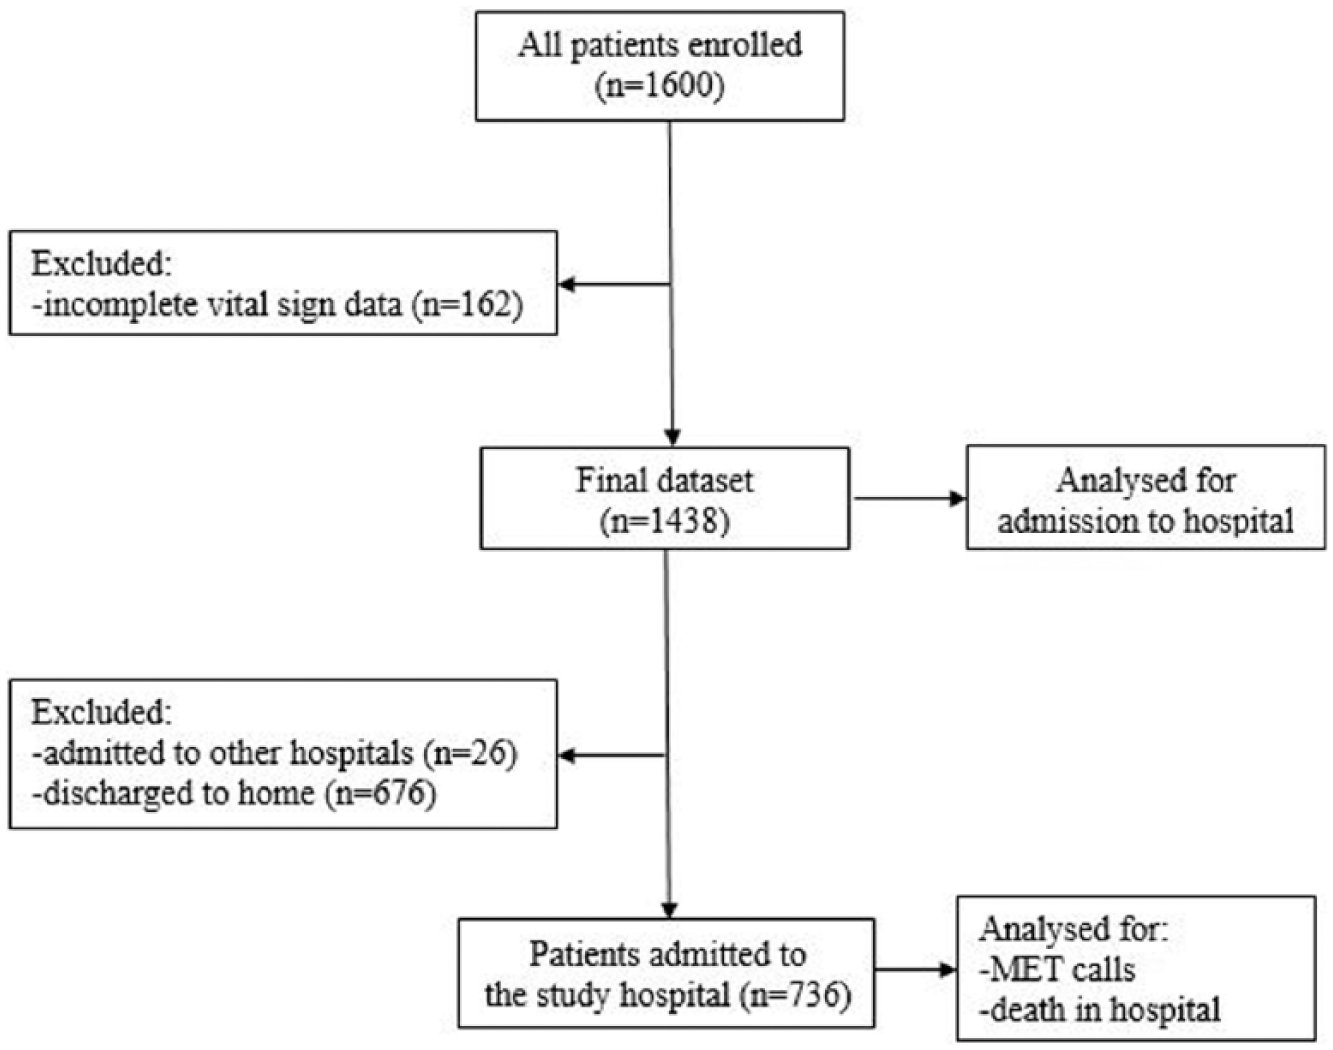
Flow of patients through the study.
Demographic, individual vital sign and vital sign group associations with admission to hospital.
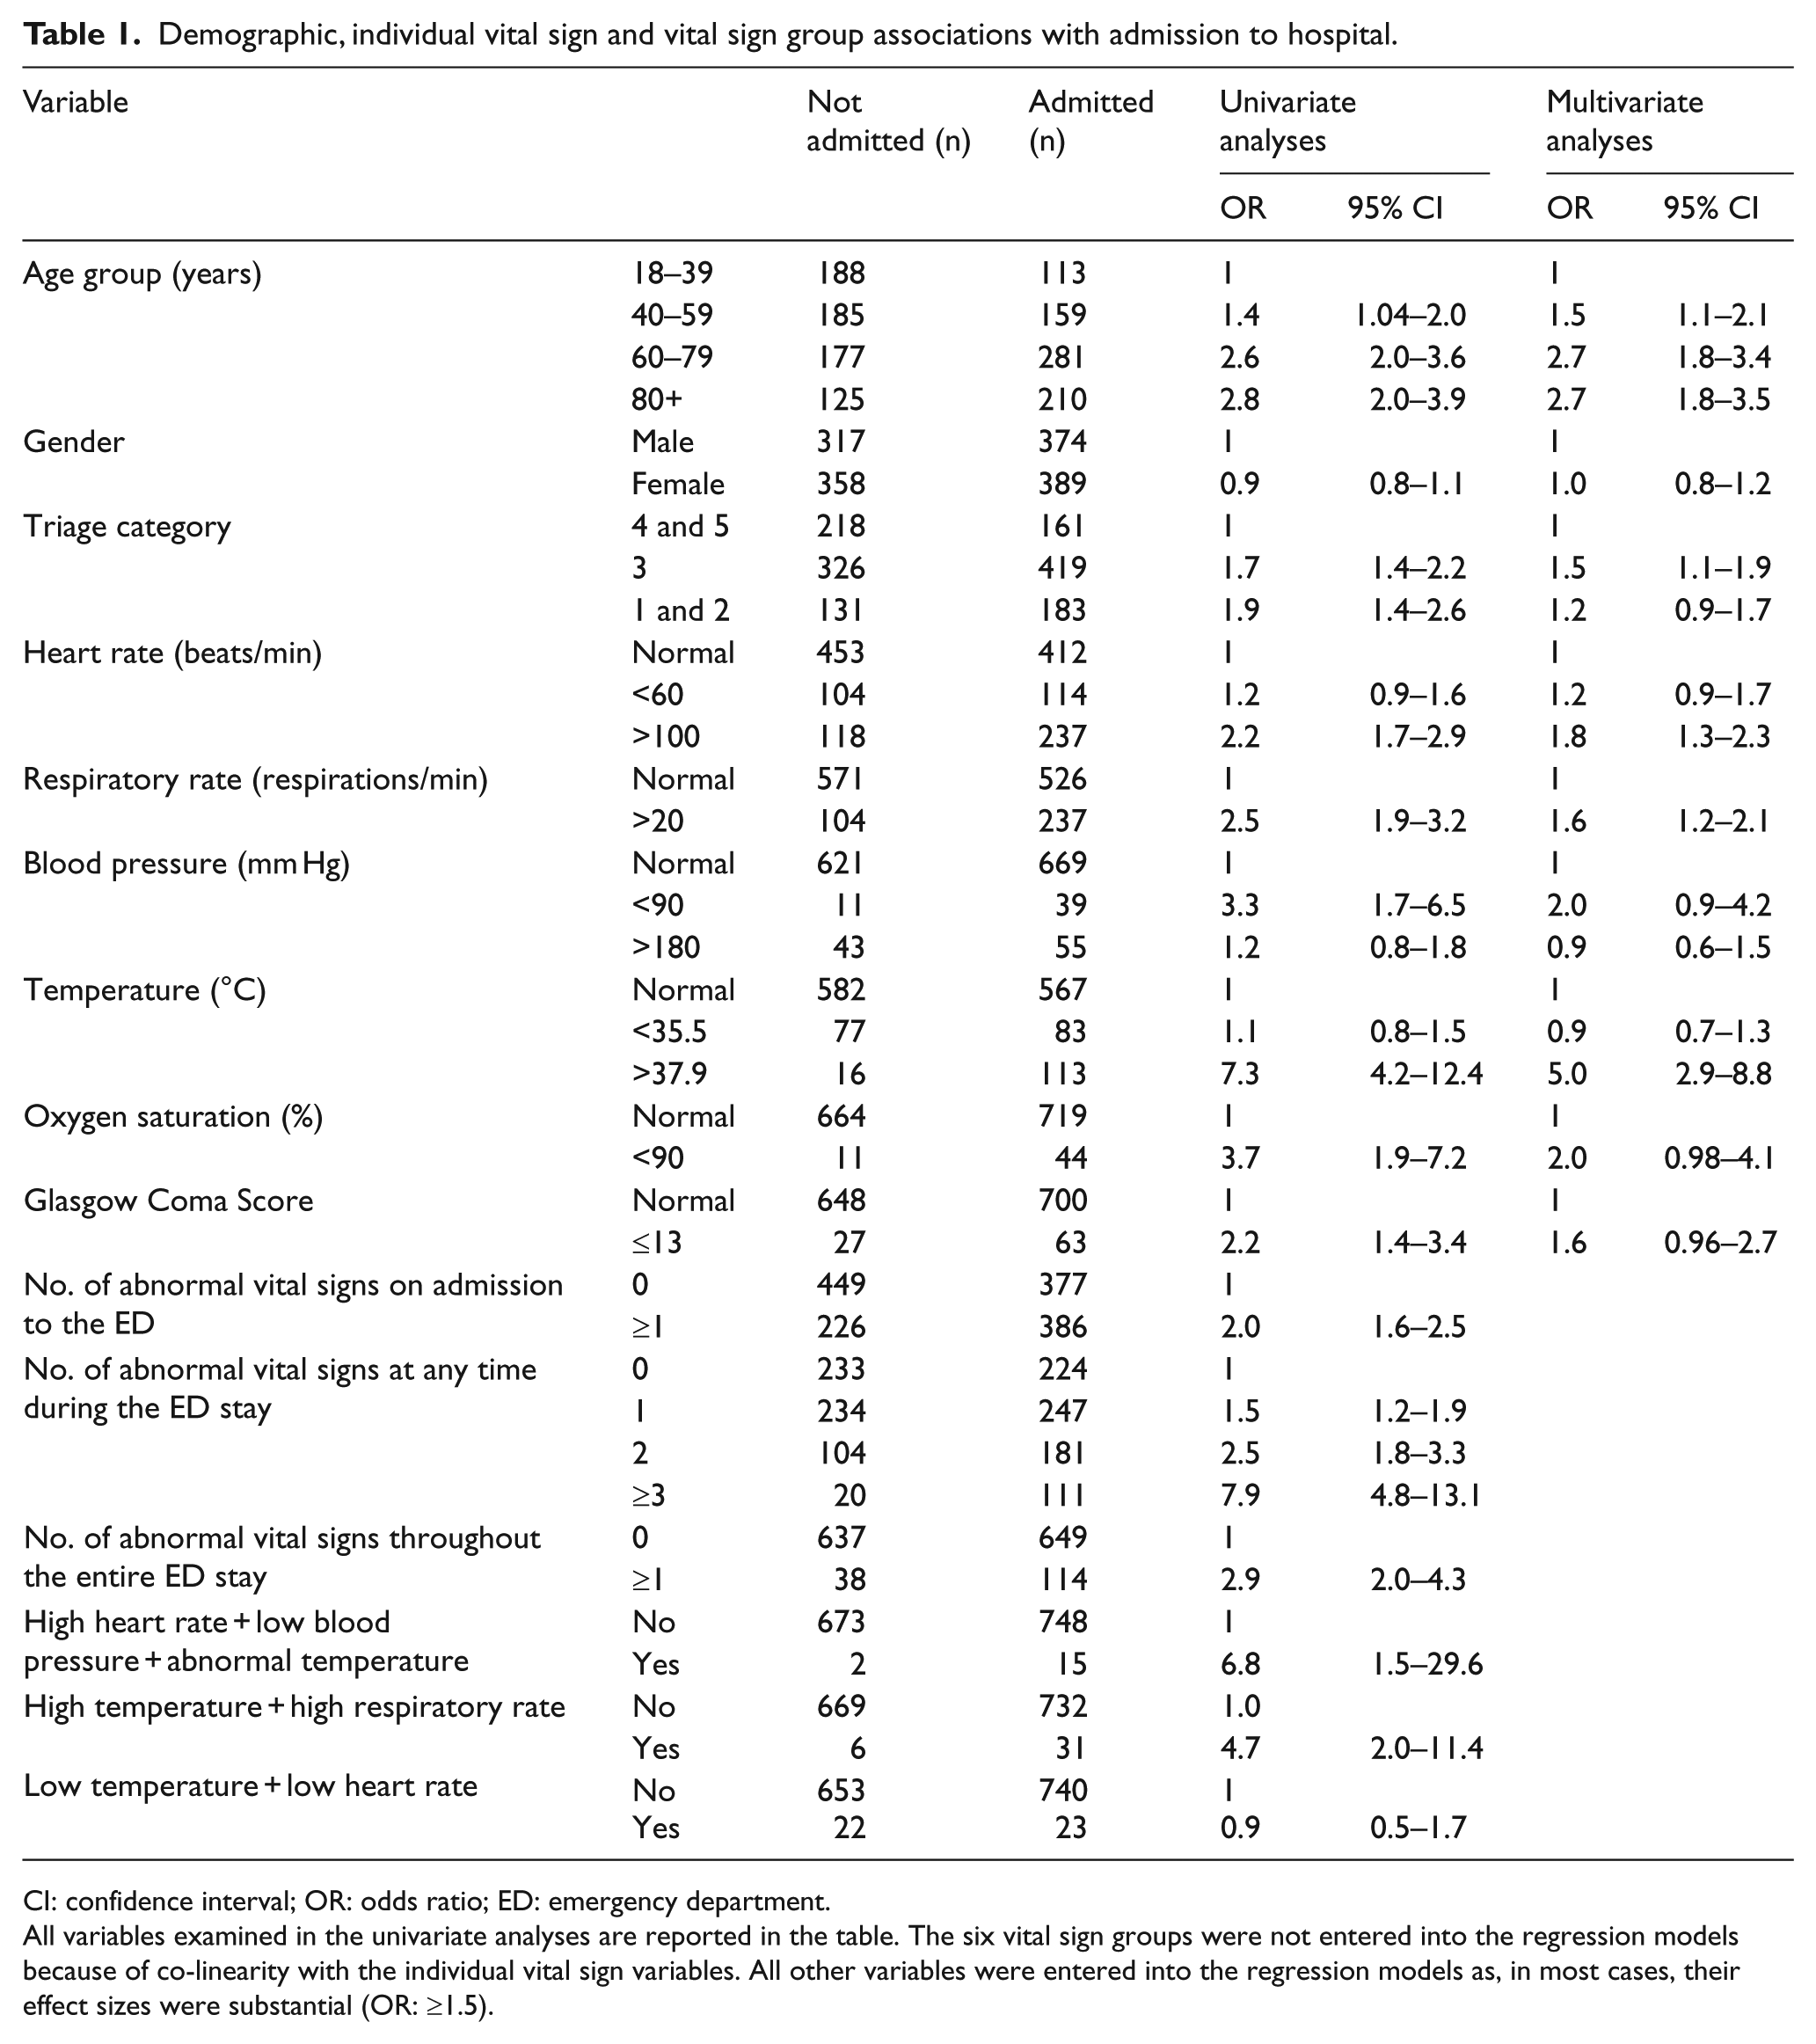
CI: confidence interval; OR: odds ratio; ED: emergency department.
All variables examined in the univariate analyses are reported in the table. The six vital sign groups were not entered into the regression models because of co-linearity with the individual vital sign variables. All other variables were entered into the regression models as, in most cases, their effect sizes were substantial (OR: ≥1.5).
A total of 736 patients were admitted to hospital. The demographics, vital signs and vital sign groups associated with admission were age >60 years, tachycardia, tachypnoea, fever, ≥1 abnormal vital sign on admission to the ED, ≥1 abnormal vital sign at any time in the ED, ≥1 abnormal vital sign throughout the ED stay and vital sign groups consistent with sepsis and pneumonia (Table 1).
In all, 83 patients had MET call during their hospital stay. The demographics, vital signs and vital sign groups associated with an MET call in hospital were age >60 years, tachycardia, tachypnoea, ≥1 abnormal vital sign on admission to the ED, ≥2 abnormal vital sign at any time and ≥1 abnormal vital sign throughout the ED stay (Table 2).
Demographic, individual vital sign and vital sign group associations with MET calls.
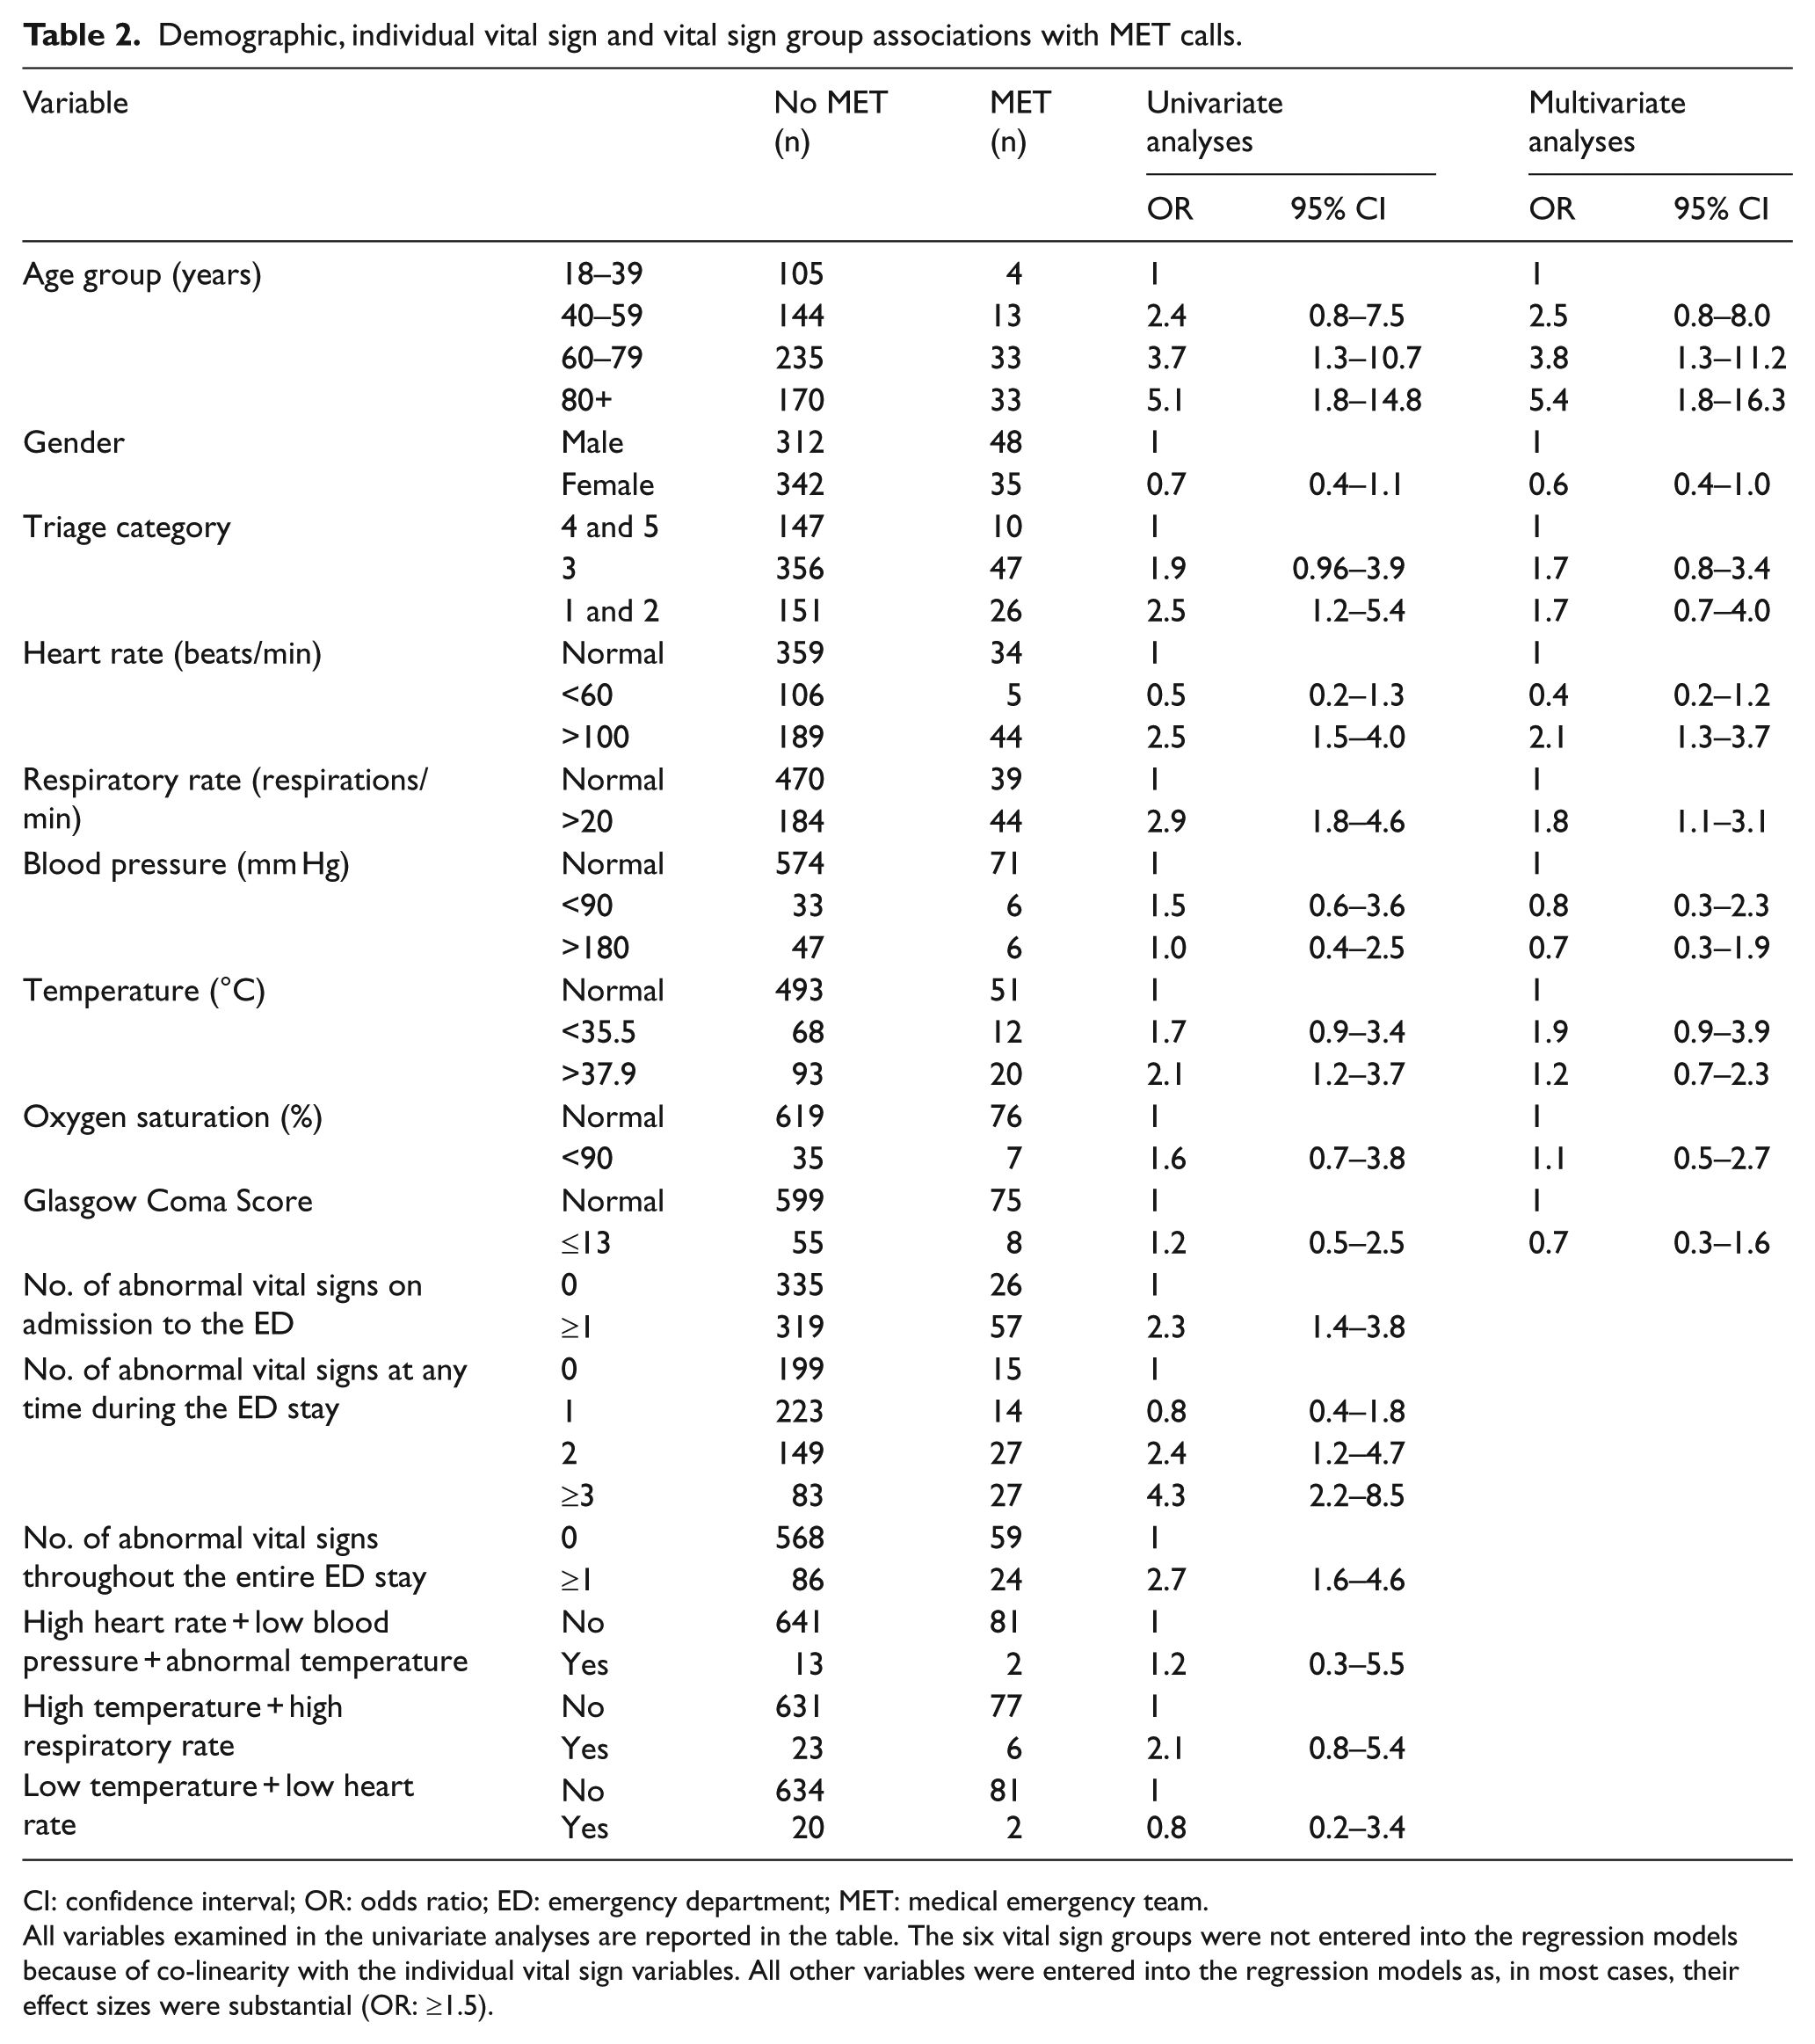
CI: confidence interval; OR: odds ratio; ED: emergency department; MET: medical emergency team.
All variables examined in the univariate analyses are reported in the table. The six vital sign groups were not entered into the regression models because of co-linearity with the individual vital sign variables. All other variables were entered into the regression models as, in most cases, their effect sizes were substantial (OR: ≥1.5).
A total of 32 patients died in hospital. The demographics, vital signs and vital sign groups associated with death in hospital were age ≥80 years, GCS ≤ 13, ≥1 abnormal vital sign on admission to the ED, ≥2 abnormal vital sign at any time, ≥1 abnormal vital sign throughout the ED stay and a vital sign group consistent with pneumonia (Table 3).
Demographic, individual vital sign and vital sign group associations with death in the ward.
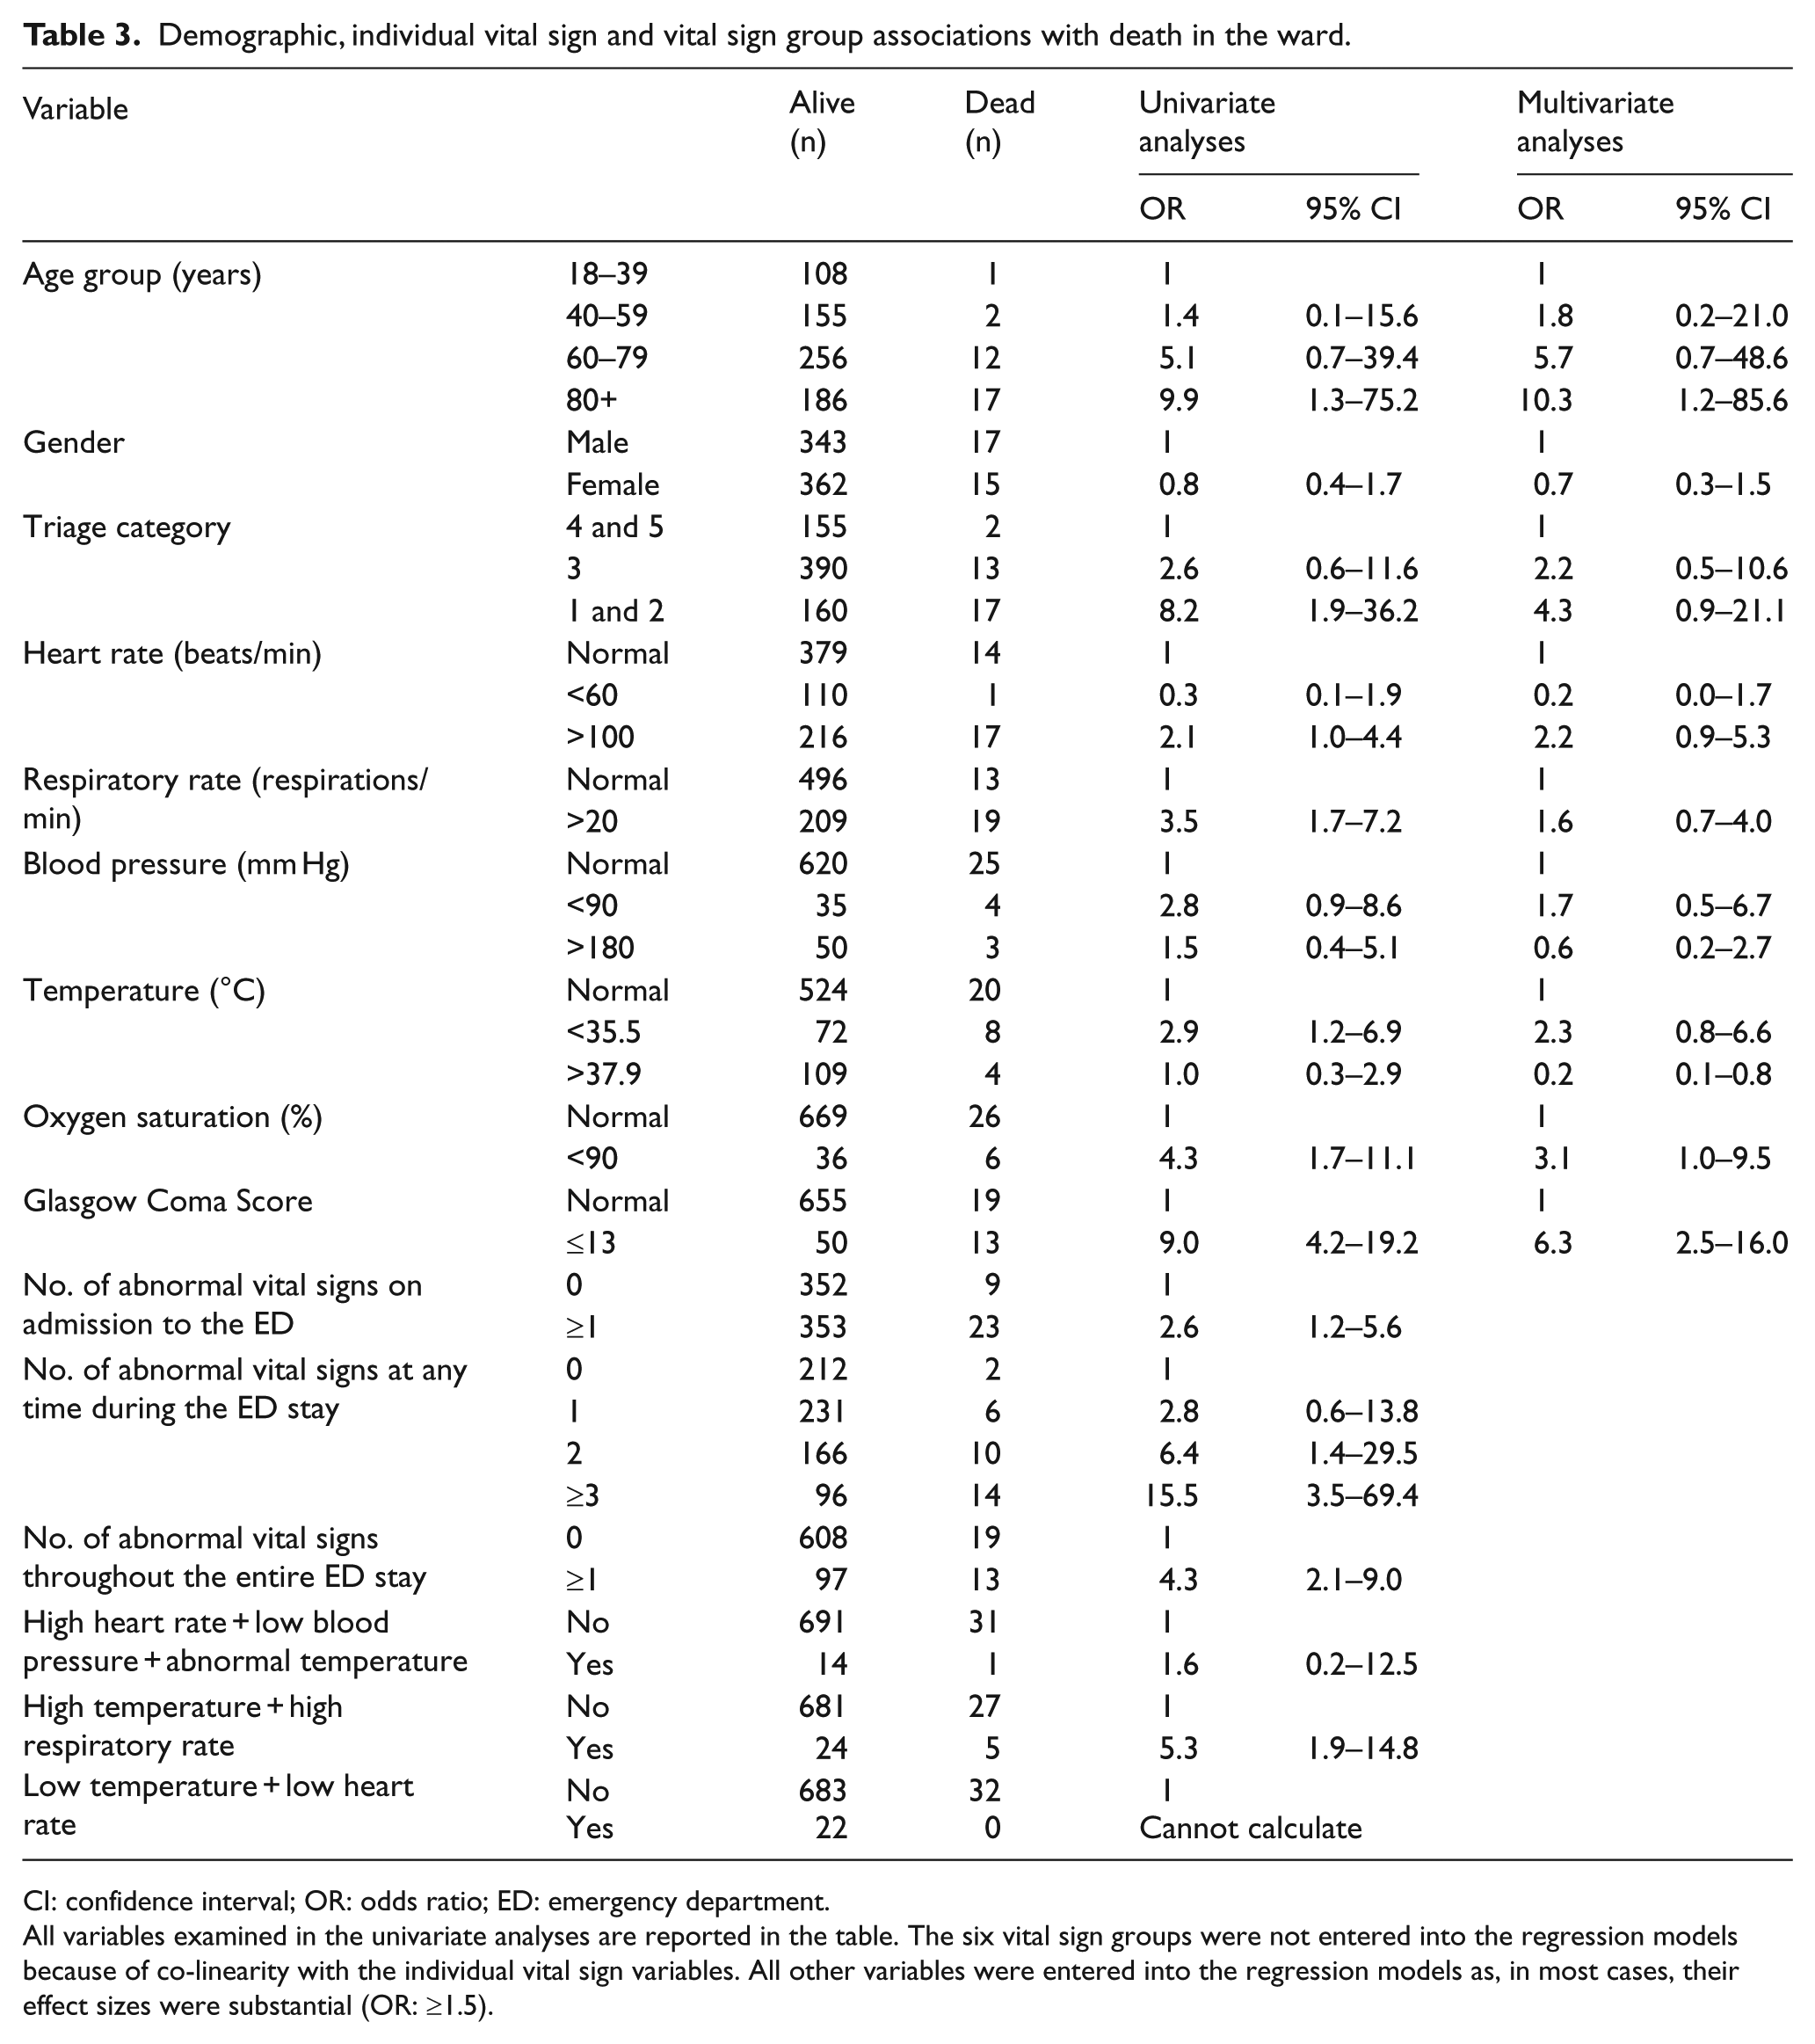
CI: confidence interval; OR: odds ratio; ED: emergency department.
All variables examined in the univariate analyses are reported in the table. The six vital sign groups were not entered into the regression models because of co-linearity with the individual vital sign variables. All other variables were entered into the regression models as, in most cases, their effect sizes were substantial (OR: ≥1.5).
Discussion
All but two of the individual vital signs (blood pressure (BP) and SaO2) were associated with at least one undesirable patient outcome. While most of these findings were expected,1,14 the effect sizes (odds ratio (OR)) were generally small. The exceptions, however, were for Temp and GCS which had substantial associations with admission and death, respectively.
In this study, neither hypotension nor low SaO2 were associated with any of the patient outcomes. These findings were not expected as previous studies have reported that both are strong predictors of in-hospital mortality.10,15,16 Although we found that there were trends for both hypotension and low SaO2 to be associated with death, the small number of patients with these abnormalities meant that the study was likely to be under-powered for these variables.
There are a number of reports of associations between individual vital signs and patient death. These include low SaO2,5,16 tachypnoea,5,7,16 tachycardia, 7 a decreased GCS5,7,14 and hypotension.10,15 In our study, only an abnormal GCS and Temp were associated with death. The GCS finding was expected and consistent with earlier reports. However, the finding that a raised Temp was a protective factor for death has also been recently reported. 17
As the findings of earlier studies have been inconsistent, several Vital Sign Scores (VSS) have been examined. Alam et al. 18 developed a National Early Warning Score (NEWS) that comprises scores of 0–3 for each of six vital signs as well as the use of supplemental oxygen therapy. Olsson et al. 19 examined a Rapid Acute Physiology Score (RAPS) derived from BP, HR, RR and GCS values. Merz et al. 8 examined a VSS comprising seven variables including five vital signs. Each of these studies found that the scores employed were significantly associated with undesirable outcomes including death. A study comparing the predictive accuracy for undesirable outcomes of these three scores and the vital sign groups in our study is recommended in order to determine the most useful clinical tool.
This study is the first to examine the association between abnormal vital sign groups and undesirable patient outcomes. All but one of the abnormal groups (low T, low HR) was associated with one or more of the outcomes. Most importantly, four abnormal groups were associated with death, with the effect size (OR) for each group being substantial. This finding highlights the potential importance of vital sign groups in the assessment of ED patients and their superiority over individual vital signs alone.
Our vital sign group of the ‘number of abnormal vital signs at any time’ is similar to various VSS that have been investigated.8,18,19 In each of these studies, an increasing number of abnormal vital signs was associated with an increase in the risk of patient death. Although the exact nature of the predictor variables in these studies varied (number of abnormal vital signs or a score), their findings are consistent and provide strong evidence for this important association.
Patient age, gender and triage category were included in the analyses as potential confounding variables. The association between increasing age and the undesirable outcomes was expected and likely associated with co-morbidities and lower levels of physiological reserve.7,8,19 Alternatively, there was no reason to expect that gender would be associated with these outcomes. The association between triage category 3 status and admission to hospital was relatively small (OR: 1.5) but larger than that for the more urgent categories 1 and 2 (combined). However, triage category relates only to the urgency for the patient to be seen and does not necessarily relate to the likelihood of a patient requiring admission. Also, the significant association between category 3 status and admission is likely a function of the large number of patients in this category.
The association between abnormal vital sign groups and undesirable patient outcomes may have implications for clinical practice. The identification of these vital sign groups could be used to risk stratify patients and inform the most appropriate management decisions. These include patient disposition to the most suitable level of care (e.g. admission versus discharge, intensive care rather than an inpatient ward) and the extent of medical interventions provided (e.g. early use of vasopressor drugs). This information is also likely to inform communication between the ED staff and the patient and their family.
In this study, it is not known why some vital signs were not measured and recorded. Although speculative, this may have been due to time constraints or a perceived lack of need. Vital sign measurement is not always consistent and intervention projects have been undertaken to improve the frequency of measurement and recording. Di Martino et al. 20 reported that a multidisciplinary team and a formal quality improvement initiative improved vital sign documentation at triage. Also, an intervention by Gerdtz et al. 21 of restructuring their computerised interface, regular audit and feedback, and education sessions resulted in progressive, sustained improvements documentation.
The optimal frequency for vital sign measurement is not known. Vital signs may deteriorate or improve over time and this was clearly evident in our study. Furthermore, lengthy periods between vital sign measurement may lead to errors of omission by not detecting changes in vital signs. 22
Manual vital sign measurement and recording is labour and time intensive. However, vital sign measurement can now be automated and entered directly into an electronic patient medical record.23 –27 Moreover, these vital signs can be monitored remotely 27 and early warnings can be generated upon the development of abnormalities. 25 Bellomo et al. 26 reported that automated vital signs monitors improved the proportion of rapid response team calls triggered by respiratory criteria, increased survival of patients and decreased the time required for vital signs measurement.
Notwithstanding the findings of this study, Kline et al. 28 warn that normal vital signs, in patients with symptoms consistent with serious conditions (e.g. pulmonary embolism), should not preclude objective testing to adequately investigate the patient. Alternatively, Jones et al. 29 warned that the use of deranged vital signs, in isolation, does not consider other variables that may adversely affect patient outcome.
Finally, while it is possible to measure vital signs automatically and to have warnings of the development of abnormal vital signs or groups, the ways in which these warnings are acted upon need to be determined.
This study has important limitations. We screened approximately 7.8% of all adult patients during the study period and patient mix can vary with the time of the day and day of the week. It is possible, therefore, that selection bias was introduced through our convenience sampling technique. However, the enrolment of consecutive patients during all recruitment periods helped to minimise selection bias during those periods. The exclusion of patients who did not have near-complete vital sign sets is also likely to have introduced selection bias. As it is not known whether these patients were sicker or less sick than those enrolled, the direction and magnitude of this bias cannot be determined. As they represented 10% of all patients screened, the magnitude of the bias is unlikely to have been substantial. Older patients tend not to have the same vital sign responses to acute medical conditions as younger patients. As the majority of our patients were aged 60 years or more, the findings may not be representative of younger patients.
The prospective vital sign collection technique and the use of instruments to measure some vital signs are likely to have minimised measurement bias. Although the three outcome measures were collected retrospectively, each is always recorded in the medical records and none is open to misinterpretation.
The sample size calculation required 160 patients in each vital sign category. For some categories, this was not achieved and it is apparent that some comparisons were under-powered. Despite the substantial sample size, the numbers of deaths was relatively small. 14 This limited the power of the study to determine some variables associated with death. It cannot be assumed that the vital sign status in the ED was directly associated with undesirable outcomes, for example, a patient with vital signs of septic shock may have recovered, only to die from pulmonary embolism. This is more likely to occur if the period between admission and death is long. Death at any time during the hospital stay was chosen as an endpoint rather than death within an arbitrary time (e.g. 30 days). This was deliberate as it provides a more useful clinical prognosis overall, upon which management decisions can be based. It is likely that the associations between ED abnormal vital sign groups and the MET call and death outcomes decrease with time in the ward. Further studies are recommended to investigate the associations at predetermined time periods, for example, 1, 3, 5 and 7 days after admission.
We did not distinguish between patients who were/were not very ill and expected to die (e.g. not for resuscitation) and the management of these groups may have differed. Also, management that may have affected some vital signs, and confounded the results, was not collected, for example, oxygen therapy will likely affect vital signs. Hence, some abnormal vital sign groups may have been masked and under-reported.
As a single-centre study, the external validity of the findings may be limited. However, there is no reason to believe that the characteristics of our patients differ substantially from those of other similar centres.
Conclusion
Abnormal vital sign groups may complement abnormal individual vital signs in predicting important undesirable patient outcomes. Admission was associated with a range of abnormal vital signs and groups. MET calls were associated with tachycardia and tachypnoea. Death was associated with GCS ≤ 13 and vital signs consistent with pneumonia. Both were associated with ≥1 abnormal vital sign on admission, ≥2 abnormal vital signs at any time and a persistently abnormal vital sign. Automatic vital sign measurement may allow early warnings of significant abnormal vital sign groups and may inform best practice patient management, disposition and communication with the patient and family.
Footnotes
Acknowledgements
All authors contributed to the development of the study protocol. D.T. and M.L. were responsible for obtaining ethical approval for the study and collated and cleaned all data in preparation for data analysis. M.L. collected all data. D.T. and A.U. undertook the data analysis. All authors contributed to preparation of the manuscript and all take responsibility for its contents.
Declaration of conflicting interests
The author(s) declared no potential conflicts of interest with respect to the research, authorship and/or publication of this article.
Funding
The author(s) received no financial support for the research, authorship and/or publication of this article.
Presentation
The findings from this project were presented in the ‘Best Paper by a Fellow’ session at the 2015 Annual Scientific Meeting of the Australasian College for Emergency Medicine.