
Abstract
Objective:
We assessed the evolution of lung aeration by “Lung Ultrasound Score” to predict the acute respiratory distress syndrome in patients with paraquat intoxication.
Methods:
Patients with paraquat intoxication treated in the intensive care unit were reviewed. Patients who had been assessed by transthoracic lung ultrasound at 3 time points as day 1, day 3, and day 7 after the treatment were analyzed. Lung aeration was represented by the lung ultrasound score. The relationship of the score with the development of acute respiratory distress syndrome was evaluated.
Results:
There were 50 patients included. On day 7, 18 patients developed the acute respiratory distress syndrome. The acute respiratory distress syndrome patients demonstrated a higher mortality rate than that for the non-acute respiratory distress syndrome patients (88.9% vs 31.5%, p < 0.001). In addition, the acute respiratory distress syndrome patients not only had a higher creatinine level (p < 0.001), and Sepsis-related Organ Failure Assessment 48-h scores (p < 0.001), and a longer time to gastric lavage but also suffered from a lower PaO2/FiO2 (p < 0.001) and a higher lung ultrasound score (p < 0.001) compared to those in the non-acute respiratory distress syndrome patients. The decrease in PaO2/FiO2 between day 3 and day 7 correlated with the increase in lung ultrasound score between day 3 and day 7. There was also a significant correlation between the Sepsis-related Organ Failure Assessment score and lung ultrasound score in acute respiratory distress syndrome patient on day 7.
Conclusion:
The transthoracic lung ultrasound may be a useful tool for lung aeration assessment on patients with paraquat intoxication receiving treatment. Further studies are needed to evaluate the impact of this screening strategy on predicting acute respiratory distress syndrome.
Introduction
Paraquat is a widely used herbicide in agriculture. There are numerous cases of paraquat poisoning by oral ingestion either accidentally or intentionally. The mortality rate of paraquat poisoning ranges from 50% to 90%, and there is no specific antidote. 1 Clinical manifestations and outcomes of acute paraquat poisoning depend on the volume of paraquat ingested orally. A volume of 20 mL of 20% liquid paraquat is likely to cause death within 1–4 days, while smaller quantities (<20 mL) may cause irreversible lung fibrosis and renal failure, leading to death within several weeks. 2 Patients are often treated aggressively with a conventional therapy including gastric lavage, fluid infusion, antioxidants, cyclophosphamide, corticosteroids, and hemoperfusion. 3 Recently, extracorporeal elimination such as hemoperfusion has been used clinically in treating acute paraquat poisoning despite its controversial effects.4,5 However, the outcome of paraquat poisoning remains poor. 6
In China, transthoracic lung ultrasound is increasingly used in emergency departments and intensive care units (ICUs). It is non-invasive, without radiation exposure, and can be done at the bedside. 7 Lung ultrasound has been validated to assess alveolar recruitment in patients with acute respiratory distress syndrome (ARDS).8,9 The primary objective of the study was to assess the evolution of lung aeration by lung ultrasound to predict ARDS in patients with paraquat intoxication.
Methods
This was a retrospective, observational study. The setting was the ICU of the Second Affiliated Hospital Zhejiang University School of Medicine. It was conducted from 1 January 2014 to 31 December 2015. Patients treated for paraquat poisoning were recruited. A presumptive diagnosis of paraquat poisoning was based on exposure history, clinical effects, and physical and laboratory examinations, especially the urine sodium dithionite screening test.4–8 They would be included if they were >18 years, had ingested paraquat, and had urine paraquat tests that showed dark or navy blue coloring (>5 ppm). Patients were excluded if the paraquat exposure was limited to dermal or intravascular exposure or they had not been assessed by transthoracic lung ultrasound during the treatment. The diagnoses of major comorbidities were based on detailed clinical, physical, and laboratory examinations. The diagnosis of ARDS was made according to the Berlin-definition on the treatment on day 7: with three mutually exclusive categories of ARDS based on degree of hypoxemia: mild (200 mmHg < PaO2/FiO2 ≤ 300 mm Hg), moderate (100 mm Hg < PaO2/FiO2 ≤ 200 mm Hg), and severe (PaO2/FiO2 ≤ 100 mm Hg).
The paraquat detoxification protocol includes gastric lavage with a large amount of 0.9% saline followed by 1 g/kg activated charcoal and 250 mL magnesium citrate through a nasogastric tube. Charcoal hemoperfusion with a charcoal containing (Adsorba, Gambro, Germany) dialysis machine was initiated if the urine paraquat was >5 ppm. A second session of hemoperfusion was arranged if the urine paraquat was >5 ppm at 4 h after the first hemoperfusion. The protocol also included pulse therapies of cyclophosphamide (15 mg/kg/day) for 2 days as well as methylprednisolone (1 g/day) for 3 days. Intravenous dexamethasone (20 mg/day) was administrated for another 11 days after methylprednisolone pulse therapy. Pulse therapies with cyclophosphamide and methylprednisolone were repeated if the PaO2 was <60 mmHg and the duration was >2 weeks after the initial treatment, unless patients had leucopenia (white cell counts < 3000/m3). Finally, all patients received normal inspired oxygen therapy (FiO2 21%) throughout their hospitalization.
Transthoracic lung ultrasound was performed by an experienced physician with level-3 certification using a Mindray M9 Echograph and a 2- to 4-MHz round-tipped or convex probe. In each patient, 12 lung areas were examined on right and left lung, delineated by parasternal line, anterior axillary line, posterior axillary line, and paravertebral line: anterosuperior, anteroinferior, laterosuperior; lateroinferior, posterosuperior, and posteroinferior lung region. A number was attributed to each area according to the most severe lung ultrasound detected aeration in the corresponding intercostals spaces: (0) normal aeration: presence of lung sliding with horizontal A lines or fewer than two isolated vertical B lines; (1) moderate loss of lung aeration: either multiple well-defined and spaced B1 lines, issued from the pleural line or from small juxtapleural consolidations and corresponding to interstitial edema; or coalescent B1 lines, issued from the pleural line or from small juxtapleural consolidations, present in a limited portion of the intercostal space and corresponding to localized alveolar edema; (2) severe loss of lung aeration: multiple coalescent vertical B2 lines issued either from the pleural line or from juxtapleural consolidations, detected in the whole area of one or several intercostal spaces and corresponding to diffuse alveolar edema; (3) lung consolidation: presence of tissue pattern containing either hyperechoic punctiform images representative of static air bronchograms, or hyperechoic tubular images, representative of dynamic air bronchograms, corresponding to complete loss of aeration lung ultrasound score (LUS) was calculated as the sum of points ranging from 0 to 36.
For each patient, the following data were collected: age, sex, volume of oral paraquat, and Sepsis-related Organ Failure Assessment (SOFA) scores at 48 h. Time to gastric lavage and hemoperfusion and length of ICU stay were also calculated. Total LUS score, LUS score of each region of interest, and the value of PaO2/FiO2 were recorded on day 1, day 3, and day 7 during treatment.
Data were expressed as mean ± standard deviation (SD) or median and interquartile range (25%– 75%) according to the data distribution. LUS and respiratory variables were compared using one-way analysis of variance (ANOVA) for repeated measures or Friedman’s repeated-measures ANOVA on ranks followed by post hoc Holm-Sidak’s test or Tukey’s test. The correlation between changes in PaO2/FiO2 and changes in LUS score between day 3 and day 7 was performed by linear regression. All analyses were made using software SigmaStat 3.5 (Systat Software Inc., Point Richmond, CA, USA). The statistical significance level was set at p = 0.05.
In our ICU, transthoracic lung ultrasound is routinely performed to monitor changes in lung aeration in patients with ARDS or acute respiratory failure. Because it was a retrospective study, informed consent was not required according to the Chinese Local Ethical Committee.
Results
During the study period, a total of 58 patients with paraquat intoxication were treated in the ICU. Three patients died within 24 h and 5 were not assessed by transthoracic lung ultrasound at 3 time points for various reasons. In total, 50 patients were included for analysis.
The average age of patients was 42.1 years with male predominance. The overall hospital mortality was 52%. The ARDS patients had a higher mortality rate than non-ARDS patients (88.9% vs 31.5%). In addition, the ARDS patients had a higher creatinine level, SOFA 48-h scores, a longer time to gastric lavage, a lower PaO2/FiO2 ratio, a higher LUS, and more episodes of pneumomediastinum than non-ARDS patients (Table 1).
Baseline clinical characteristics of 50 patients with paraquat intoxication.
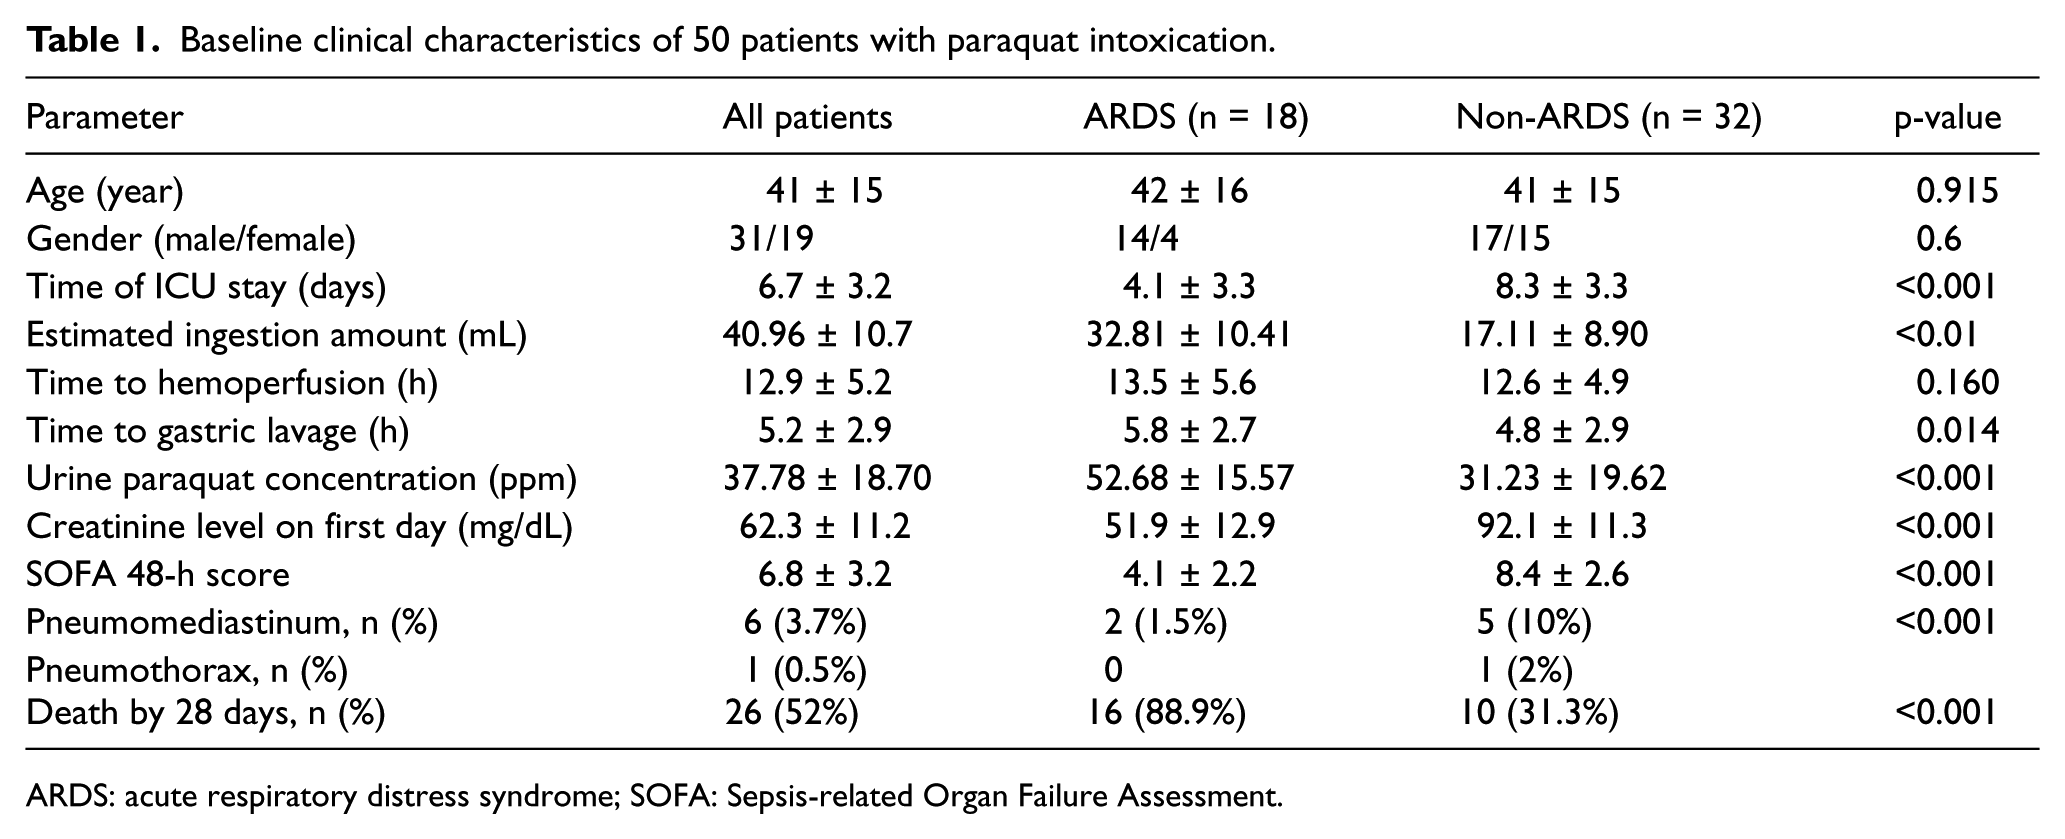
ARDS: acute respiratory distress syndrome; SOFA: Sepsis-related Organ Failure Assessment.
As shown in Table 2 and Figure 1, the total LUS score between the ARDS and non-ARDS patients was significantly different on day 1 (7.8 ± 3.1 vs 5.6 ± 2.4), day 3 (12.0 ± 3.4 vs 8.3 ± 2.2), and day 7 (14.8 ± 4.4 vs 8.5 ± 3.9). The PaO2/FiO2 ratio was also significantly different on day 1 (230.2 ± 50.3 vs 185.4 ± 51.8), day 3 (228.8 ± 52.4 vs 139.0 ± 43.7), and day 7 (244.3 ± 69.3 vs 82.1 ± 26.7).
Evolution of lung ultrasound score and respiratory parameters.
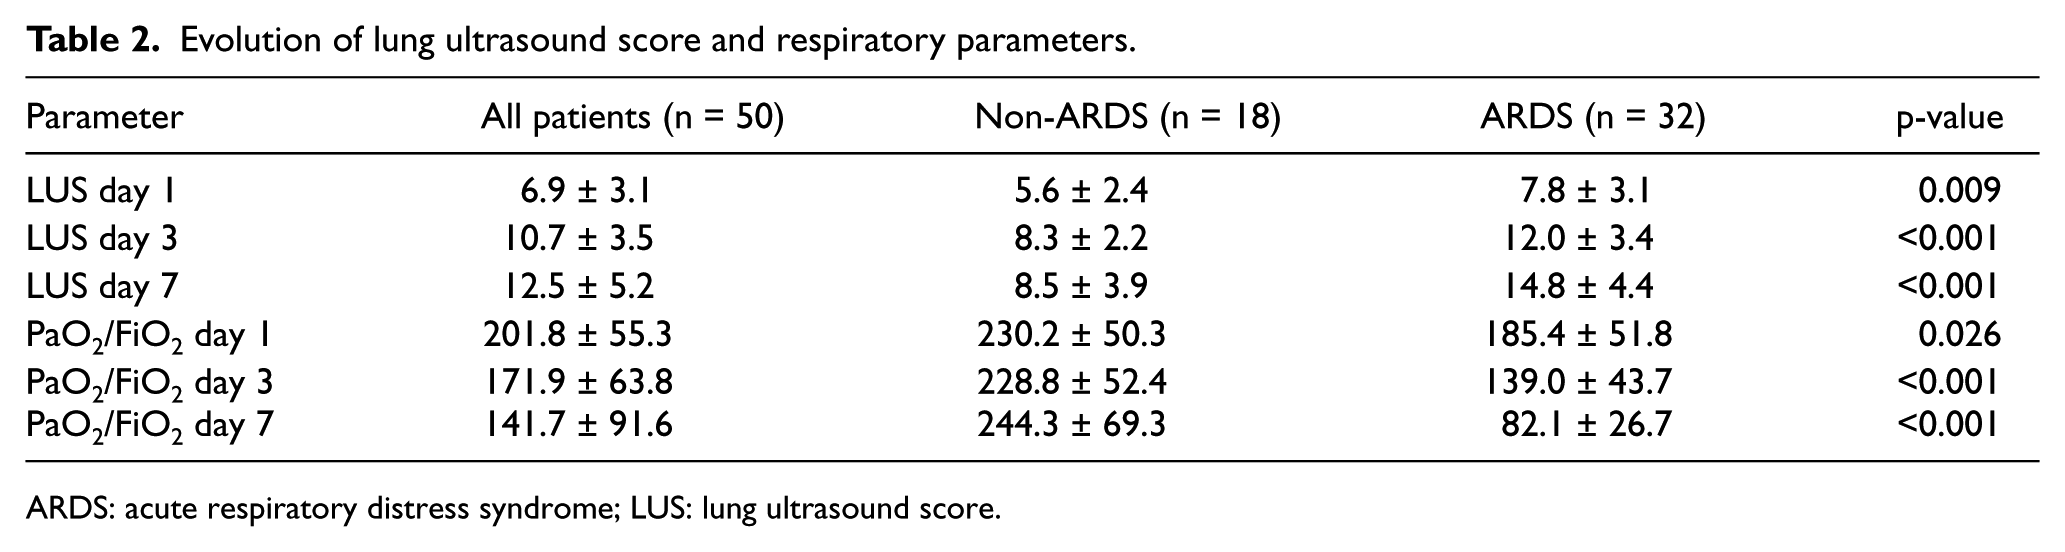
ARDS: acute respiratory distress syndrome; LUS: lung ultrasound score.
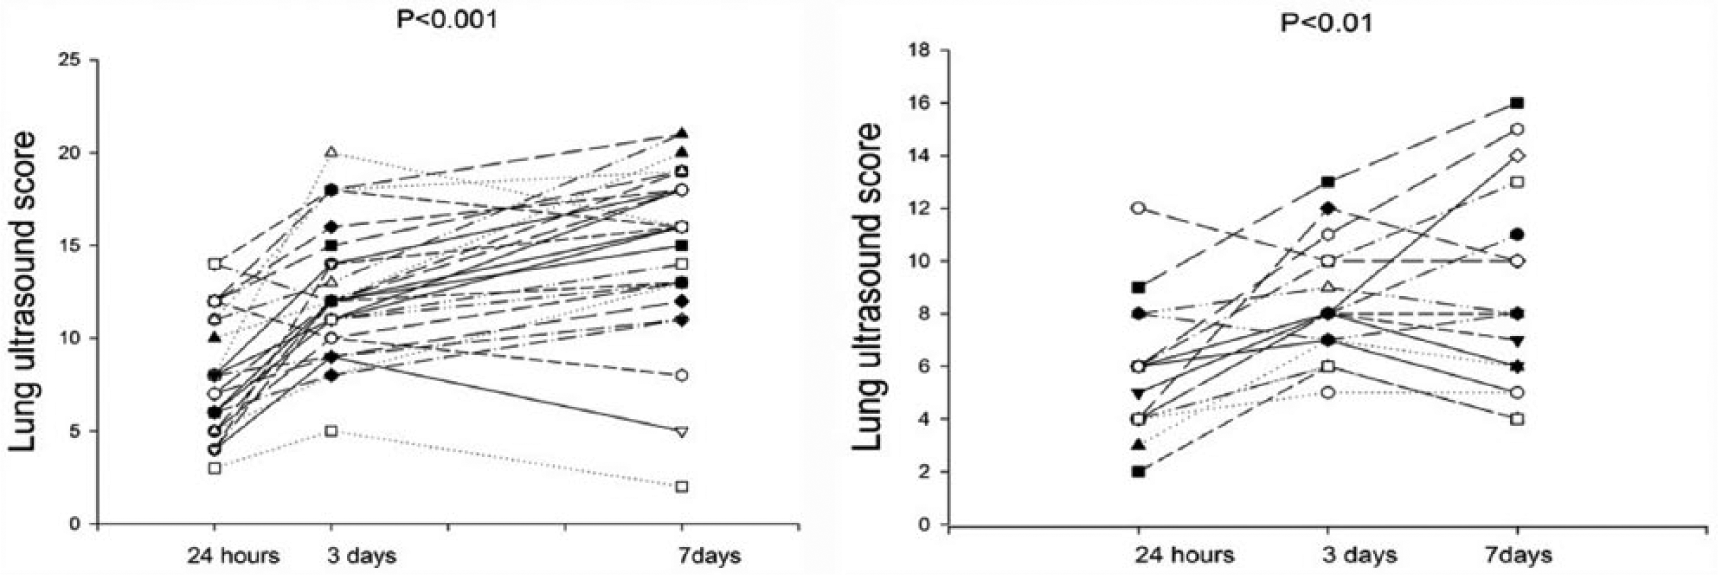
Evolution of individual lung ultrasound score in patients with acute respiratory distress syndrome (ARDS) (left panel) and non-ARDS (right panel) on day 1, day 3, and day 7. p < 0.001 at the top of the figure indicates a statistically significant difference between the three time points using Friedman’s repeated-measures analysis of variance on the ranks.
The evolution of the median individual LUS in patients with ARDS and non-ARDS was shown in Figure 2. There was a significant difference between the two groups (p < 0.001) on day 3 and day 7. The same phenomenon with PaO2/FiO2 ratio from day 3 to day 7 was also observed (Figure 3). The decrease in PaO2/FiO2 between day 1 and day 7 was correlated with the increase in LUS between day 1 and day 7 which is shown in Figure 4. There was also a significant correlation between the SOFA score and LUS in ARDS patient on day 7. Figure 5 shows the lung ultrasound images of 12 lung regions recorded in patients with ARDS and non-ARDS. The receiver operating characteristic (ROC) curve of LUS and ARDS on day 3 and day 7 is depicted in Figure 6. The sensitivity and specificity of LUS for ARDS were 71% and 83.3%, respectively, on day 1, and 87.1% and 72.2% on day 7 (Figure 6).
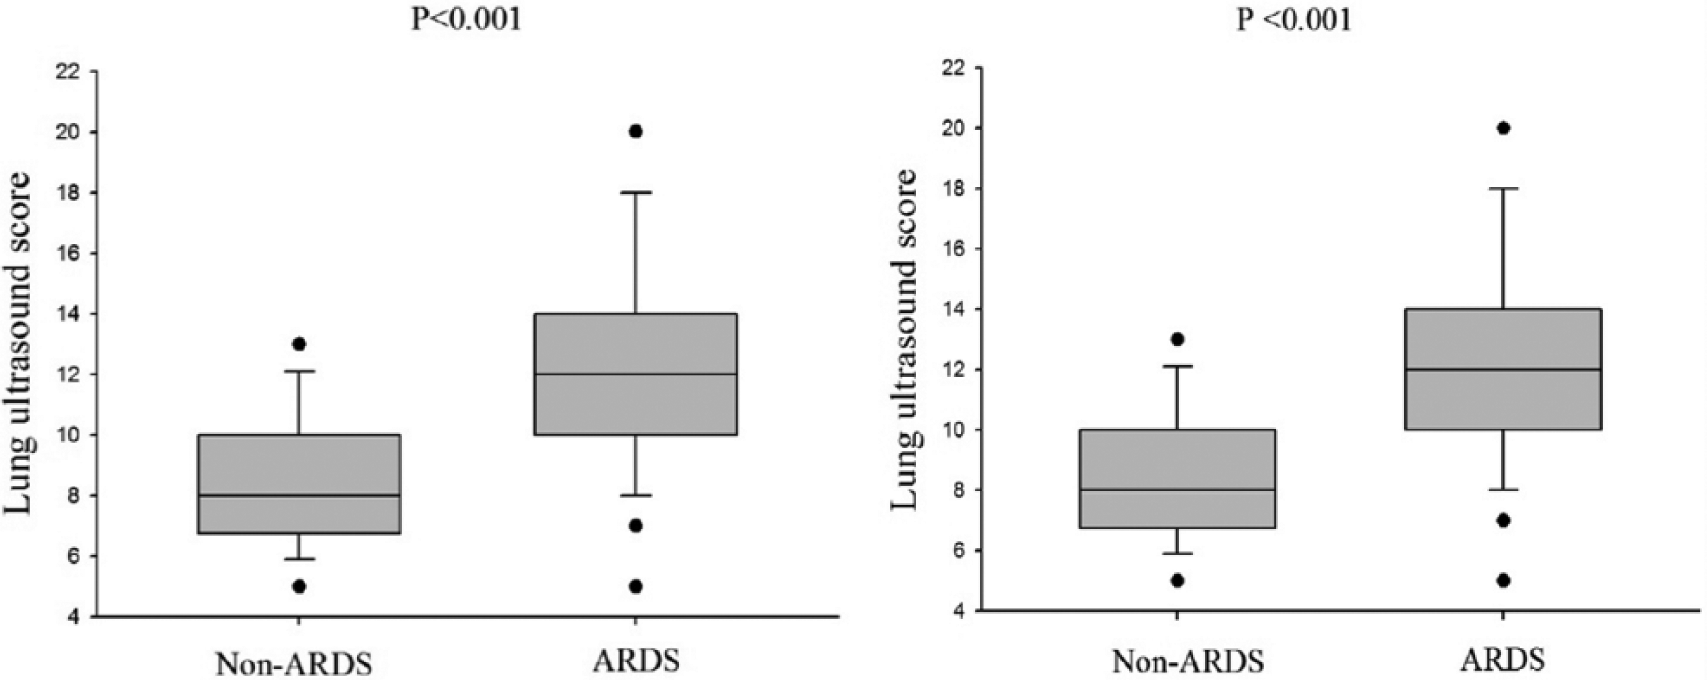
Evolution of median individual lung ultrasound score in patients with non-acute respiratory distress syndrome (ARDS) and ARDS on day 3 (left panel) and day 7 (right panel).
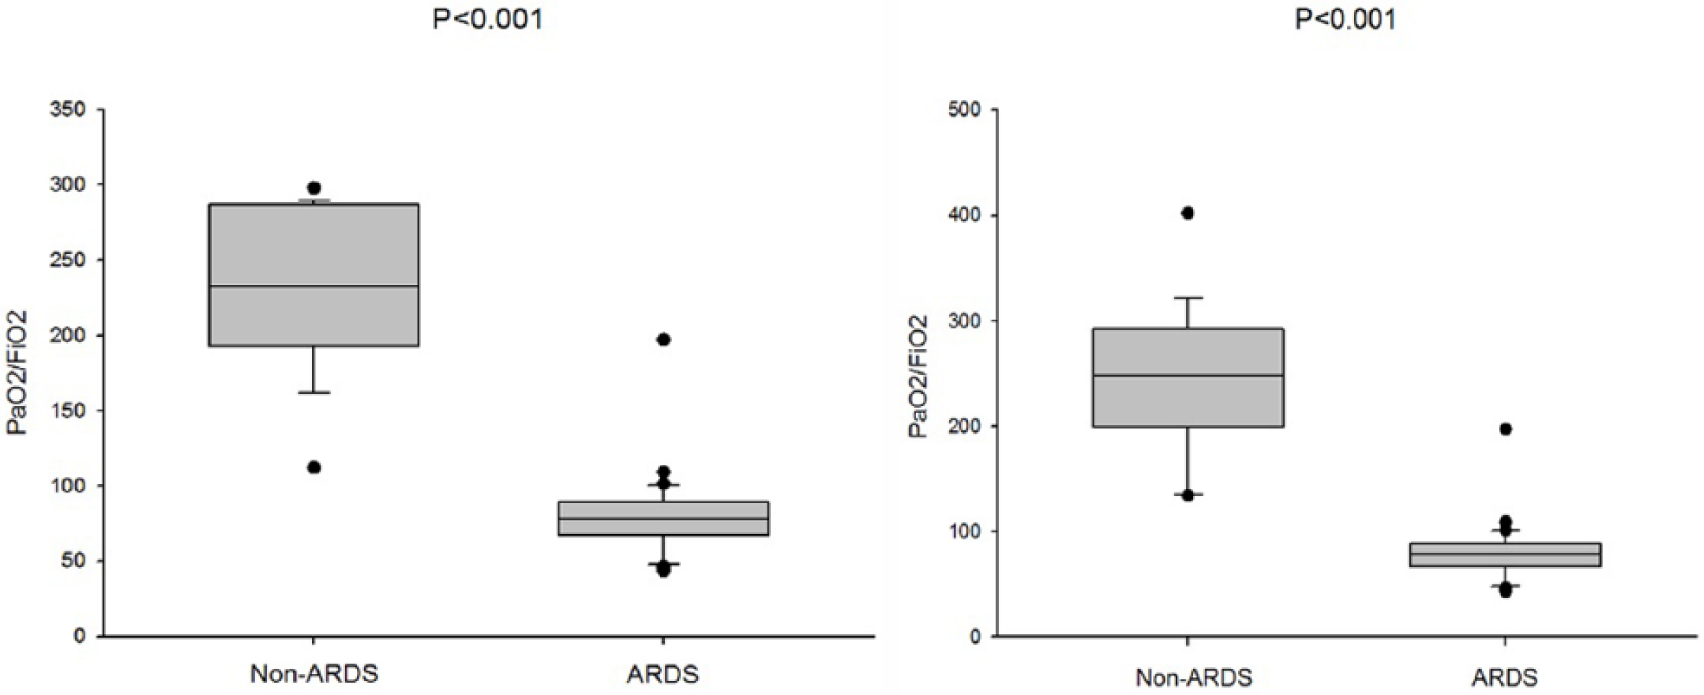
Evolution of median PaO2/FiO2 in patients with non-acute respiratory distress syndrome (ARDS) and ARDS on day 3 (left panel) and day 7 (right panel).
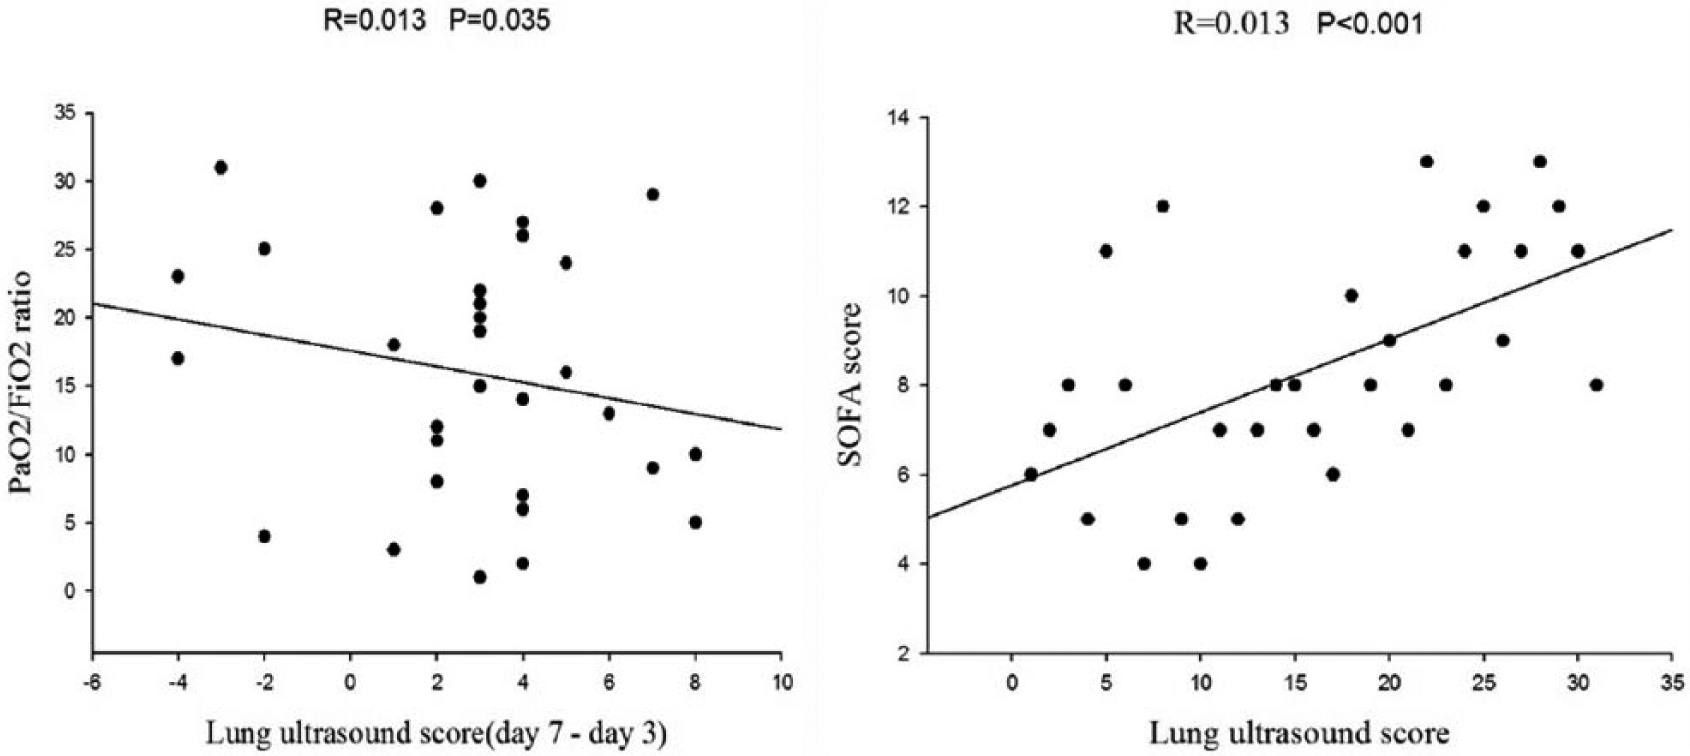
Left panel: correlation between changes in lung ultrasound score (LUS) and changes in PaO2/FiO2 ratio from day 3 to day 7. Right panel: correlation between LUS and Sepsis-related Organ Failure Assessment (SOFA) score.
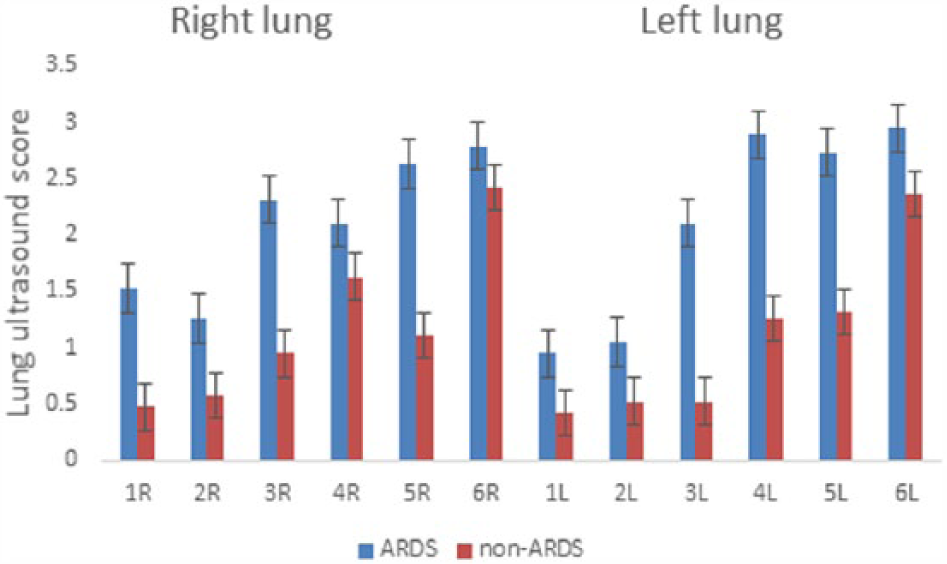
Regional distribution of lung ultrasound score on right and left lungs on patients with acute respiratory distress syndrome (ARDS) and non-ARDS on day 7. R = right lung, L = left lung; 1 = anterosuperior, 2 = anteroinferior; 3 = laterosuperior, 4 = lateroinferior; 5 = posterosuperior; 6 = posteroinferior.
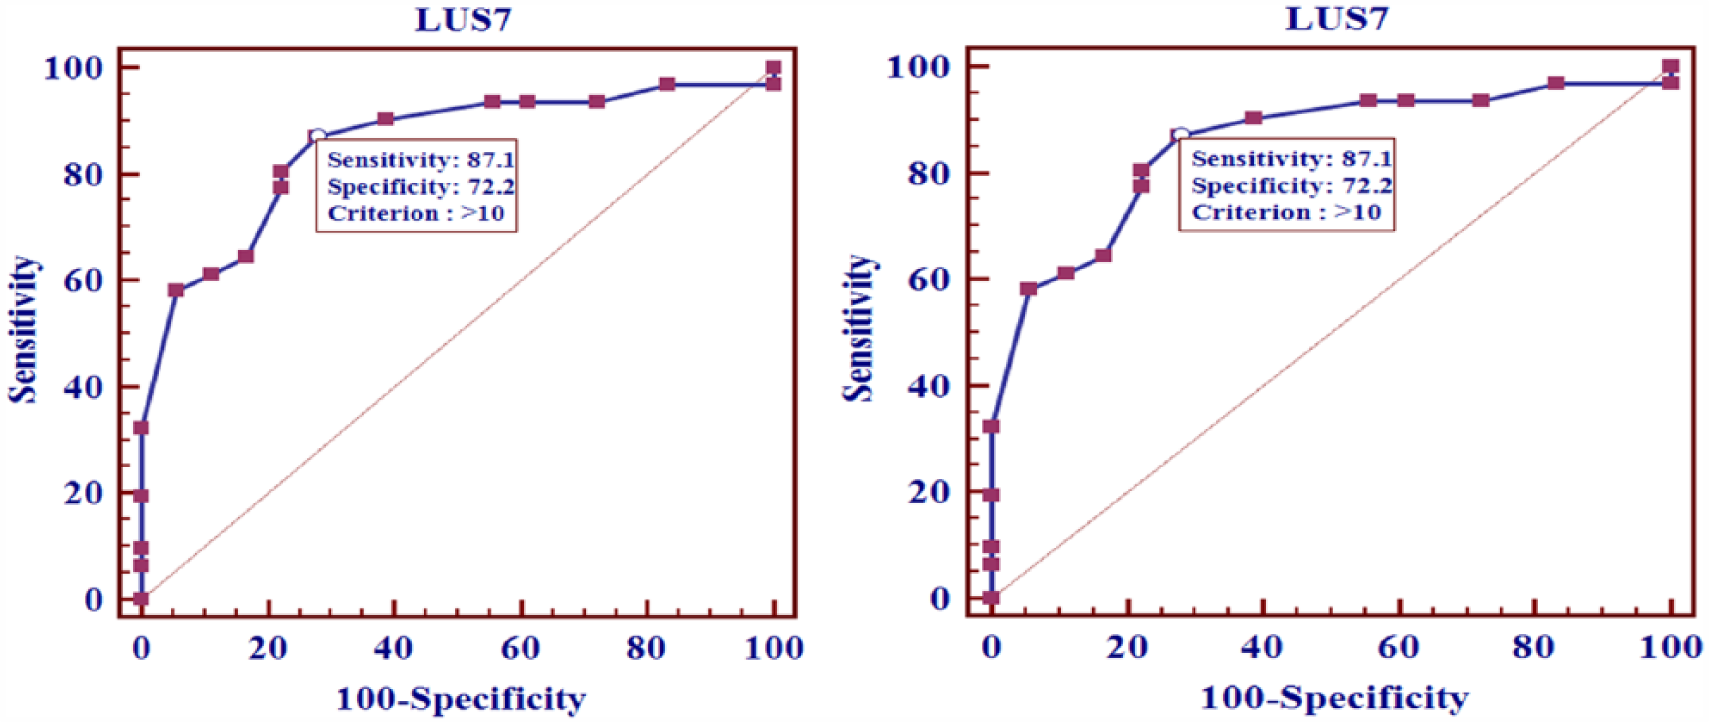
ROC curves of lung ultrasound score (LUS) and acute respiratory distress syndrome (ARDS) on day 3 and day 7.
Discussion
This is the first study to observe the lung aeration changes by transthoracic lung ultrasound in patients with paraquat intoxication. This study shows that LUS of the total and different regions’ assessment on non-ARDS patients was lower than ARDS patients, except the LUS of posterior regions. It also proved that there is a correlation between the changes in PaO2/FiO2 and LUS during the time from day 3 to day 7. The SOFA score and LUS on day 7 had significant correlation too. The ROC curve of LUS and ARDS on day 3 and day 7 showed a relatively high sensitivity and specificity. Such findings suggest that transthoracic ultrasound aiming at assessing lung aeration changes on patients with paraquat intoxication may help prediction of development of ARDS.
It is difficult to detect changes in lung aeration with paraquat intoxication by chest X-ray. 10 Computed tomography (CT) is the gold standard for assessing ARDS. Changes in CT images with regard to pleural effusion, pulmonary interstitial syndrome, and pulmonary consolidation clearly confirm the diagnosis of ARDS. 11 However, to perform a CT scan, the patient has to be transferred to the CT room. This transfer is dangerous for patients with unstable hemodynamics.12,13 However, transthoracic lung ultrasound has several advantages for assessing lung aeration. It is reliable and accurate,14,15 highly reproducible, 14 non-invasive, and easily repeatable at the bedside. Several studies have demonstrated that lung ultrasound is accurate for assessing positive end-expiratory pressure and prone position-induced lung recruitment,16–18 lung reaeration following antimicrobial therapy in ventilator-associated and community-acquired pneumonia, 19 and lung reaeration is associated with resolution of various forms of pulmonary edema.20–25
Limitations
The number of patients evaluated was small. The results of the present observational study obtained in 50 patients have not been validated prospectively. The ultrasound method has intrinsic limitations. Obese patients are frequently difficult to examine because of the thickness of the rib cage’s subcutaneous tissue. The presence of subcutaneous emphysema or large thoracic dressings precludes the propagation of ultrasound beams to the lungs and makes for difficult lung ultrasound examination. Like all techniques of ultrasonography, bedside lung ultrasound can be operator-dependent; however, a high intra- and inter-observer reproducibility was reported. 26 In this study, only experienced physicians performed ultrasound examinations. It has been shown that the learning curve to acquire skills in general lung ultrasound ranges from 3 weeks to 7 months depending on the level of expertise.27–30
Conclusion
Transthoracic lung ultrasound may serve as a useful tool for lung aeration assessment on adult patients with paraquat poisoning. LUS changes from day 1 to day7 suggest that it may help the attending physicians predict ARDS development, and even the mortality of these patients. Further studies are needed to evaluate the impact of this screening strategy on the weaning process and patient outcome.
Footnotes
Declaration of conflicting interests
The author(s) declared no potential conflicts of interest with respect to the research, authorship, and/or publication of this article.
Funding
The author(s) received no financial support for the research, authorship, and/or publication of this article.