
Abstract
Global value chain (GVC) analysis examines the distribution of value between lead firms and suppliers but overlooks profit leakage to actors outside GVCs, especially financial markets. We address this gap by integrating GVC analysis with the corporate financialization literature, examining value capture between shareholders, lead firms, and suppliers. Using S&P Capital IQ data, we analyze lead firms’ financialization of objectives, investments, operations, and value capture across four GVCs (apparel, automotive, copper, and coffee/cocoa) from 1993 to 2022. We show that GVCs serve lead firms as a “source of value” by lowering sourcing costs to increase profit margins and shareholder returns, and as a “source of liquidity,” extending supplier payment terms that enhance working capital. Overall, shareholders emerge as the main beneficiaries of GVCs. While issuing equity plays a minor role in financing lead firms, these firms sustain stock markets through large shareholder payouts, funded through the profits generated in GVCs.
Introduction
The expansion of global value chains (GVCs) and the increased size, scope, and impact of financial markets, broadly referred to as financialization, have been two key features of the global economy since the early 1980s. The GVC literature emerged in the 1990s to make sense of spatially and organizationally fragmented inter-firm networks. Already in the 2000s, it was acknowledged that financial markets and lead firms’ shareholder value orientation shape the governance of GVCs (Gibbon, 2002; Gibbon and Ponte, 2005; Palpacuer, 2008; Palpacuer et al., 2005). In turn, it was also acknowledged that globalization sustained financialization. Outsourcing and offshoring allowed for lower capital investments of lead firms and the creation of cost mark-ups, which financed high payouts to shareholders (Baud and Durand, 2012; Milberg, 2008; Milberg and Winkler, 2013). However, GVC research and its core conceptual toolbox have focused on lead firm strategies, inter-firm governance, and upgrading, which thus far has not integrated the relationship between financial markets and value capture along GVCs in a systematic way. As pointed out in the Handbook on Global Value Chains, “finance (…) tends to be both everywhere and nowhere in the literature on GVC governance” (Ponte et al., 2019: p. 135).
Answering questions about distributional outcomes between suppliers, lead firms, and financial markets can start with the toolbox of the corporate financialization literature. The corporate financialization literature provides insights into lead firms’ strategic orientations and resource allocation patterns. Emerging in the late 1990s, this body of scholarship argues that lead firms shifted away from retaining profits for reinvestment in long-term, “productive” activities, such as capital expenditures, workers, or research and development, toward prioritizing short-term objectives focused on satisfying global capital markets and expanding financial activities (Krippner, 2005; Lazonick and O’Sullivan, 2000). Yet, the analysis generally stops at the lead firm level, neglecting implications along GVCs on governance and value capture. Hence, while the GVC literature focuses on how lead firms govern supplier firms in GVCs, and the corporate financialization literature on how the internal governance of lead firms is shaped by financial markets, the mechanisms through which financialization dynamics at the lead firm level are transmitted to supplier relations, sourcing practices and value capture in GVCs, remain under-researched. Building on the existing literature, this paper addresses these gaps by asking: Which actors capture the value created in GVCs, and how and why does this change over time? We answer these questions by investigating (1) the ways in and degrees to which lead firms are subject to corporate financialization, and whether and why there is variation; (2) the ways in which corporate financialization shapes how lead firms organize GVCs and govern suppliers; and (3) the impact of corporate financialization on value capture between shareholders, lead firms, and suppliers.
To this end, we present a conceptual framework that captures the relationships between capital markets, lead firms, and suppliers along two distinct financial flows (value, liquidity) and how these relationships are mediated by GVC governance. We identify three strands of the “financialization of global production” literature from which we draw conceptual insights for our framework: The corporate financialization literature, the GVC/global production networks (GPNs)-financialization nexus, and empirical sector studies. The specific focus of our framework is to provide causal transmission lines that explain value capture between financial market and GVC actors, based on shifts in global industries, which shape lead firms’ mark-up capacity, and shifts in macro-financial environmentss, which shape lead firms’ financing and payout strategies. Methodologically, we adapt the “interlocking balance sheets” approach by Kim and Shin (2012), using the S&P Capital IQ database to analyze financialization indicators (of objectives, investments, operations), financing structures, and two value capture relationships (of stock markets vis-à-vis lead firms, and lead firms vis-à-vis suppliers) from 1993 to 2022, covering the rapid expansion and deepening of GVCs. Empirically, we focus on a comparative analysis of four GVCs—two manufacturing industries (apparel with lower technology-intensity, automotive with higher technology-intensity), one capital-intensive mining industry (copper), and one agriculture GVC (coffee/cocoa).
We find that (1) corporate financialization patterns vary over time, across sectors and firms, linked to industry-specific mark-up capacities of lead firms and macro-financial environments; (2) two patterns are constant across all GVCs: lead firms leverage their supply chains as a “source of value” (expansion of supplier cost mark-ups that allows for higher shareholder payouts) and as a “source of liquidity” (extension of supplier payment terms that allows for expanded working capital); (3) shareholders have become the “main beneficiaries” of GVCs, due to a specific constellation of globalized production and global financial market dynamics that emerged during the 2000s and 2010s: high profit capacity of lead firms through GVC mark-ups and cheap bond financing, combined with low equity issuance, produced a constellation in which value created in GVCs is captured by shareholders through large dividend payments and share buybacks. We call this mechanism a “net value drain” from GVC actors to shareholders, in which lead firms (through their GVCs) fund stock markets. In the next section, we develop our conceptual framework based on a discussion of the “financialization of global production” literature. We then present the methodology. Next, we illustrate the results of the financial statement analysis, which are discussed in the penultimate section. The final section concludes.
Literature review and conceptual framework
The corporate financialization literature
The seminal literature on corporate financialization emerged in the early 2000s, seeking to explain substantial transformations in business practices among non-financial firms (NFCs) throughout the 1980s and 1990s (Froud et al., 2006; Krippner, 2005; Lazonick and O’Sullivan, 2000; Stockhammer, 2004). The basic proposition was that the nature and strategy of NFCs had changed as a response to financial market deregulation that empowered shareholders vis-à-vis corporate executives, interest rate hikes, and competitive pressures. Baud and Durand (2012, p. 243-244) established the influential classification of financialization by objectives, investments, and operations. Financialization of objectives refers to the adoption of shareholder-value norms, resulting in increased financial flows from NFCs to the financial sector. Financialization of investment denotes the growing share of financial assets held by NFCs. Financialization of operations describes the pursuit of financial gains by NFCs through routine transactions conducted primarily with their stakeholders, including lead firm relations with suppliers and workers. Methodologically, this work built on firms’ balance sheet analysis.
Lazonick and O’Sullivan (2000) theorized the financialization of objectives as a shift from “retain and invest” to “downsize and distribute.” The Chandlerian (vertically integrated) corporation, where the key imperative was sustaining market growth by re-investing profits, was replaced by focusing on core competencies and outsourcing less profitable activities and assets. Beginning in the 1980s, corporations in the United States (US) increasingly remunerated executives via stock options and transferred an increased amount of their profits to shareholders, while cutting back on employee expenditures, creating a “capital class” consisting of shareholders and managers (Lazonick and Shin, 2019). Regarding financialization of investments, some authors (Krippner, 2005) argued that NFCs transformed towards becoming financial investors by shifting their investments from tangible to financial assets. They found that US corporations’ profits generated from stocks, bonds, and interest income increased from 10% in the 1980s to 40% by the turn of the millennium (Orhangazi, 2008).
Recent scholarship has challenged the foundational literature on corporate financialization on several fronts. A first critique stems from the fact that studies with larger, heterogeneous firm sets show that financialization is not a linear “master process” (Rabinovich, 2019; Reddy and Rabinovich, 2025). Instead, there is variation on different levels: First, there is variation among financialization indicators. A study by Soener (2021) covering the largest 37 national economies for 1991–2017 documents recurring drops in the share of financial assets and profits across the mid-1990s, the early 2000s, and the 2010s, attributing these fluctuations to the dependence of financial income on interest rate levels.
Second, despite the promotion of “shareholder capitalism” as the global growth model, corporate financialization varies across jurisdictions. US firms have the highest payout ratios and remunerate their shareholders mainly via share buybacks, whereas European firms focus on dividend payments (Sakinc and Gleadle, 2025). This is linked to regulation (stronger restrictions on share buybacks in the European Union (EU)) and tax structures (lower capital gain taxes in the US). There are a few countries where transnational corporations are headquartered in which corporate financialization is limited (e.g., Japan; South Korea; China; Vogel, 2019). Research on Global South economies has grown since the 2010s. This work demonstrates significant variation in financialization indicators across Global South countries (Karwowski, 2020), underscores the subordinate position of emerging economies within a hierarchical global financial and monetary system and their exposure to macroeconomic and exchange rate risks (Bonizzi et al., 2022), and shows how corporations in the Global South actively engage in “subordinate financialization,” for example, by buying dollar-denominated assets, to hedge against these risks (Kaltenbrunner et al., 2024).
Third, there is variation across sectors. Based on detailed empirical sector and firm case studies, Froud and colleagues (2006) showed that the ability of corporate executives to remunerate shareholders was linked to an industry’s profit capacity. Recent contributions show that payout levels to shareholders tend to be specifically high in sectors such as pharmaceuticals or among Big tech companies, where “superstar” firms generate substantial profits (Valeeva et al., 2023).
Fourth, the nature of corporate financialization has changed over time. Auvray and colleagues (2021) distinguish between two phases of financialization. In the first phase (1980s, 1990s), the empowerment of the financial sector, pressure to increase shareholder payouts, higher interest rates, and heightened competition reduced investments in capital expenditures and research by corporations. Low investment levels of lead firms were thus the consequence of payouts to the financial sector. The situation changed around the turn of the millennium where the Agreement on Trade-Related Aspects of Intellectual Property Rights (TRIPS) regime created conditions conducive for intellectual monopolies, and China’s entry into the World Trade Organization (WTO) reduced costs in supplier markets, in addition to low interest rates. These dynamics created the conditions for lead firms’ “super profits” that could be sustained without significant investments, and shareholder payouts have become the principal destination of these profits (Auvray et al., 2021).
The corporate financialization literature demonstrates that industry-independent factors play a crucial role in how lead firms access and utilize financial resources. National financial market structures, tax regulations, global interest rate dynamics, and the evolution of these factors over time shape lead firms’ payout levels to shareholders, their methods of shareholder remuneration, and their financing choices (e.g., stock issuance vs bond issuance). We refer to this set of factors, highlighted by corporate financialization scholars, as the “macro-financial environment” and will return to it in when discussing the conceptual framework at the end of this section.
The GVC/GPN–financialization nexus
Another strand of the literature aims to link the impact of financial markets on globalized production, addressing directly the GVC/GPN literature. The first to theorize the globalized production-financialization nexus and its distributional impact along GVCs on a macro level was Milberg (2008; Milberg and Winkler, 2013). Their basic proposition was that globalization became the key source of profits among US corporations, while financialization in terms of shareholder payouts became the preferred use of profits. They show the drastic import price deflation across a range of goods in the US, which created high cost mark-ups 1 for US firms, that were transferred to shareholders. Thus, global disaggregation of production and value extraction particularly in the Global South have been key drivers and sustainers of financialization in the Global North (Baud and Durand, 2012; Durand and Milberg, 2020).
On a meso-level and within the GPN literature, the GPN 2.0 framework (Coe and Yeung, 2015) explicitly includes the role of financial markets in influencing and disciplining the organizational forms and spatial articulations of globalized industries. “Financial discipline” is understood as the pressure to satisfy global capital markets through raising share prices and meeting profitability targets. The expansion and deepening of capital markets provided lead firms with more financing options, but it also entailed fulfilling short-term financial objectives and expectations, pushing lead firms to focus on extracting financial value from high-yield activities/core competencies (branding, marketing) and assets (i.e., financial assets and acquisition of new businesses).
Another concept within the GPN literature is global financial networks (GFNs) (Coe et al., 2014; Haberly and Wójcik, 2022). GFNs emphasize the multifaceted role of finance with a focus on financial institutions and actors that operate outside GPNs but are central in mediating inter-firm and firm-finance relationships. Geographically, GFNs are clustered around global financial centers and offshore jurisdictions, comprising banks, insurance companies, asset managers, and advanced business services such as equity analysts and credit rating agencies.GFNs finance GPNs (providing new forms of liquidity), but they also “financialize” GPNs by introducing financial market practices (e.g., credit and financial performance ratings). Considering the deeply interwoven relationship between finance and production, global production-financial networks (GPFNs) aimed to overcome this GPN-GFN divide by studying financial and “physical” actors’ strategies in a more interrelated fashion (Grote et al., 2024). At the core of GPFNs are “world governments,” defined as the most powerful states and intergovernmental organizations, which support lead firms by providing sovereign protection for their global productive and financial investments through trade, investment, and financial agreements, as well as coercive tools such as sanctions.
Global wealth chains (GWCs) (Seabrooke and Wigan 2014, 2022) and the related concept of global inequality chains (GICs) (Quentin and Campling 2018) are centered around lead firms’ financial and legal strategies to store wealth that was created in GVCs. GWCs highlight the role of law, taxation, and accounting in financial engineering (Seabrooke and Wigan, 2014).
In particular, the concept of GWCs allows us to trace the concrete mechanism through which lead firms store and distribute value through mechanisms such as intra-group transfer pricing and legal arbitrage. At the same time, this conceptualization of distributional outcomes along GWCs is mainly focused on the level of Global North national economies and lead firms, and there is less emphasis on dynamics of production and value creation. Therefore, the causal transmission lines that explain value capture between financial markets and GVC actors are missing. Recent work on “entangled GVCs and GWCs” advances these contributions by analyzing firm strategies towards value and wealth creation and accumulation, and the tangible and intangible assets underpinning this process, in a combined fashion (Bair et al., 2023; Wigan et al., 2024). In line with the nascent literature on “entangled GWCs and GVCs,” the framework that is presented in this paper seeks to address this gap by tracing distributional outcomes from production/value creation to value storage and (final) distribution.
Corporate financialization across sectors
There is a range of empirically centered contributions at the sector/GVC and firm level that analyzes how financialization translates into lead firm strategy, governance, and uneven distribution of gains, costs, and risks along specific GVCs. Across manufacturing GVCs, industry configurations are centered around powerful buyers that have increasingly outsourced production to supplier networks, including large “contract manufacturers” that can fulfill their increasing requirements. Lead firms are generally wholesalers or retailers, branded marketers, or branded manufacturers, which capture most value from post-production activities such as marketing and distribution.
In the apparel sector, most contributions found that fashion brands and retailers “squeezed” suppliers to sustain shareholders payouts, but financialized sourcing practices vary by firm ownership and location, and overlap with non-financial considerations. Gibbon (2002) highlighted that profitability-improving strategies of retailers (e.g., supply chain rationalization) were initially targeting high supplier turnover. Pricing strategies to achieve profitability targets were mainly applied by publicly listed lead firms from more financialized economies (UK) and less prevalent for family-owned retailers in less financialized economies (France, Sweden) (Palpacuer et al., 2005). Finally, financial market pressures have led to shifting costs and risks onto suppliers, through extending payment terms to suppliers and “forced funding” (Baud and Durand, 2012), or canceling orders (Anner, 2022).
For electronics, most contributions found that financialization was a key driver of outsourcing capital-intensive and risky manufacturing operations to contract manufacturers, which helped sustaining shareholder payouts. The emblematic example is the relationship between Apple and its major contractor Foxconn, in which Apple obtained super profits while Foxconn internalized higher costs for inputs, wages, and short-term order changes, while receiving stagnant prices (Froud et al., 2014). Yeung (2022, p. 101) argues that the key reconfiguration of the microelectronics industry in the 1990s, the split-up between chips design and manufacturing, was substantially driven by “financial discipline,” as US fabless chip design firms outsourced their production to a few highly capable East Asian contract manufacturers which drew on more patient capital.
In automotive, major automakers outsourced key functions in design and research to strategic first-tier suppliers throughout the 1990s (Jacobides et al., 2016; Sturgeon et al., 2008). Do Carmo and colleagues (2019) show that top Original Equipment Manufacturers (OEMs) from East Asia, Europe, and the US have increased dividends since the early 2010s. What is unique among automotive firms is that car leasing models offered by OEMs generate a significant stream of (financial) profits (Froud et al., 2006). More recent contributions found that Electric Vehicle (EV) manufacturers, with Tesla at the forefront, have strategically crafted narratives on future revenue and profit growth towards capital markets and equity analysts resulting in mushrooming valuations (Klinge et al., 2025).
Agriculture GVCs are dominated by retailers, food manufacturers, and international commodity traders which occupy large market shares in the downstream segments. Further, the provision of key inputs for food production—industrial machinery, seeds, pesticides, and fertilizers—is concentrated in the hands of a small set of firms (Clapp, 2025). The food systems literature has discussed the role of financial markets and actors in food systems, and identified financialization as a key characteristic of the “third food regime” (Burch and Lawrence, 2009; Clapp, 2014; Isakson, 2014; Pritchard, 1998). Contributions have paid particular attention to three dynamics: the increased presence of financial actors (e.g., hedge funds, private equity funds, and index investors) in physical commodity sectors, with agriculture commodities and land becoming an own asset class (Ouma 2014); the changing role of agriculture lead firms in terms of financialization of objectives (for cocoa, Van Huellen and Abubakar, 2021) and investments (for commodity traders, Baines and Hager, 2022); and the increasing role of complex and volatile derivative markets as the central pricing institution in commodity GVCs. Financial derivative markets generally increased price risks for actors with limited access to financial hedging instruments, including producer country governments and smallholders (Bargawi and Newman, 2017; Staritz et al., 2018, 2022).
In mineral and oil/energy GVCs, lead firms, called “majors,” mainly focus on extraction, refining, and (in some cases) trading. “Suppliers” are equipment, technology, and services firms, but also artisanal miners particularly in the Global South. “Juniors” are little-capitalized and highly financial market-dependent firms engaged in exploration. The financialization of extractive GVCs has two specific features: Long lead times, capital-intensity, and high exploration and extraction risk create heavy dependence on equity and bond financing. Due to changing demand and price cycles and related boom and bust phases, the role of financialization changes. De los Reyes (2017), Bowman (2018), and Parker and colleagues (2018) find that across the gold, platinum, and coal industries, extraction booms stimulate expansion of production capacities, (high-risk) acquisitions, and shareholder payouts. Once demand decreases, the boom behavior turns into excess capacity, vulnerability, and financial fragility, including cost cutting-measures to sustain shareholder payouts. Commodity derivative markets are also central to price-setting in extractive GVCs, more recently also emerging for “critical” minor metals such as cobalt and lithium, adding another layer of financial market-GVC relations (Baines and Hager, 2022; Bridge et al., 2010; Grote et al., 2024; Staritz et al., 2024).
Synthesis of the literature
These three strands of the “financialization of global production” literature provide important theoretical and empirical insights on the relationship between corporate financialization and GVCs. Yet, the causal transmission lines between financial and GVC actors and how they impact uneven value capture along GVCs remain under-researched. The corporate financialization literature offers a methodological toolbox to measure shifts in the source and allocation of financial resources of lead firms based on analyzing lead firms’ financial stocks and flows. The application has however been largely limited to large (publicly listed) Global North firms, and we know little about transmission lines along these firms’ supply chains. Thus, the analysis stops at the lead firm level, and developments within GVCs remain largely a “black box.” The different approaches on the GVC/GPN-financialization nexus provide important insights into corporate strategies of financial engineering, the role of financial actors across different locations and jurisdictions, and capital market pressures. However, these contributions primarily focus on distributional outcomes at the level of the national economy or the lead firm, without tracing how value is distributed along GVCs. Empirical studies on specific GVCs in turn show how corporate financialization plays out across different sectors and firms, highlighting the transmission lines such as industry-specific practices and institutions in directing and mediating financialization processes. Yet, these contributions generally do not link the case study findings to more generalizable patterns across global industries and industry-independent variables (e.g., macro-financial environments) and therefore largely remain in a theoretical vacuum.
Conceptual framework
For the specific aim of our contribution—tracing and explaining uneven value capture between financial markets and actors along GVCs—we build on these seminal contributions and synthesize them, proposing an integrated framework that links the relationships and distributional outcomes among key actors (financial actors, lead firms, suppliers) to global industry and financial market dynamics. Thus, within the larger realm of the relationship between “finance” and “production,” our principal research question is: which actors capture the value created in the global value chains, and how and why does this change over time? We seek to answer this question by (1) measuring and explaining the (uneven) value distribution along GVCs (between lead firms and suppliers) and their extension to financial/capital markets; (2) identifying transmission lines through which value (defined as profits) is created and captured; and (3) specifying sector- and context-specific yet generalizable casual drivers within global industries and financial markets that explain the articulation of value capture over time. Thus, the framework considers macro-financial and industry-specific dynamics along GVCs, goes beyond firm-level case studies, is comparative across sectors, firms, and countries, and explains outcomes through the articulation of two key causal drivers.
Figure 1 illustrates the conceptual framework through which we trace the causal links between corporate financialization processes, GVC governance and sourcing practices, and (uneven) value capture between financial markets and GVC actors. The framework is actor-centered, focusing on financial actors, lead firms, and supplier firms (gray boxes in middle). The framework presented in this section also encompasses workers. However, the data analyzed in the following sections do not address value distribution among workers, as the S&P Capital IQ database does not provide a means to measure the value captured by workers in supplier firms. These actors interact through governance mechanisms that are mediated through power relations (blue arrows on right side). The distributional outcomes are articulated in two channels—flows of value (defined as interrelated chain of profits) and liquidity (defined as interrelated chain of working capital, which in turn represents current assets minus current liabilities) (blue arrows on left side). We identify two sets of external conditions, which shift over time (dark gray boxes on left side): global industry dynamics that shape the mark-up capacity (relative profits of lead firms vis-à-vis actors in supply chain, Variable A) and thus how flows of value and liquidity articulate between lead firms, suppliers, and workers; and the macro-financial environment (financial market liquidity, interest rates, country-specific regulations, and institutions) that shapes the nature and degree of lead firm financing and payout patterns (Variable B). Notably, we emphasize that these two variables are not deterministic; how they play out along GVCs is mediated by the agency of actors, including (idiosyncratic) lead firm strategy, but also states, suppliers, and workers. Conceptual framework: Flows of value and liquidity, governance, and value capture along GVCs.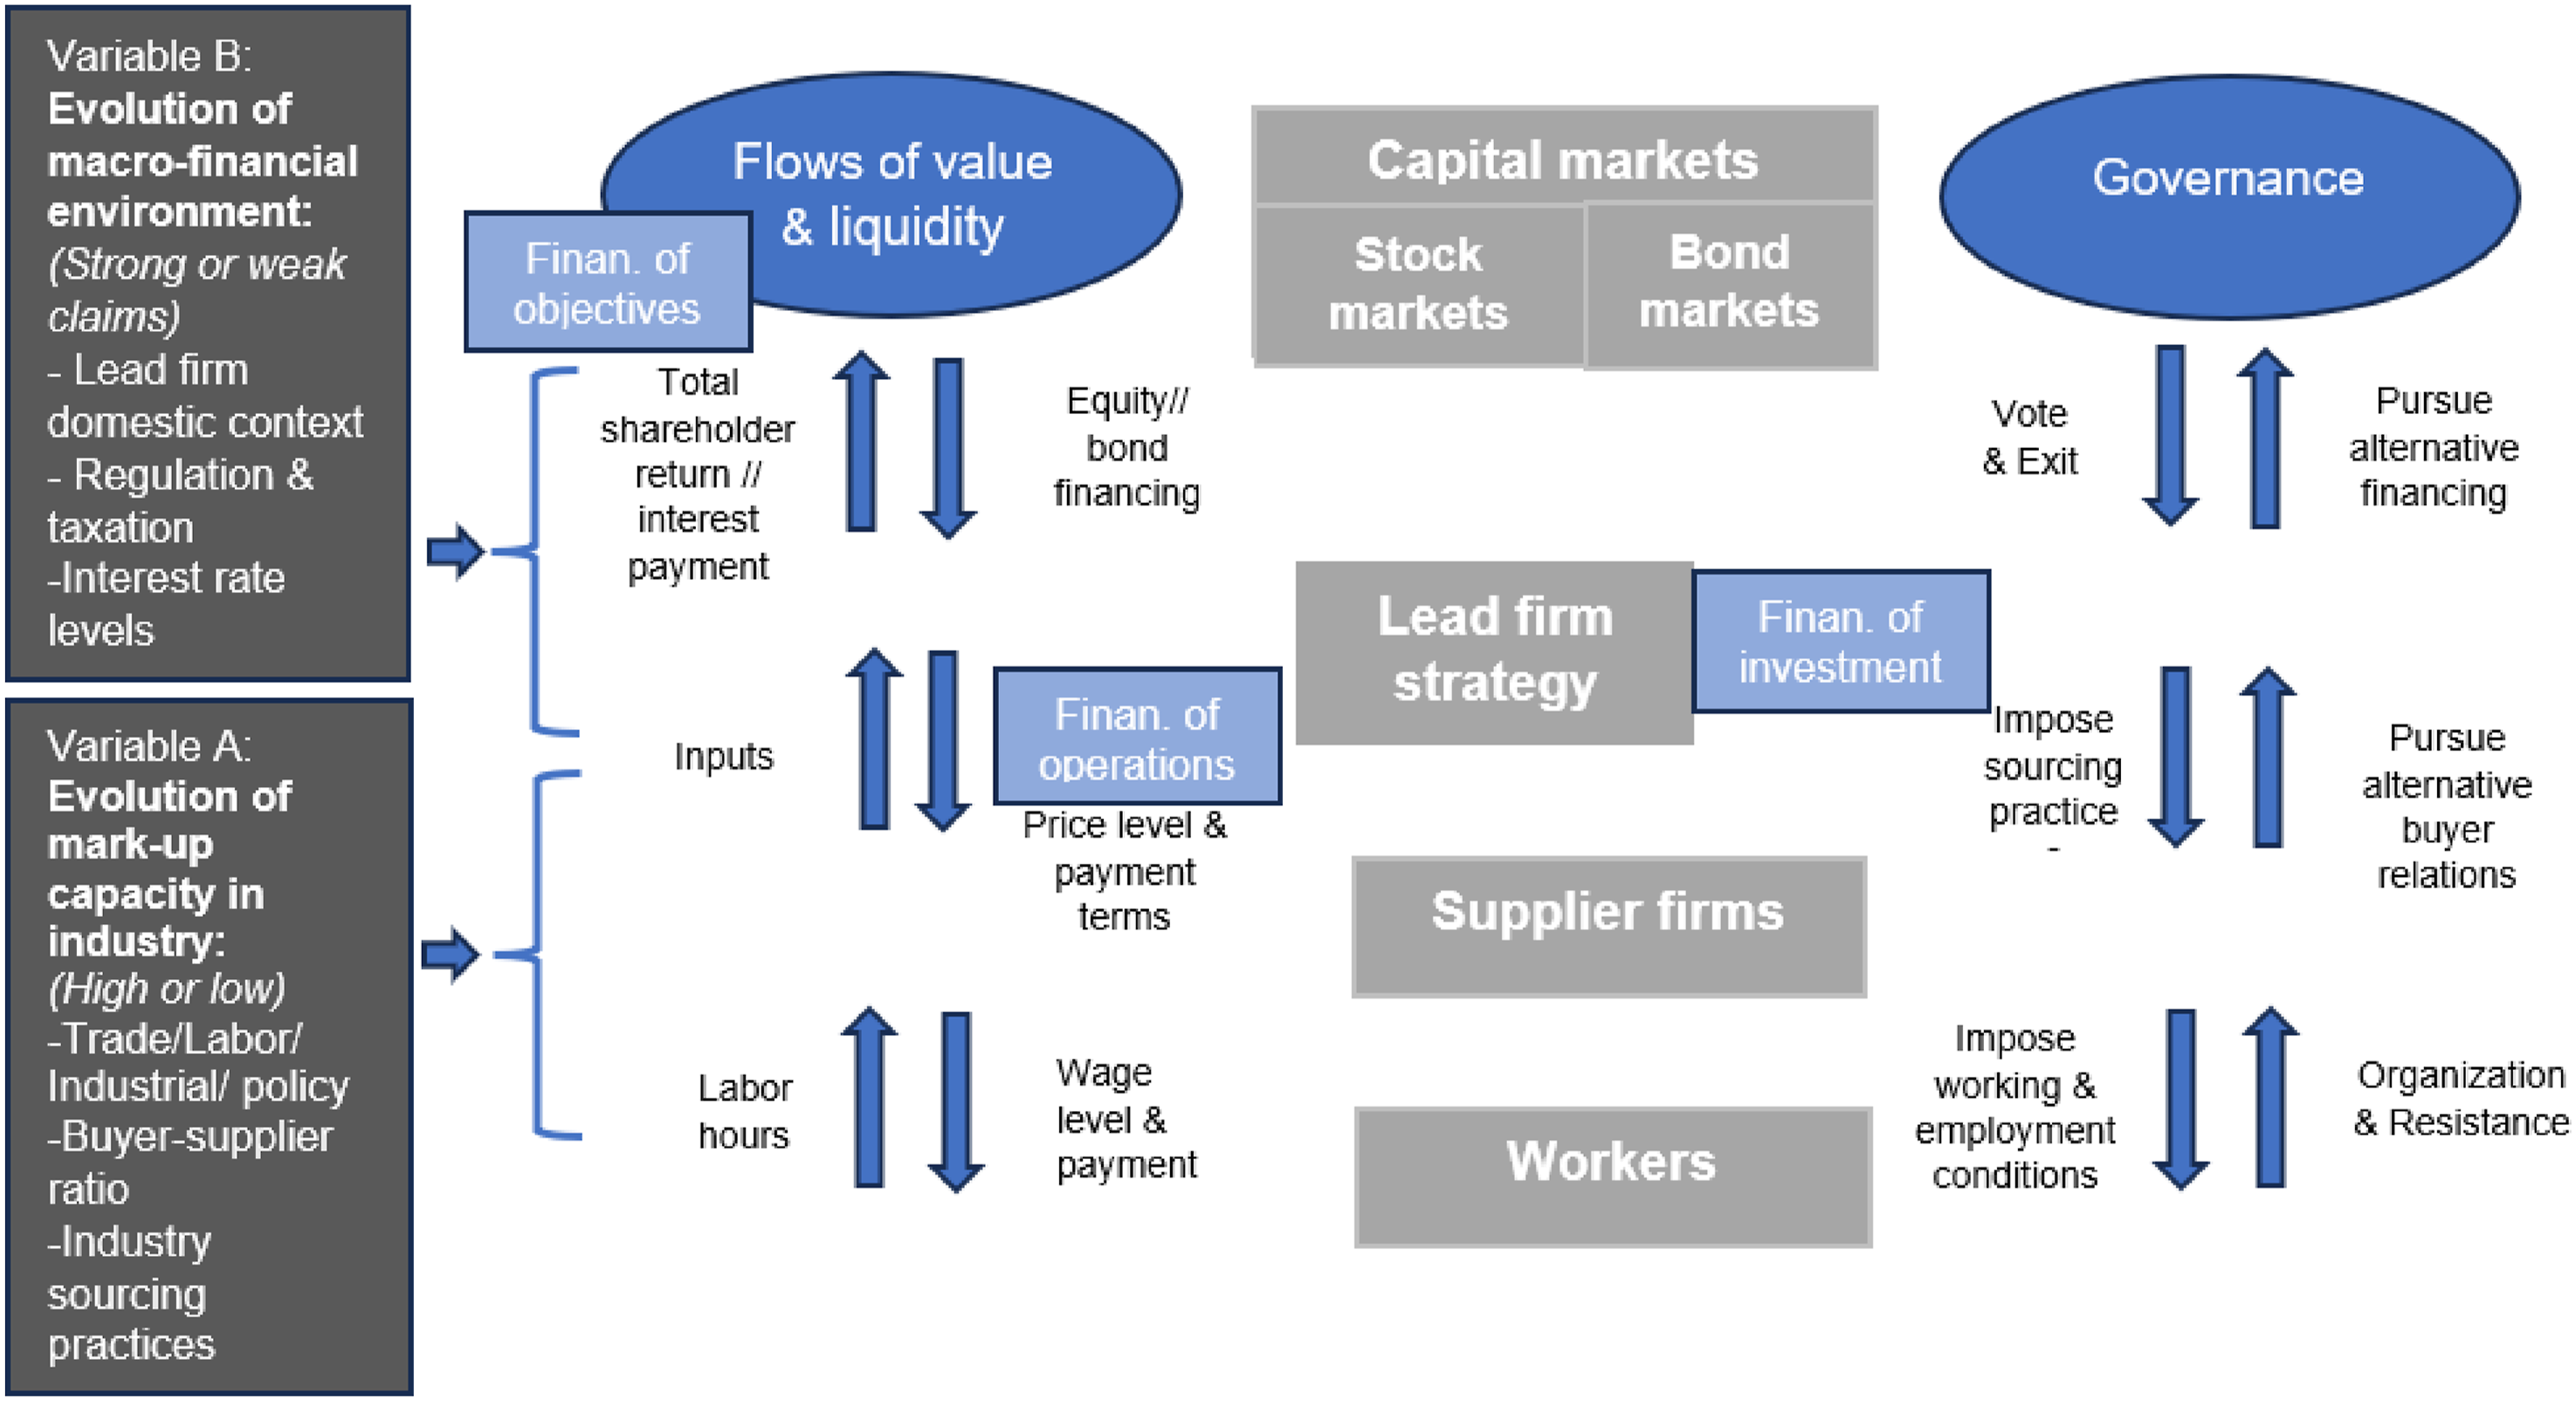
Central to the relationship between financial markets and lead firms is the provision of finance by capital markets, which expect a return on their assets. Lead firms can issue stocks, for which shareholders expect “total shareholder return” (TSR), that is, share price appreciation and dividend payments. If lead firms issue bonds, bondholders require interest payment. An increased flow to capital markets via measures to advance TSR (dividends, share buybacks) and interest payments indicates a “financialization of objectives” (light blue box, top left). Shareholders and bondholders can influence lead firm strategy by threatening to “exit,” that is, sell lead firm assets and—in case of shareholders—to “vote” on lead firms’ general annual meetings. Lead firms in turn can aim to pursue alternative financing through banks or internal means.
The lead firm-supplier relationship is centered on the exchange of inputs in return for a sourcing price for particular volumes and qualities. The price level and payment terms impact the flow of value and liquidity along GVCs. Prices define lead firm mark-ups towards suppliers, that is, how much value they can extract from the supply chain, which forms the basis for payments to financial markets. Payment terms are central for lead firms’ working capital management, as extending payment terms towards suppliers allows using supply chains as a “source of liquidity” (“financialization of operations,” light blue box, bottom left). As an alternative strategy, lead firms can engage in the purchase of financial assets (“financialization of investments,” light blue box, center). But the profitability of this strategy is based on the macro-financial environment, given that interest rate levels define how lucrative financial investments are. Finally, flows of value and liquidity articulate between suppliers and their workers. Recent scholarship suggests that delayed payments and order cancellations by lead firms to suppliers are linked to postponed or canceled wage payments to workers (Anner, 2022; Cushen and Thomsen, 2016).
How the flows of value and liquidity are articulated within these transactions is defined by two external conditions. The first variable is lead firms’ mark-up capacity, that is, their ability to leverage their supply chain and hence extract value and liquidity. This is shaped by the buyer-supplier ratio (high or low) (Bair and Mahutga, 2023), based on trade and industrial policy (which can support or limit the number of suppliers) and labor regulations in supplier countries (that increase or decrease sourcing prices), and related sourcing practices (e.g., price benchmarks and industry conventions). The second variable is the macro-financial environment, which defines the pressures and distributional claims from capital markets vis-à-vis lead firms, financing costs on capital markets, and the strategies through which lead firms use and respond to capital markets. Three distinct features decide on whether there are “stronger” or “weaker” claims of capital markets on lead firms’ supply chain mark-ups: the institutional context in lead firms’ country of origin; tax regimes and payout regulations, which incentivize or limit certain types and levels of shareholder remunerations; and the level of interest rates for corporate bonds, defining financing costs and related net profits available to distribute to shareholders.
Methodology
Our methodology is based on the analysis of financial statements of the largest ten publicly listed lead firms (by 2022 revenue) in four GVCs (apparel, automotive, copper, and coffee/cocoa), during the period 1993 to 2022 (for a firm list, see Appendix Table 1). Financial statements capture financial stocks and flows and mirror the financial relationships between lead firms, their shareholders, bondholders, and suppliers. This analysis is inspired by Kim and Shin (2012), who conceptualize inter-firm financial connections in the global economy as a set of “interlocking balance sheets.” This approach allows analyzing the global economy as a set of actors (financial firms and NFCs) that are integrated into a matrix of balance sheets, tracing the streams of short- and long-term financing instruments as well as payment claims and obligations (“liquidity,” visible in cash flow statements and balance sheets) but also the income that is captured by different actors (“value,” profits in income statements and shareholder payouts in cash flow statements). While Kim and Shin use this method to identify supply chain and systemic risks, we adapt it to trace flows of value and liquidity to analyze distributional outcomes across financial (shareholders, bond holders) and non-financial actors (lead firms, suppliers), moving beyond a divide between the “productive” and “financial” spheres.
Indicators on financialization and value capture.
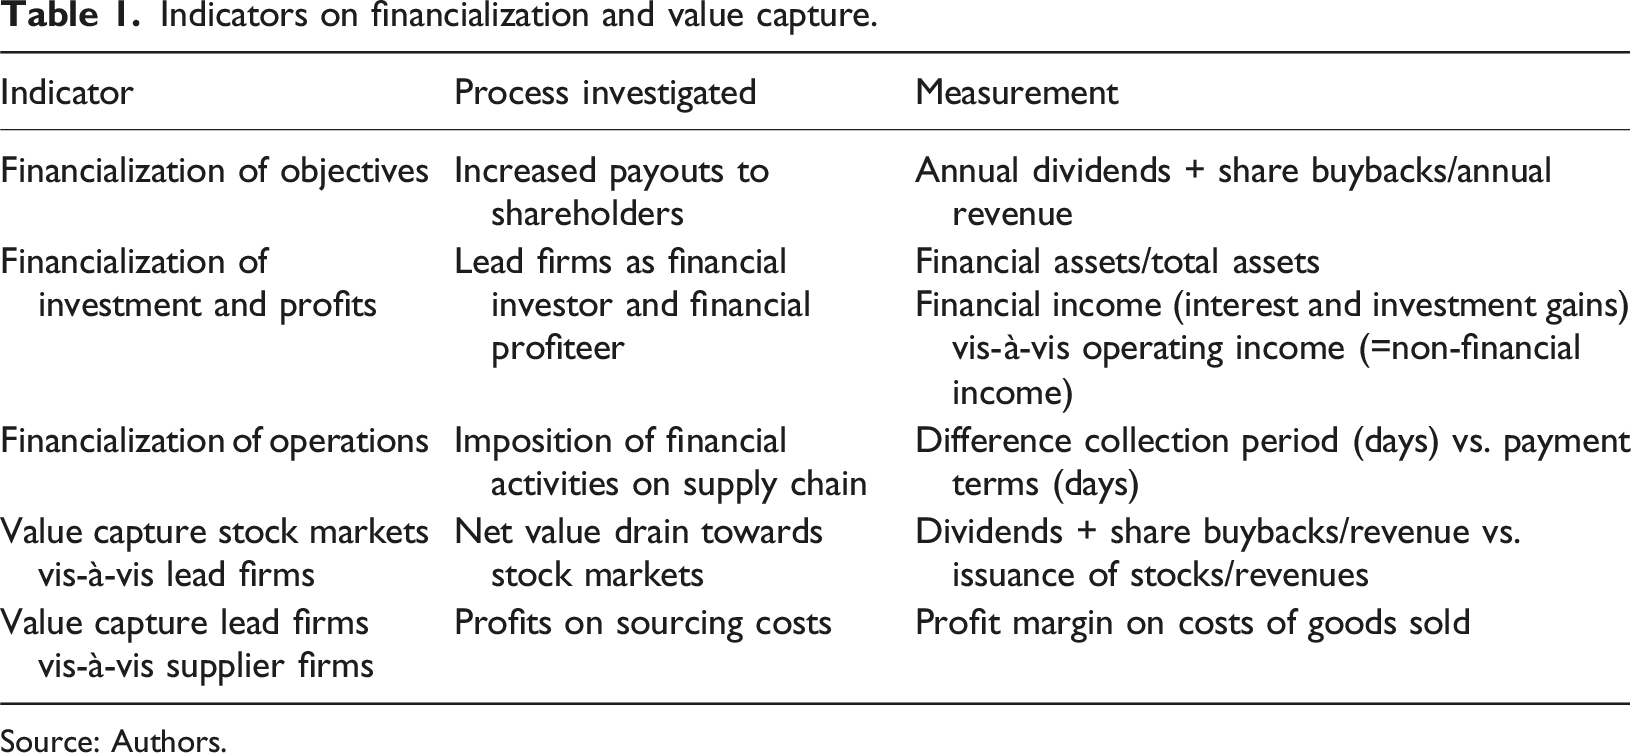
Source: Authors.
We collected this data from the S&P Capital IQ database, which synthesizes the annual financial statements of publicly listed corporations. There are three main challenges in using this dataset: First, data is presented at a consolidated firm level, hence measurements such as “gross margins” of lead firms serve as a proxy for average profits vis-à-vis all suppliers, but they cannot be broken down for specific suppliers. Second, we illustrate and analyze data in terms of industry averages among the largest 10 firms. This allows us presenting the indicators in a comprehensive manner and identifying and comparing patterns and shifts across industries. In cases where significant intra-industry differences occur, we highlight this however. Third, the S&P Capital IQ database does not provide information on suppliers’ wage levels or payment terms to workers, so we were unable to include workers’ value capture in the analysis. The database results are further complemented with a qualitative analysis of key characteristics of and developments in the four GVCs, drawing on long-standing research, including own field research of the authors in three of the sectors (apparel, copper, and coffee/cocoa) during the period 2019–2024.
Financialization and value capture across GVCs
This section presents the results of the financial statement analysis for the period 1993–2022. It compares the financialization of the top 10 lead firms in the apparel, automotive, copper, and coffee/cocoa sectors (presented at an aggregated sectoral level), focusing on the financialization of their objectives, investments, and operations, as well as value capture dynamics between stock markets and lead firms, and between lead firms and their suppliers. Specifically, it examines how financialization among lead firms is associated with shifting patterns of value capture among shareholders, lead firms, and suppliers.
Financialization of objectives
Stock markets have become a key destination for lead firms’ financial resources in all four GVCs (Figure 2). Since the early 2000s, apparel and coffee/cocoa lead firms have increased their relative shareholder payouts by a factor of more than 3, accounting for 7.8% and 8.4% in 2022, respectively. The payout patterns of copper lead firms are more cyclical, but equally high. In contrast, the payout ratio of automotive lead firms has remained below 3% since its peak in 2001. Annual payouts to shareholders (% of revenue).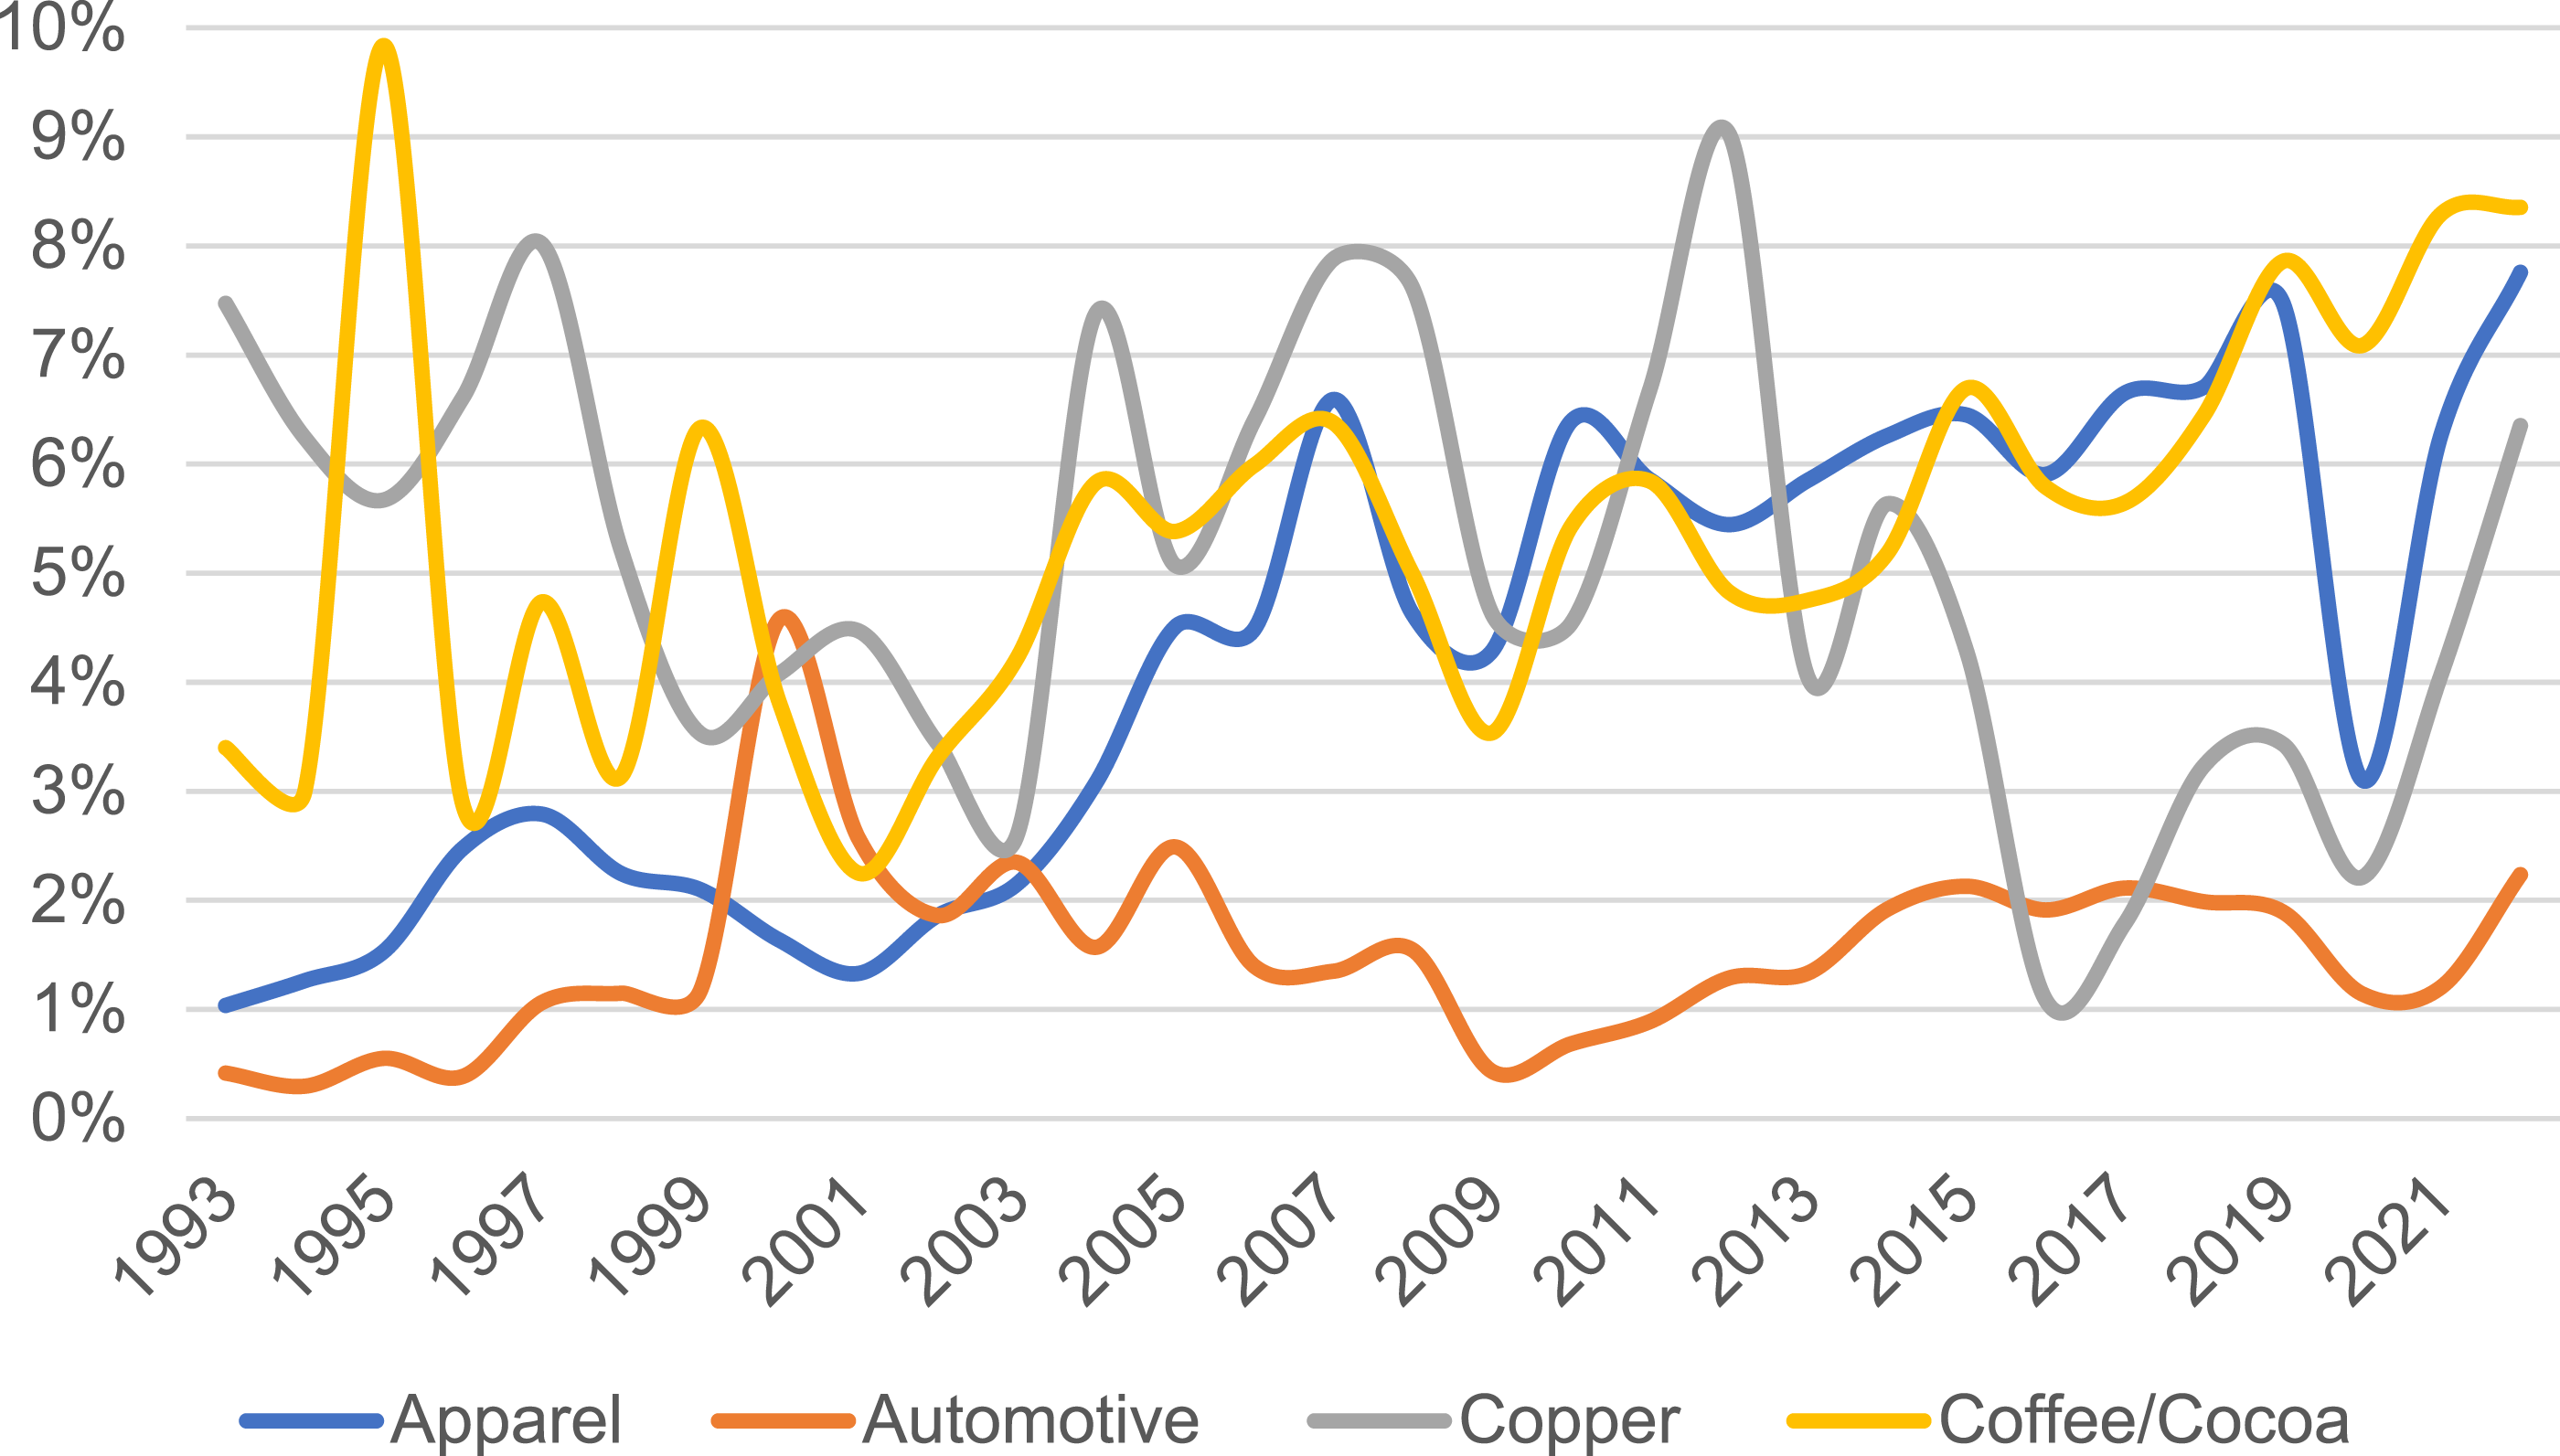
Financialization of investments and income
Financial investments are a central pillar of lead firms’ asset portfolio, accounting for 25–35% of all assets by 2022 in the four GVCs (Figure 3). Yet, overall non-financial (tangible and intangible) assets have remained the major asset types, and the share of financial assets has slightly decreased since the early 2010s. For apparel (distribution networks), coffee/cocoa, and automotive (manufacturing facilities) lead firms, fixed assets represented more than 20% of the total asset portfolio. For copper, fixed assets accounted for more than 40%, given the high capital expenditure of mining operations (Appendix Figure 4). Intangible assets in turn are significant for lead firms in apparel (13% of total assets) and coffee/cocoa (15%), given the trademark protection by some firms (Appendix Figure 3). The share of financial profits tends to be significantly lower than operating profits, and it has declined since the global financial crisis for automotive and copper lead firms, accounting for around 10% and 5% of operating income in 2022, respectively. For apparel and coffee/cocoa firms, financial income has been marginal, accounting on average for less than 2% on total income (Appendix Figure 1). Share of financial assets (% on total assets).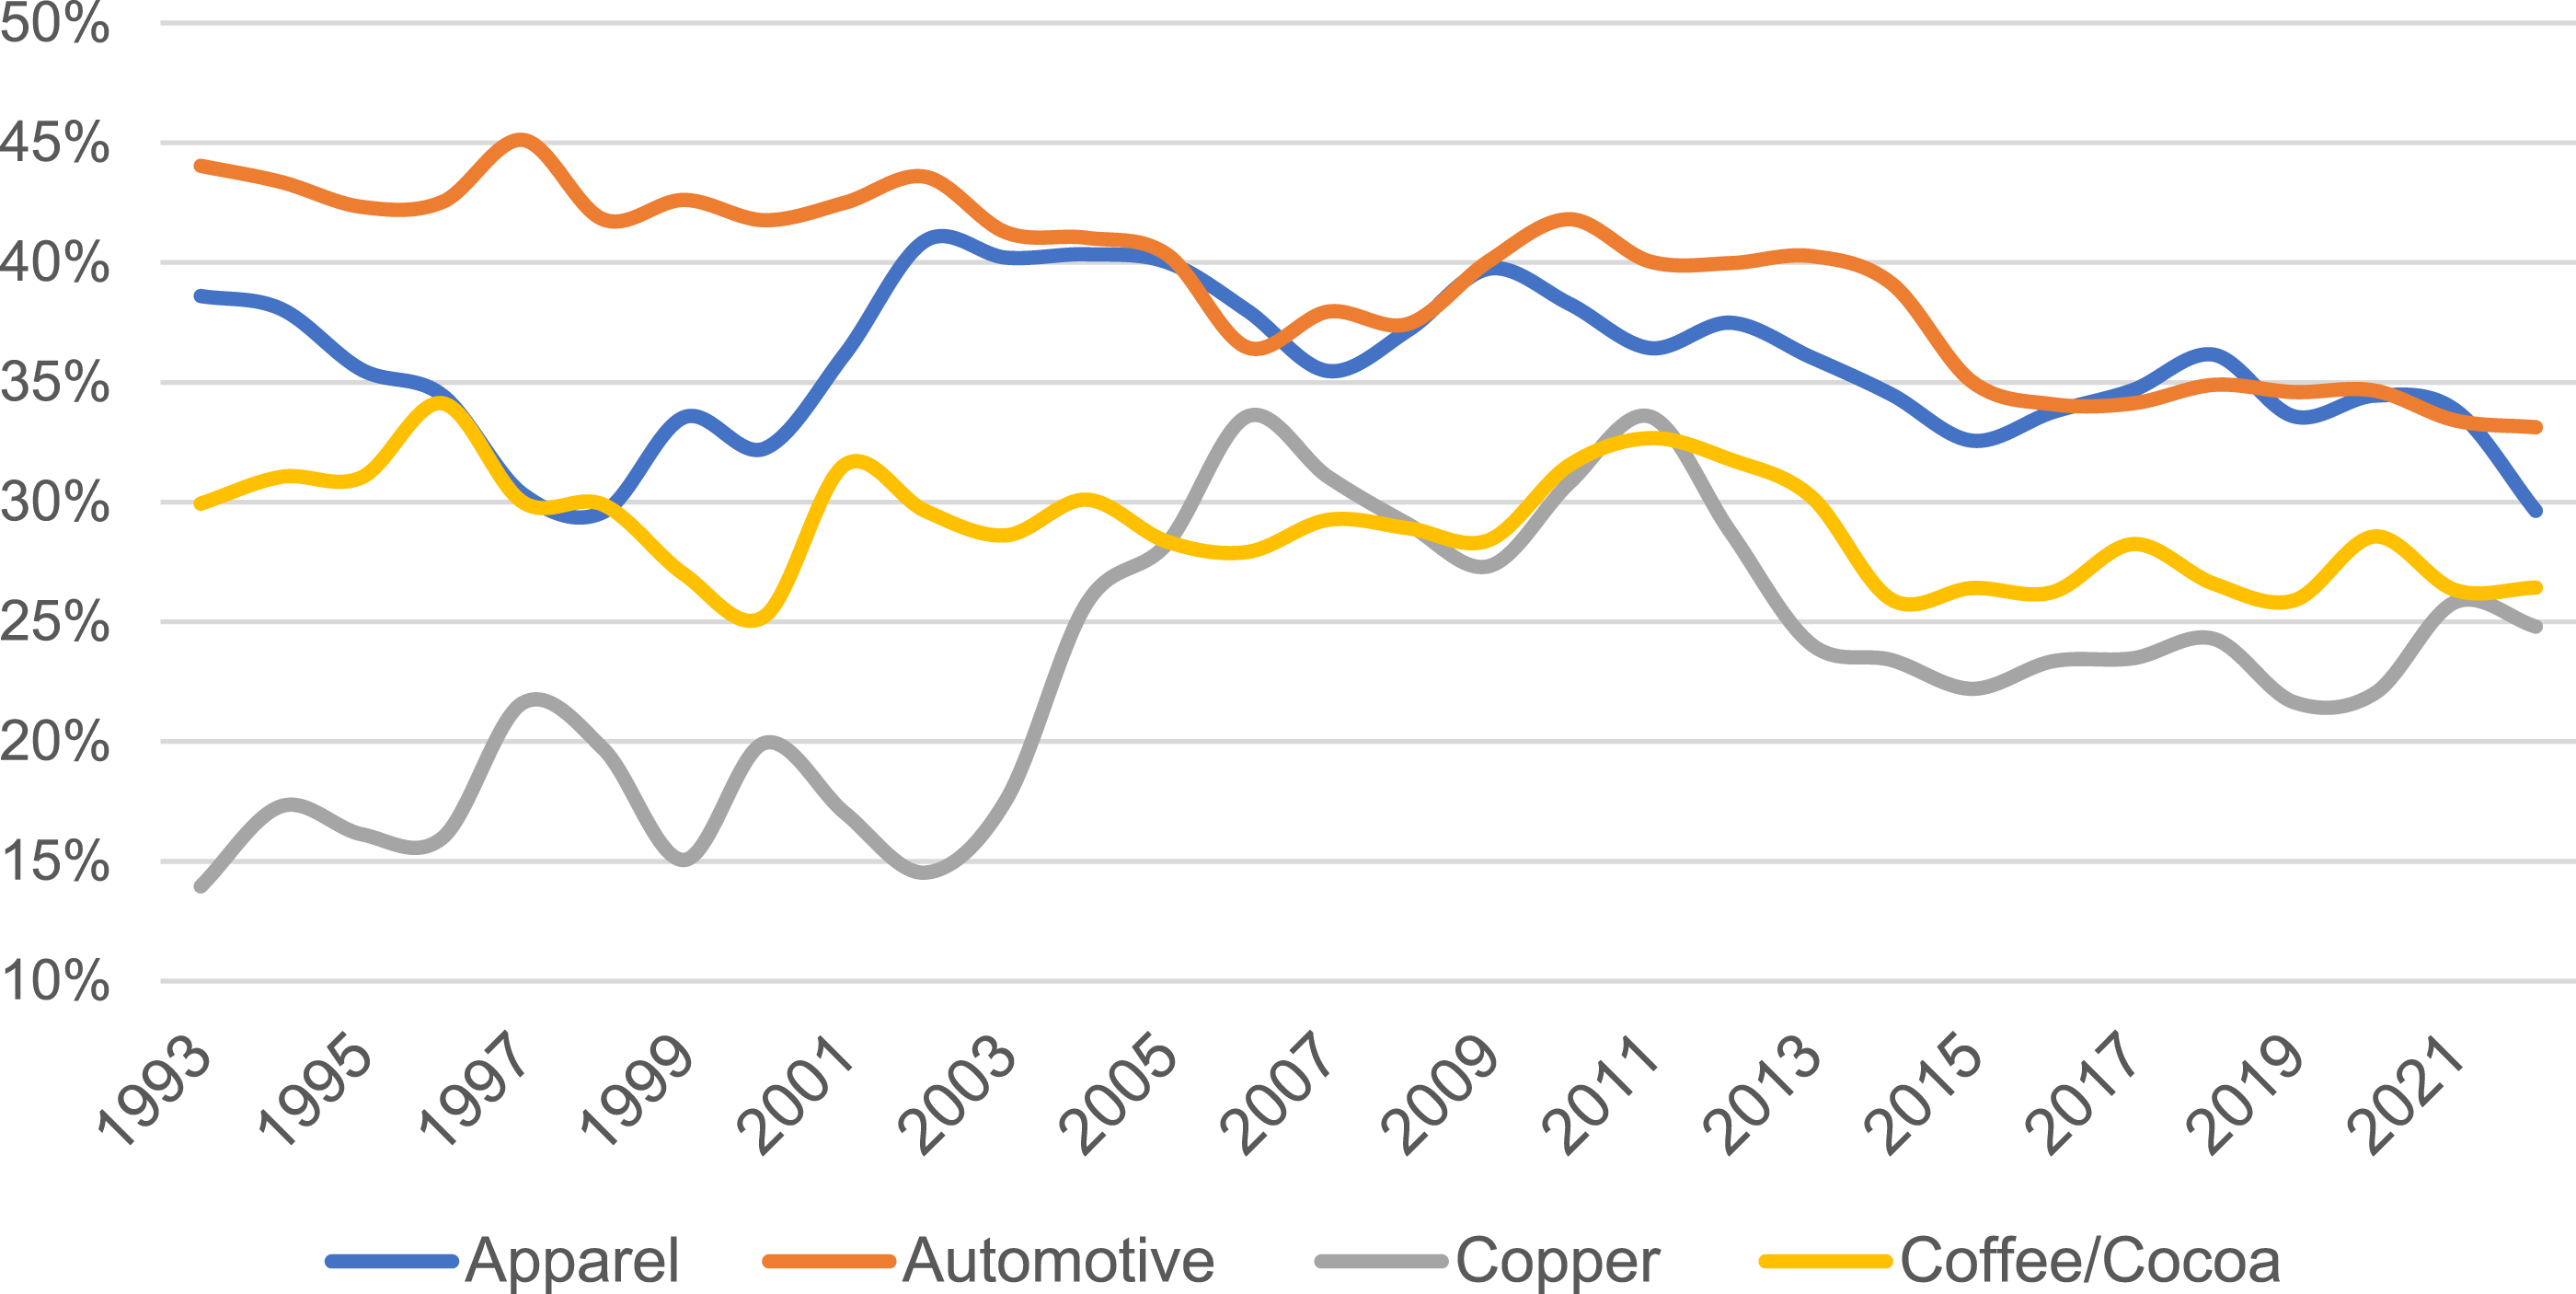
Financialization of operations
Lead firms improved their working capital position at the expense of their suppliers given the substantial time difference between collection periods and payment terms in all four GVCs, which we term “liquidity spread”
2
(Figure 4). Collection periods declined to levels below 30 days for apparel, automotive, and copper lead firms and less than 40 days for coffee/cocoa lead firms by the late 2010s. In contrast, payment terms to suppliers have fluctuated at a level of 40 days (copper) or even 50 days (apparel, automotive, coffee/cocoa). Lead firms expanded payment terms especially during the global financial crises (+25% for copper) and the COVID-19 pandemic (+35% for apparel and +21% for automotive). For a number of individual firms in coffee/cocoa and apparel (i.e., Nestlé, Mondelez, and Inditex), payment terms exceed more than 100 days. Collection period (days, dashed lines) and payment terms/’payables’ (days, solid lines).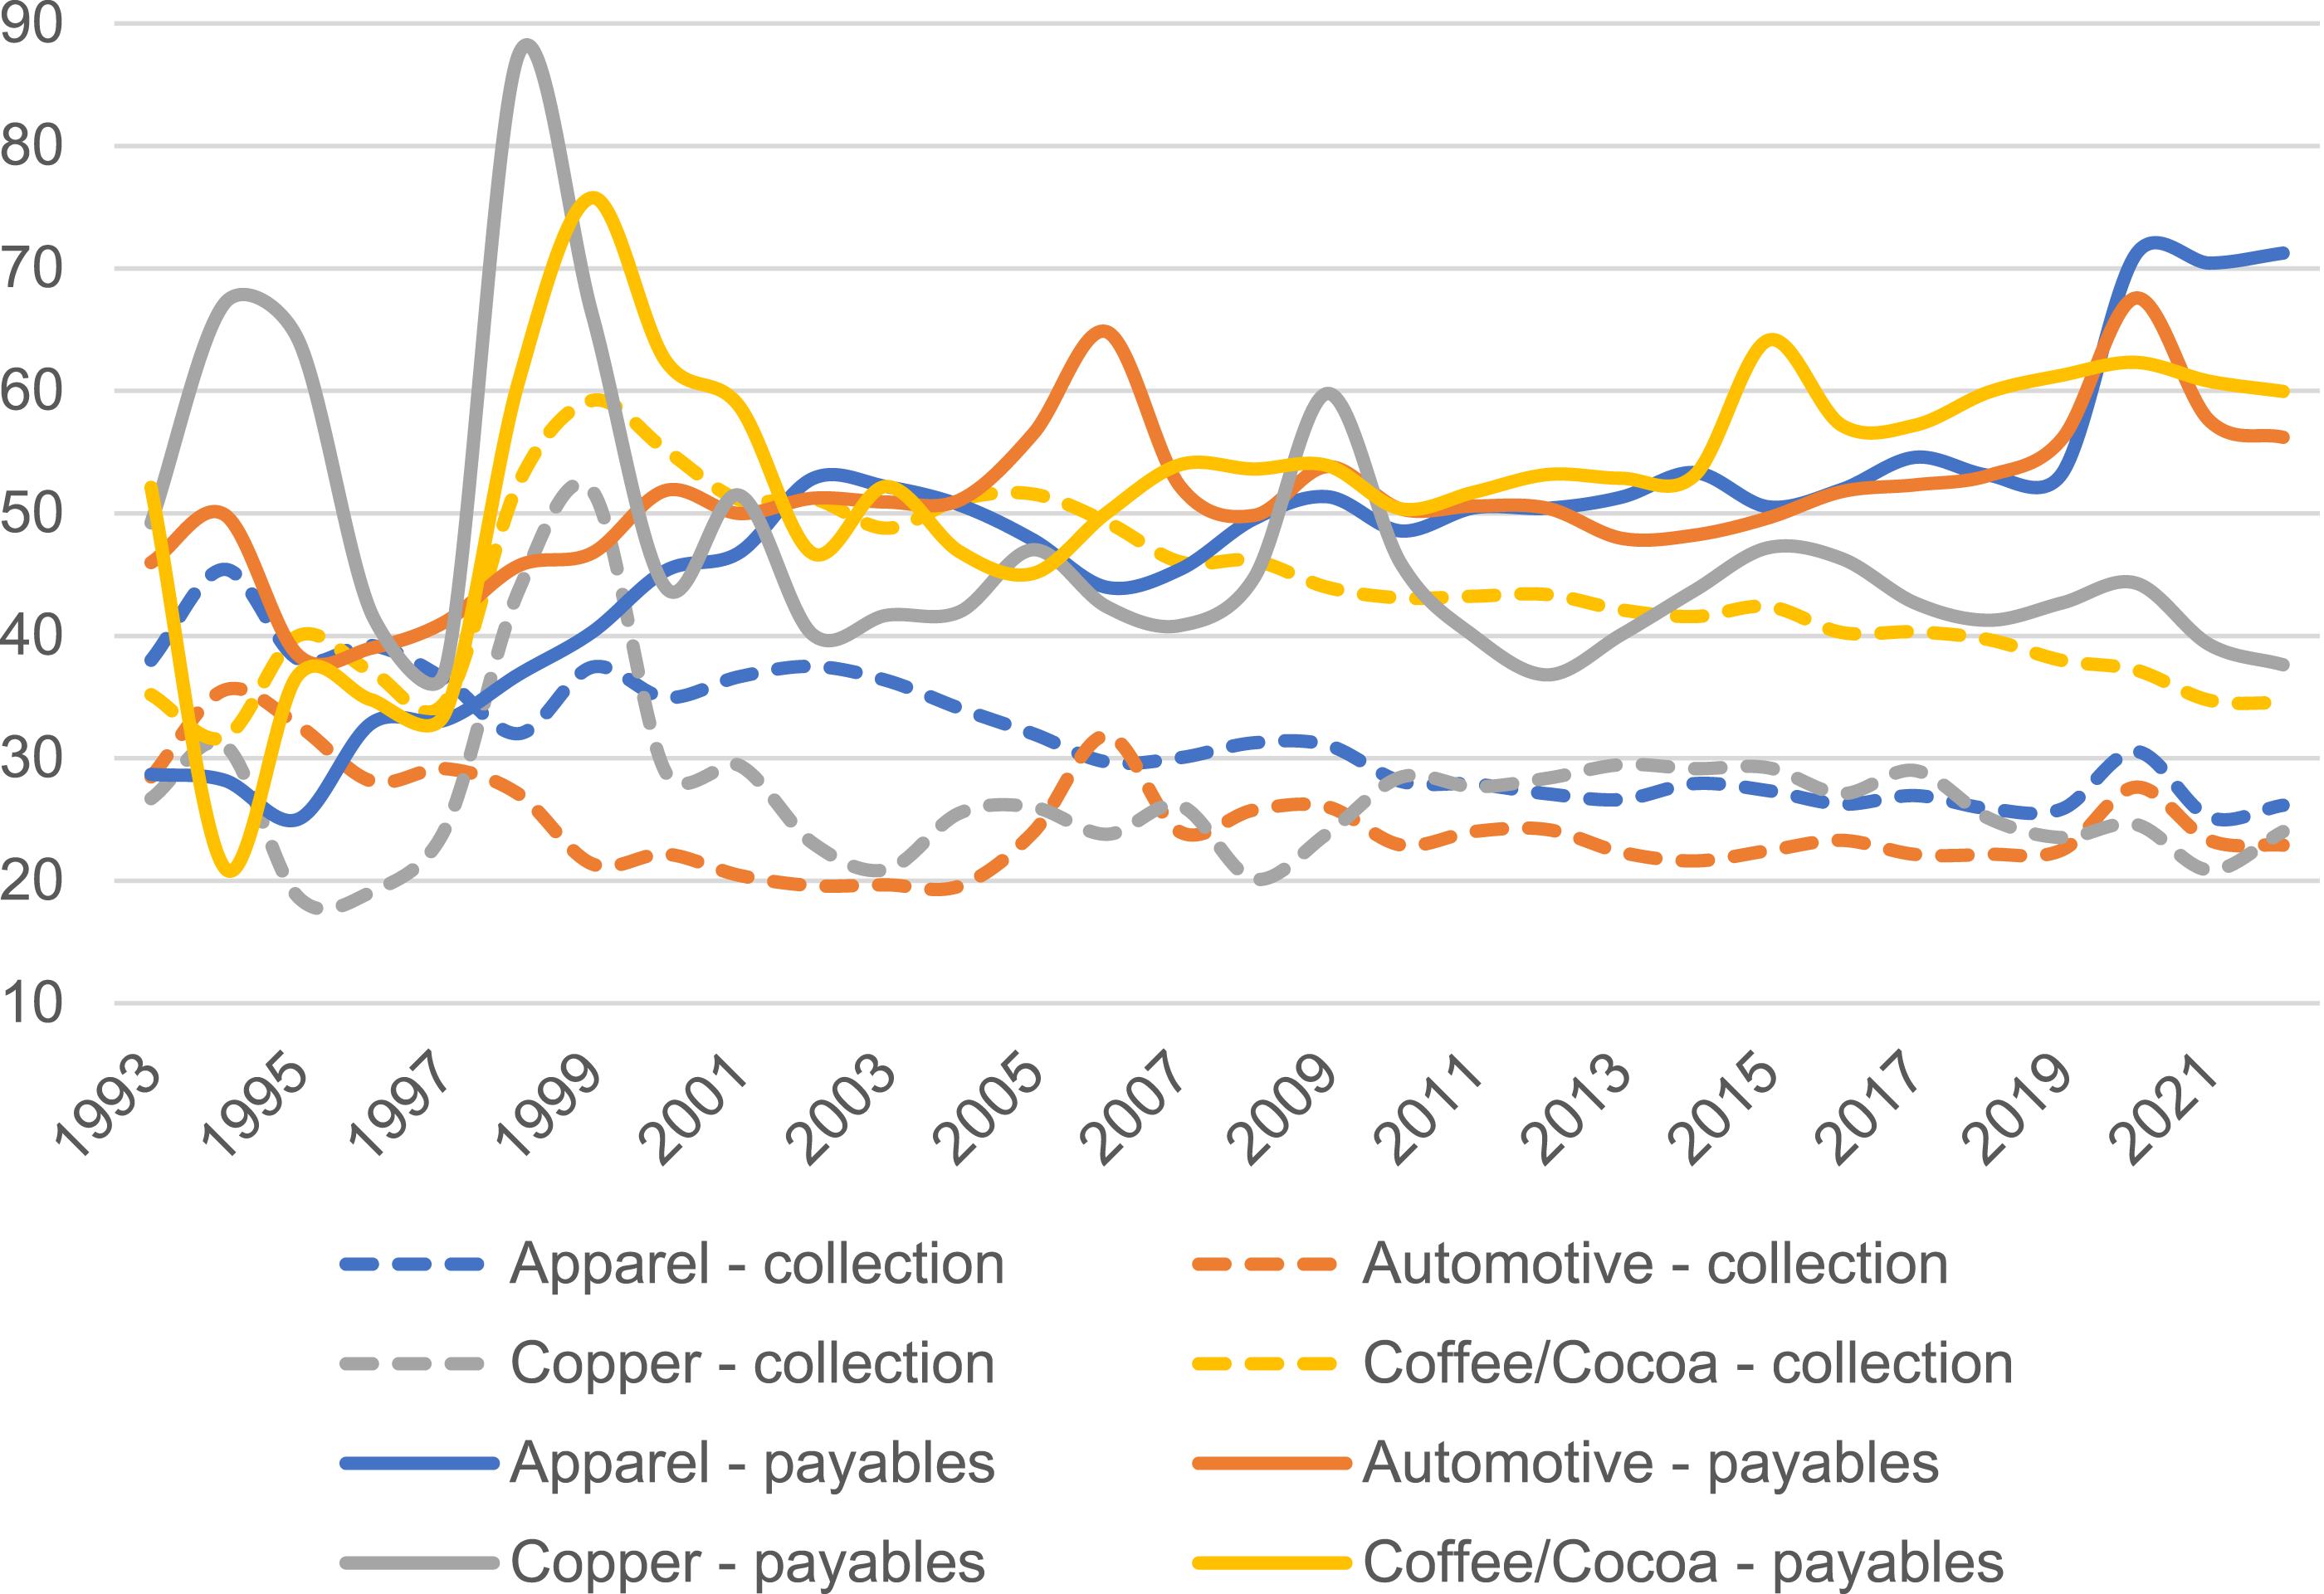
Value capture of stock markets vis-à-vis lead firms
Stock markets capture an increased amount of funds from lead firms in all four GVCs, a process that we term “net value drain.” The annual proceeds lead firms have generated since the early 1990s from stock issuance have been fairly limited, accounting for 0.7%, 0.6%, 2.2%, and 0.9% (relative to annual revenue) for apparel, automotive, copper, and coffee/cocoa, respectively (Appendix Figure 2, left side). The main financing channel in contrast has been proceeds from bond issuance, which outweigh those of stock issuance by multiple times, reaching 4.7%, 23.4%, 29.3%, and 6.6% (relative to annual revenue), respectively, for apparel, automotive, copper, and coffee/cocoa lead firms (Appendix Figure 2, right side). Since the mid-2000s, net financial flows between lead firms and stock markets have been negative for almost all financial years across the four GVCs. As Figure 5 displays, in 2022 the net value drain for apparel, mining, and coffee/cocoa lead firms reached −6% of annual revenue and −2% for automotive lead firms. Net financial flows between lead firms and stock markets (% of lead firm revenue).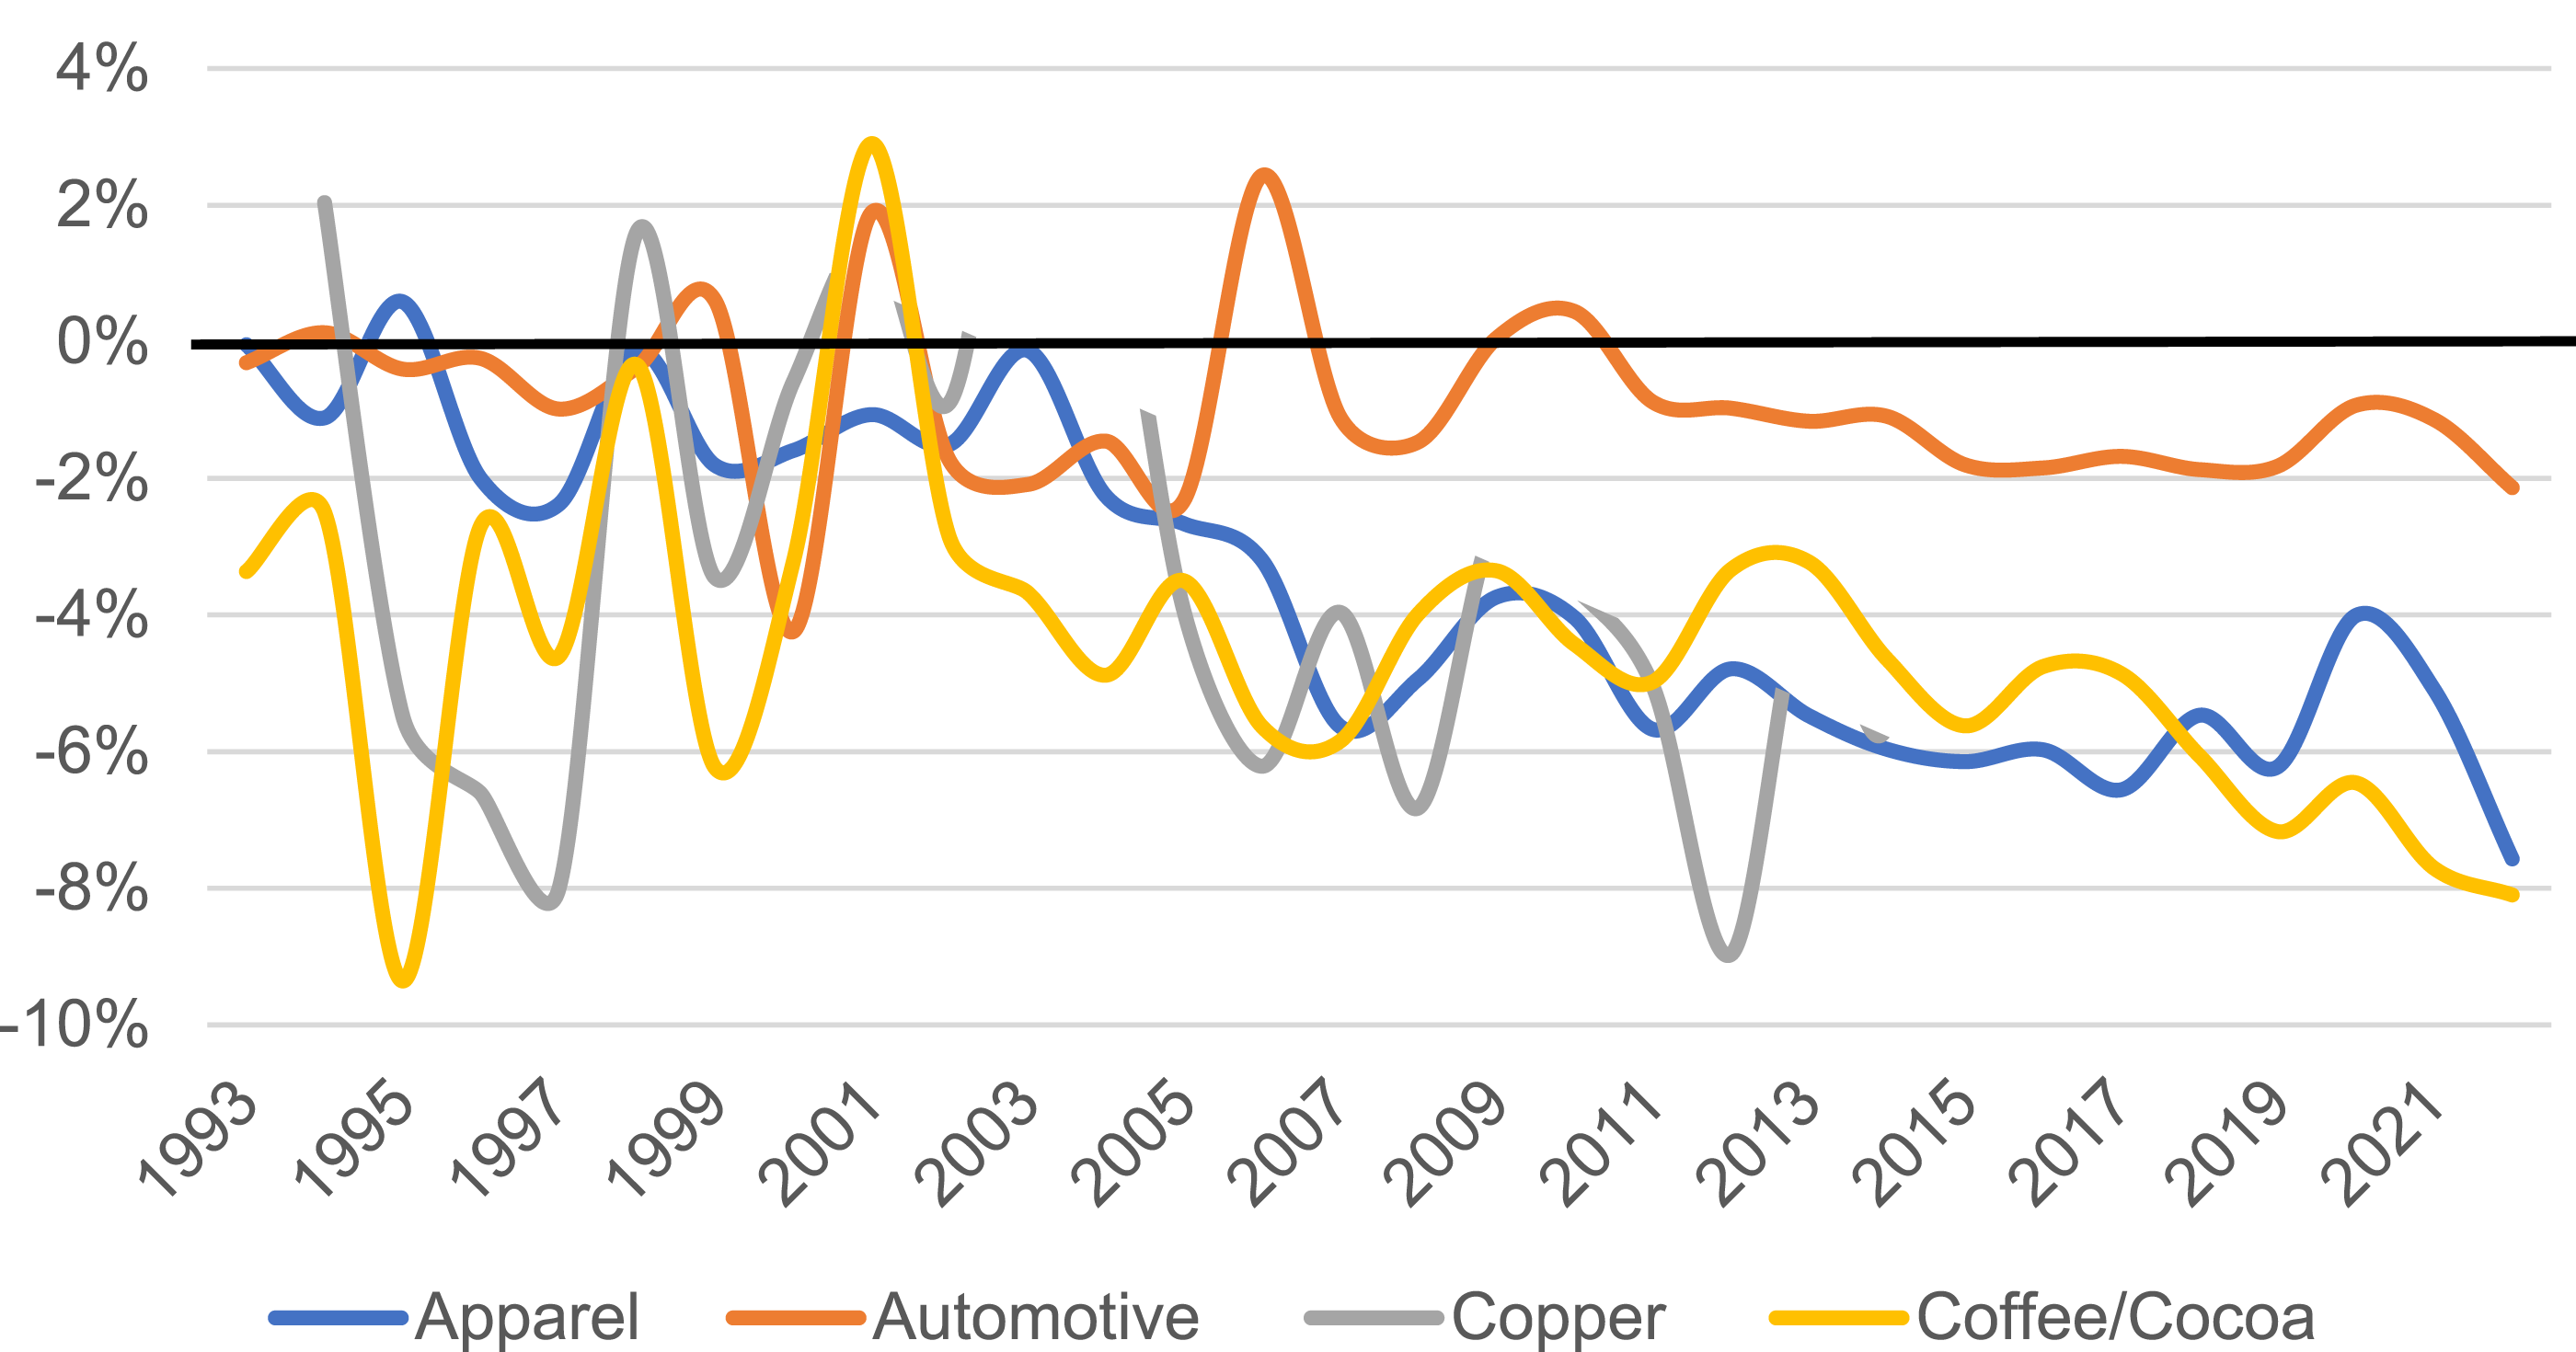
Value capture of lead firms vis-à-vis suppliers
Supply chain profitability is the highest for apparel and coffee/cocoa lead firms, whereas it is more cyclical for copper firms and low(er) for automotive firms (Figure 6). What stands out is that those sectors where lead firms generate the highest gross profit margins vis-à-vis their suppliers (apparel, coffee/cocoa) also outline the highest payout ratios to stock markets (Figure 2). This suggests that cost mark-ups generated in supply chains are a key source for shareholder payouts. The gross margins of apparel lead firms climbed from 33% in 1993 to 52% in 2010. In the case of coffee/cocoa lead firms, gross profit margins were equally high, but only for coffee roasters/chocolate manufacturers, whereas the profit margins of international traders were smaller, stagnating at 10%. The gross profit margins of copper lead firms rose to more than 30% during the copper price boom 2006–2012 and then stagnated at around 20%. For automotive lead firms, they have barely exceeded 20%. Annual gross profit margins (%).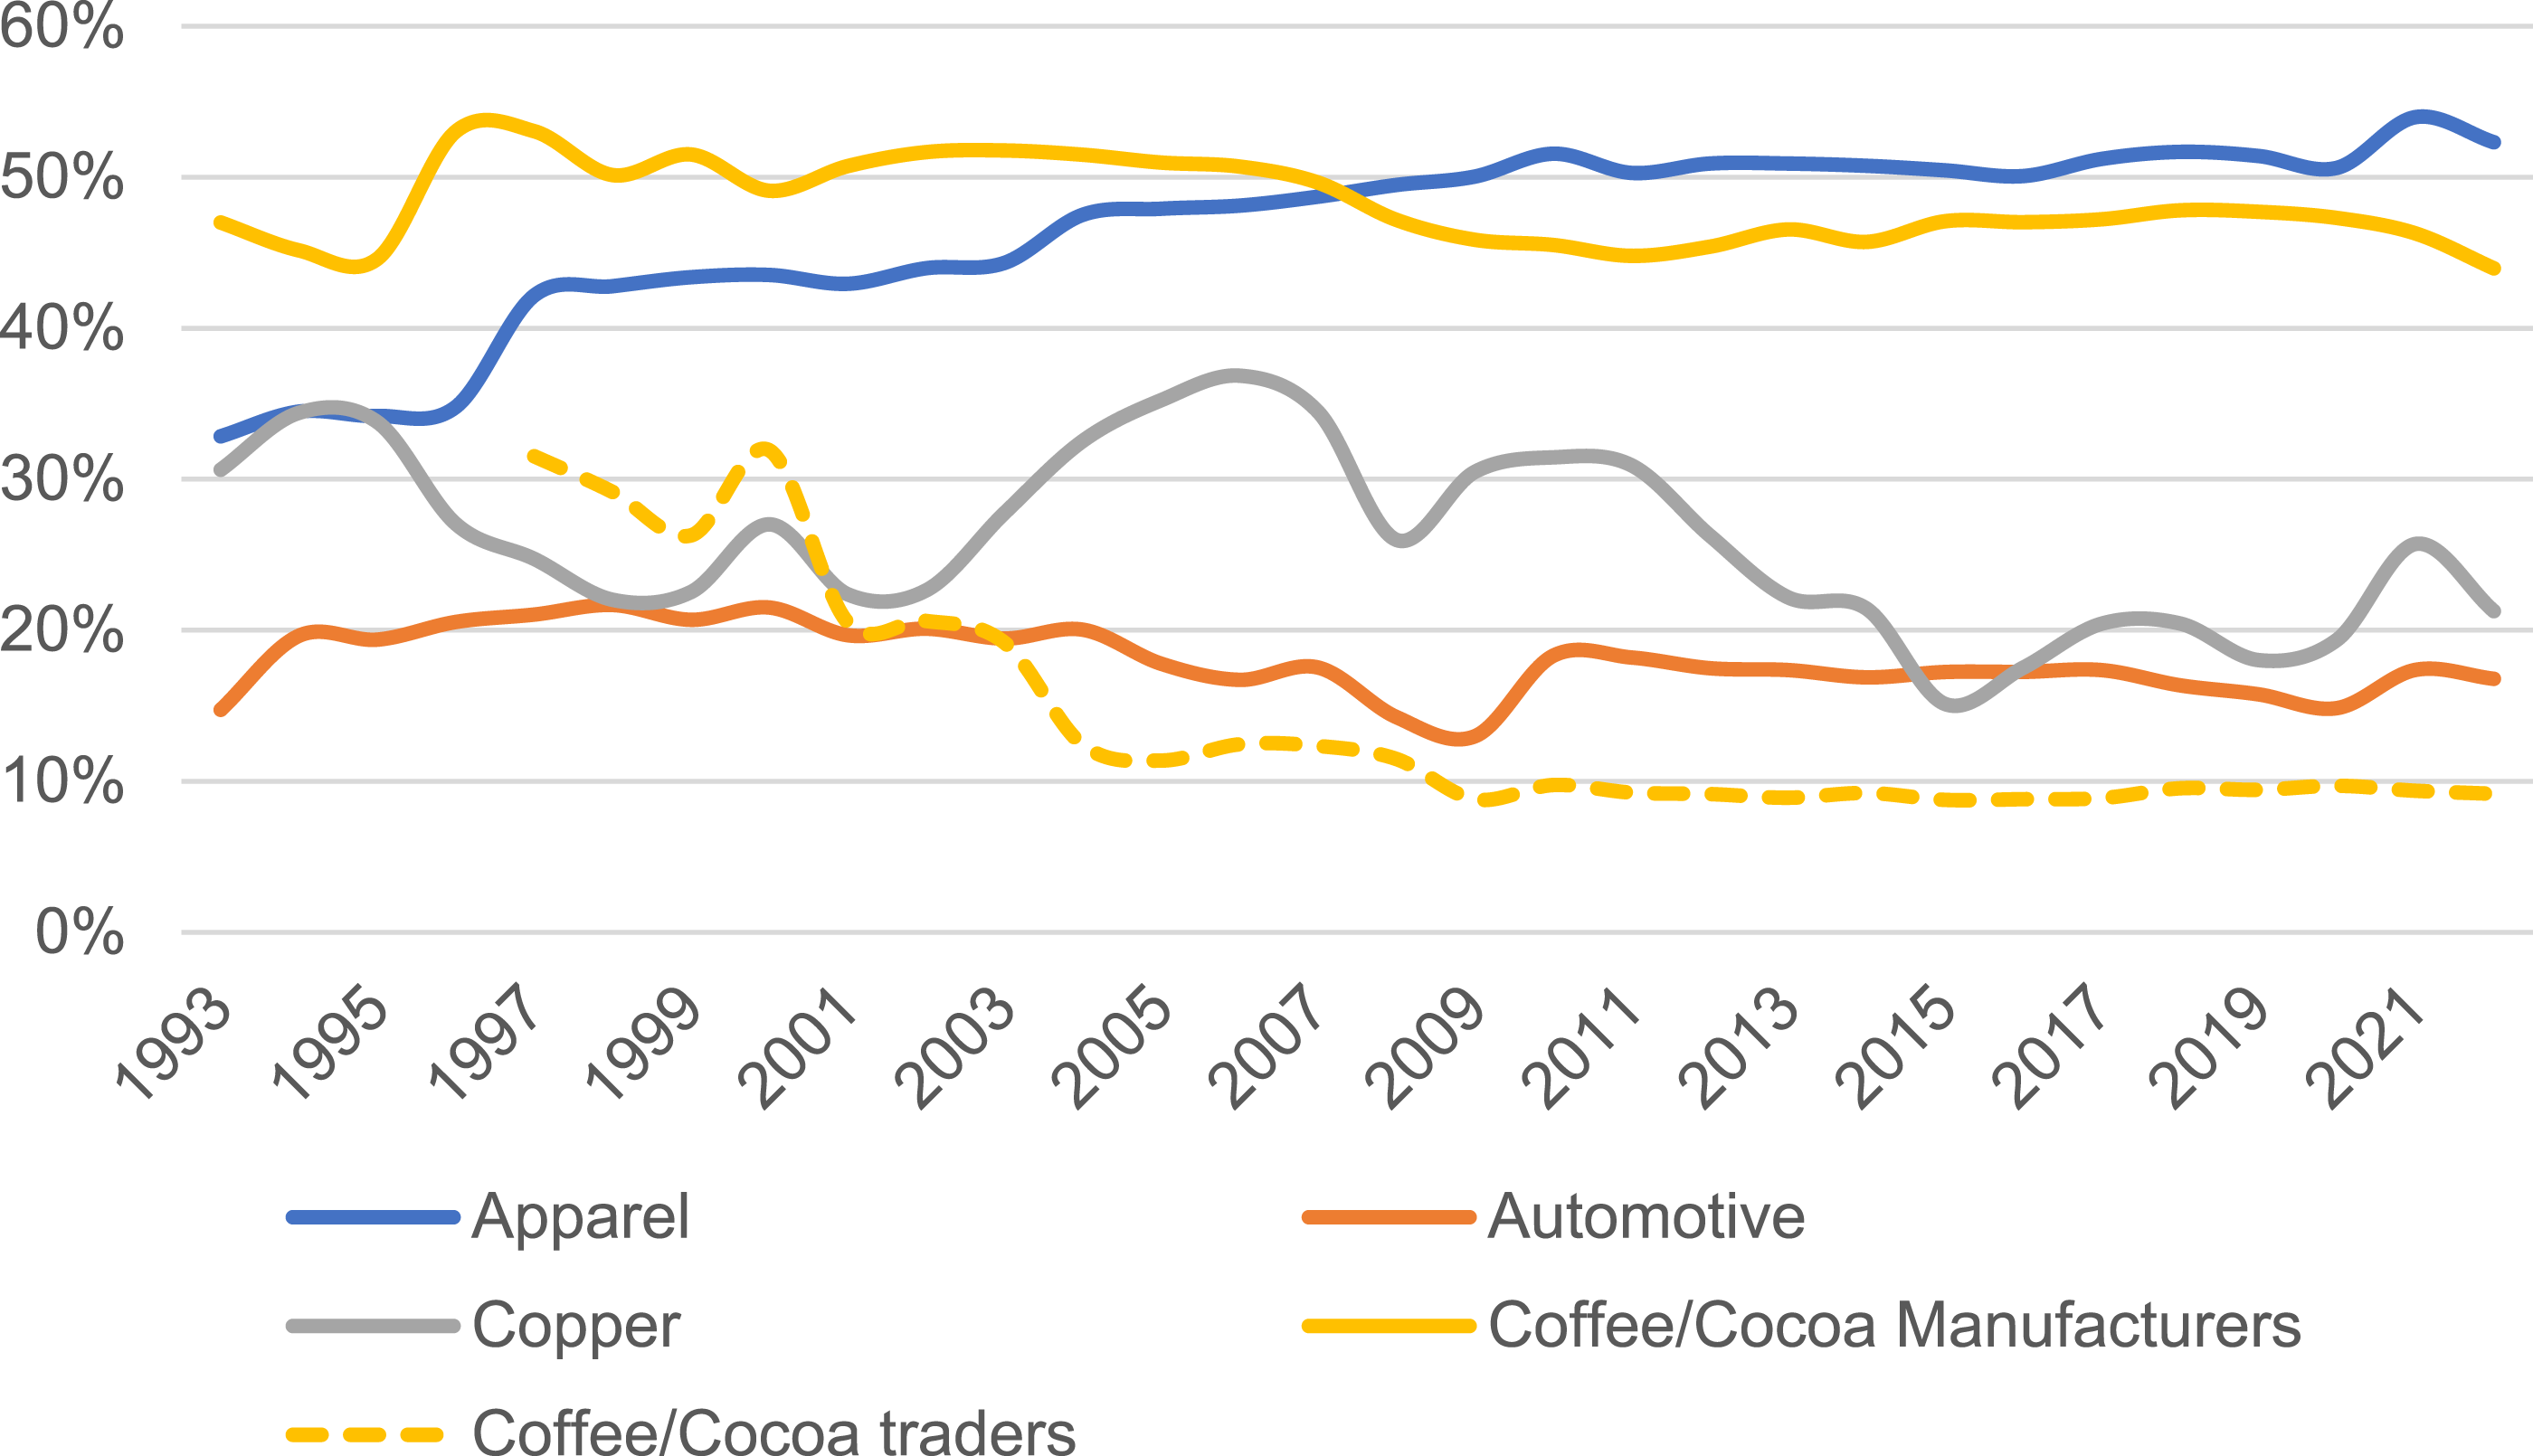
Discussion of results through GVC and macro-financial dynamics
Synthesizing the analysis on financialization and value capture, we can identify three key processes across all GVCs: First, there has been de-financialization of investments with lead firms’ business strategies remaining centered around “non-financial” activities and profit channels. The share of financial assets has decreased in all four sectors since the early 2010s, and the share of financial profits vis-à-vis non-financial profits has been relatively low, with few exceptions in copper and automotive during the late 1990s. Second, across the four GVCs, lead firms have funded stock markets, and supply chains served as a central source of value extraction. Lead firms generated profits through lower costs in supplier markets (achieving gross margins beyond 18% in all sectors), which corresponds with low investment requirements due to substantial outsourcing. External funds came largely via bond issuance, while proceeds from stock issuance were low. At the same time, lead firms allocated large sums towards dividend and share buyback packages, so that in all four GVCs there is a considerable “net value drain” from lead firms to stock markets, ranging from −1% to −4% of annual revenue (a summary of all financialization and value capture indicators is listed in Appendix Table 2).
Third, regarding financialization of operations, supply chains have become a source of liquidity through forced supplier funding in all four GVCs. Lead firms’ collection periods have decreased since the early 2000s, whereas payment terms to supplier firms have increased or remained on high levels, leading to an increased liquidity spread, through which lead firms create a more advantageous working capital position at the expense of their suppliers. The liquidity spread is facilitated through a financial ecosystem centered on supply-chain financing (SCF) that emerged in the 2000s. This system allows buyers to extend their payment terms, while some key suppliers can receive early payment ahead of the usual schedule. To do so, these suppliers pay a fee to the buyer’s bank or an SCF provider, which then advances the funds and collects the full payment at a later date. This adds an additional layer of uneven value capture between lead firms and suppliers (IMF, 2017). For the top 10 lead firms, 6 apparel and 5 coffee/cocoa lead firms use such SCF programs.
At the same time, there are important differences among sectors: First, higher value capture vis-à-vis suppliers correlates with higher financialization of objectives. Automotive firms, which have the lowest gross margin (18%), possess lower funds to be distributed to shareholders (payout ratio 1.5%). Apparel (47.2%), copper (24.6%), and coffee/cocoa lead firms (33%) have higher mark-up capacity, which translates to higher payout ratios of 4.3%, 4.7%, and 4.8%, respectively. In this context it is insightful to zoom in into differences on shareholder payouts within the same sectors, with some firms posting significantly higher payout levels than others. This intra-sectoral variation predominantly corresponds with differences in the jurisdiction and macro-financial context of lead firms: In general, US-based firms are more financialized in their objectives than European and even more East Asian firms (for specific examples, see below). Second, while decreasing in all four GVCs, the level of financial income vis-à-vis operating income has some importance for automotive (22,2%) and copper lead firms (6,3%), whereas in apparel and coffee/cocoa financial income is marginal. Third, while the liquidity spread is prevalent across all GVCs, its extent varies from 8 days in automotive, to 17 days in copper, 21 days in apparel, and 27 days in coffee/cocoa.
In
The combination of higher mark-up capacity, and a business model with low capital expenditures, created the financial profits for shareholder payouts, which climbed from 1% in 2001 to 6% by 2010, a level on which they remained during the 2010s. Payouts vary however by macro-financial environment in which lead firms operate, as, that is, US and EU firms (4% payouts) dedicated more funds to stock markets than Japanese firms (2% payout ratio). It was globalization (of the supply base) that enabled financialization on a novel level, mediated by the macro-financial context of lead firms’ home countries which determines “expectations” on payout levels.
The high liquidity spread is not only explained by power asymmetries but also by challenges inherent to apparel lead firms’ business model. The fast fashion model pursued since the early 2000s creates significant inefficiencies in inventory based on forecasting errors, so that inventory costs have doubled throughout the 2010s. As a response, apparel lead firms sought to improve their working capital position by extending payment terms vis-à-vis suppliers, which rose from 25 days in 1995 to 72 days by 2022.
Lead firms in
Yet, OEMs have pursued financialization of operations (liquidity spread vis-à-vis suppliers of 27 days). First-tier suppliers can pass on these payment terms to their sub-suppliers and even add their own liquidity spread of more than 10 days (e.g., ZF or Continental; S&P Capital IQ database, 2023). A distinct feature of the automotive industry is its high share of financial income, that began to evolve in the mid-1990s and peaked at 50% of operational income in the mid-2000s: OEMs developed financial subsidiaries to create leasing and insurance models for customers, both to stimulate demand for cars and to create novel profit streams (Froud et al., 2006). However, since the late 2000s this income has decreased to 10%, related to lower interest rates which reduced financial profits in this business segment.
Lead firms in
The lower “net value drain” is due to the immense capital requirements of mining activities. Mining firms began to diversify their financing sources away from banks during the 1980s (de los Reyes, 2017), with bond issuance becoming the major source. Lead firms however still generate significant funds through secondary share issuance, making the flow of funds between copper firms and shareholders not as one-sided as in the other GVCs. In terms of financialization of operations, the liquidity spread of 17 days is explained by high bargaining power of majors towards equipment, technology, and service suppliers.
In
There are significant differences in terms of gross margins between international traders (5–10%) and chocolate manufacturers and coffee roasters (30–70%). Traders pursue a large volume-low margin business, whereas manufacturers/roasters capture profits through their brands with minimal investment requirements. Still, both types of lead firms were able to consolidate their gross margin levels, despite large price fluctuations, through engaging in hedging via commodity derivative markets. The profit capacity of chocolate manufacturers and coffee roasters translates into high shareholder payouts, mainly via dividends (increase to 5–8% since the early 2000s). Despite low dividend payments, international traders engaged in financial investments in boom periods, particularly in the commodity super cycle in the 2000s, providing financial services to other physical and financial actors, and owning hedge funds and other financial units (e.g., Olam and Louis Dreyfuss; Staritz et al., 2018, 2022; Van Huellen and Abubakar, 2021; Baines and Hager, 2022). However, the profits accrued from these assets were relatively small and most firms spun off these units after the end of the commodity super cycle.
International traders have largely absorbed the extensions of payments terms imposed by roasters/manufacturers, while roasters and manufacturers have been able to reduce their collection period from retailers (from 50 days in the 1990s to less than 40 days in the 2010s). International traders impose very short payment terms vis-à-vis their suppliers, for example, less than 20 days for Olam and Louis Dreyfuss. This is related to their business model, in which rapid payment to exporters or producers is a key advantage; further, it is linked to export regulations in some producer countries that demand immediate payment or even forward sales (Staritz et al., 2022; Van Huellen and Abubakar, 2021).
Synthesizing beyond GVC specificities and differences, Figure 7 summarizes how we explain value capture outcomes in light of the two key drivers (industry dynamics and macro-financial environments) in our conceptual framework. The value capture outcomes that emerged during the early 2000s, and persisted throughout the 2000s and 2010s, were impacted by three central developments: First, the expansion and deepening of GVCs that enabled low buyer-supplier ratios through which lead firms could enhance their mark-up capacity and improve their liquidity position vis-à-vis their suppliers. Second, the value extracted from supply chains was increasingly channeled into higher shareholder payouts, particularly through share buybacks, which became increasingly prominent amid steadily declining capital gain taxes.
4
Third, the low interest environment of the 2000s and 2010s was conducive for lead firms to finance their operations through low-cost bonds and therefore reduced the need to issue shares on stock market.
5
As a result, lead firms were able to finance their operations via low-cost bonds, reducing the need for equity issuance. In sum, the high payouts to shareholders in combination with low or non-existent equity issuance led to a “net value drain” from lead firms (and their GVCs) to stock markets. Global industry dynamics, macro-financial environment, lead firm strategy, and value capture (2000–2020).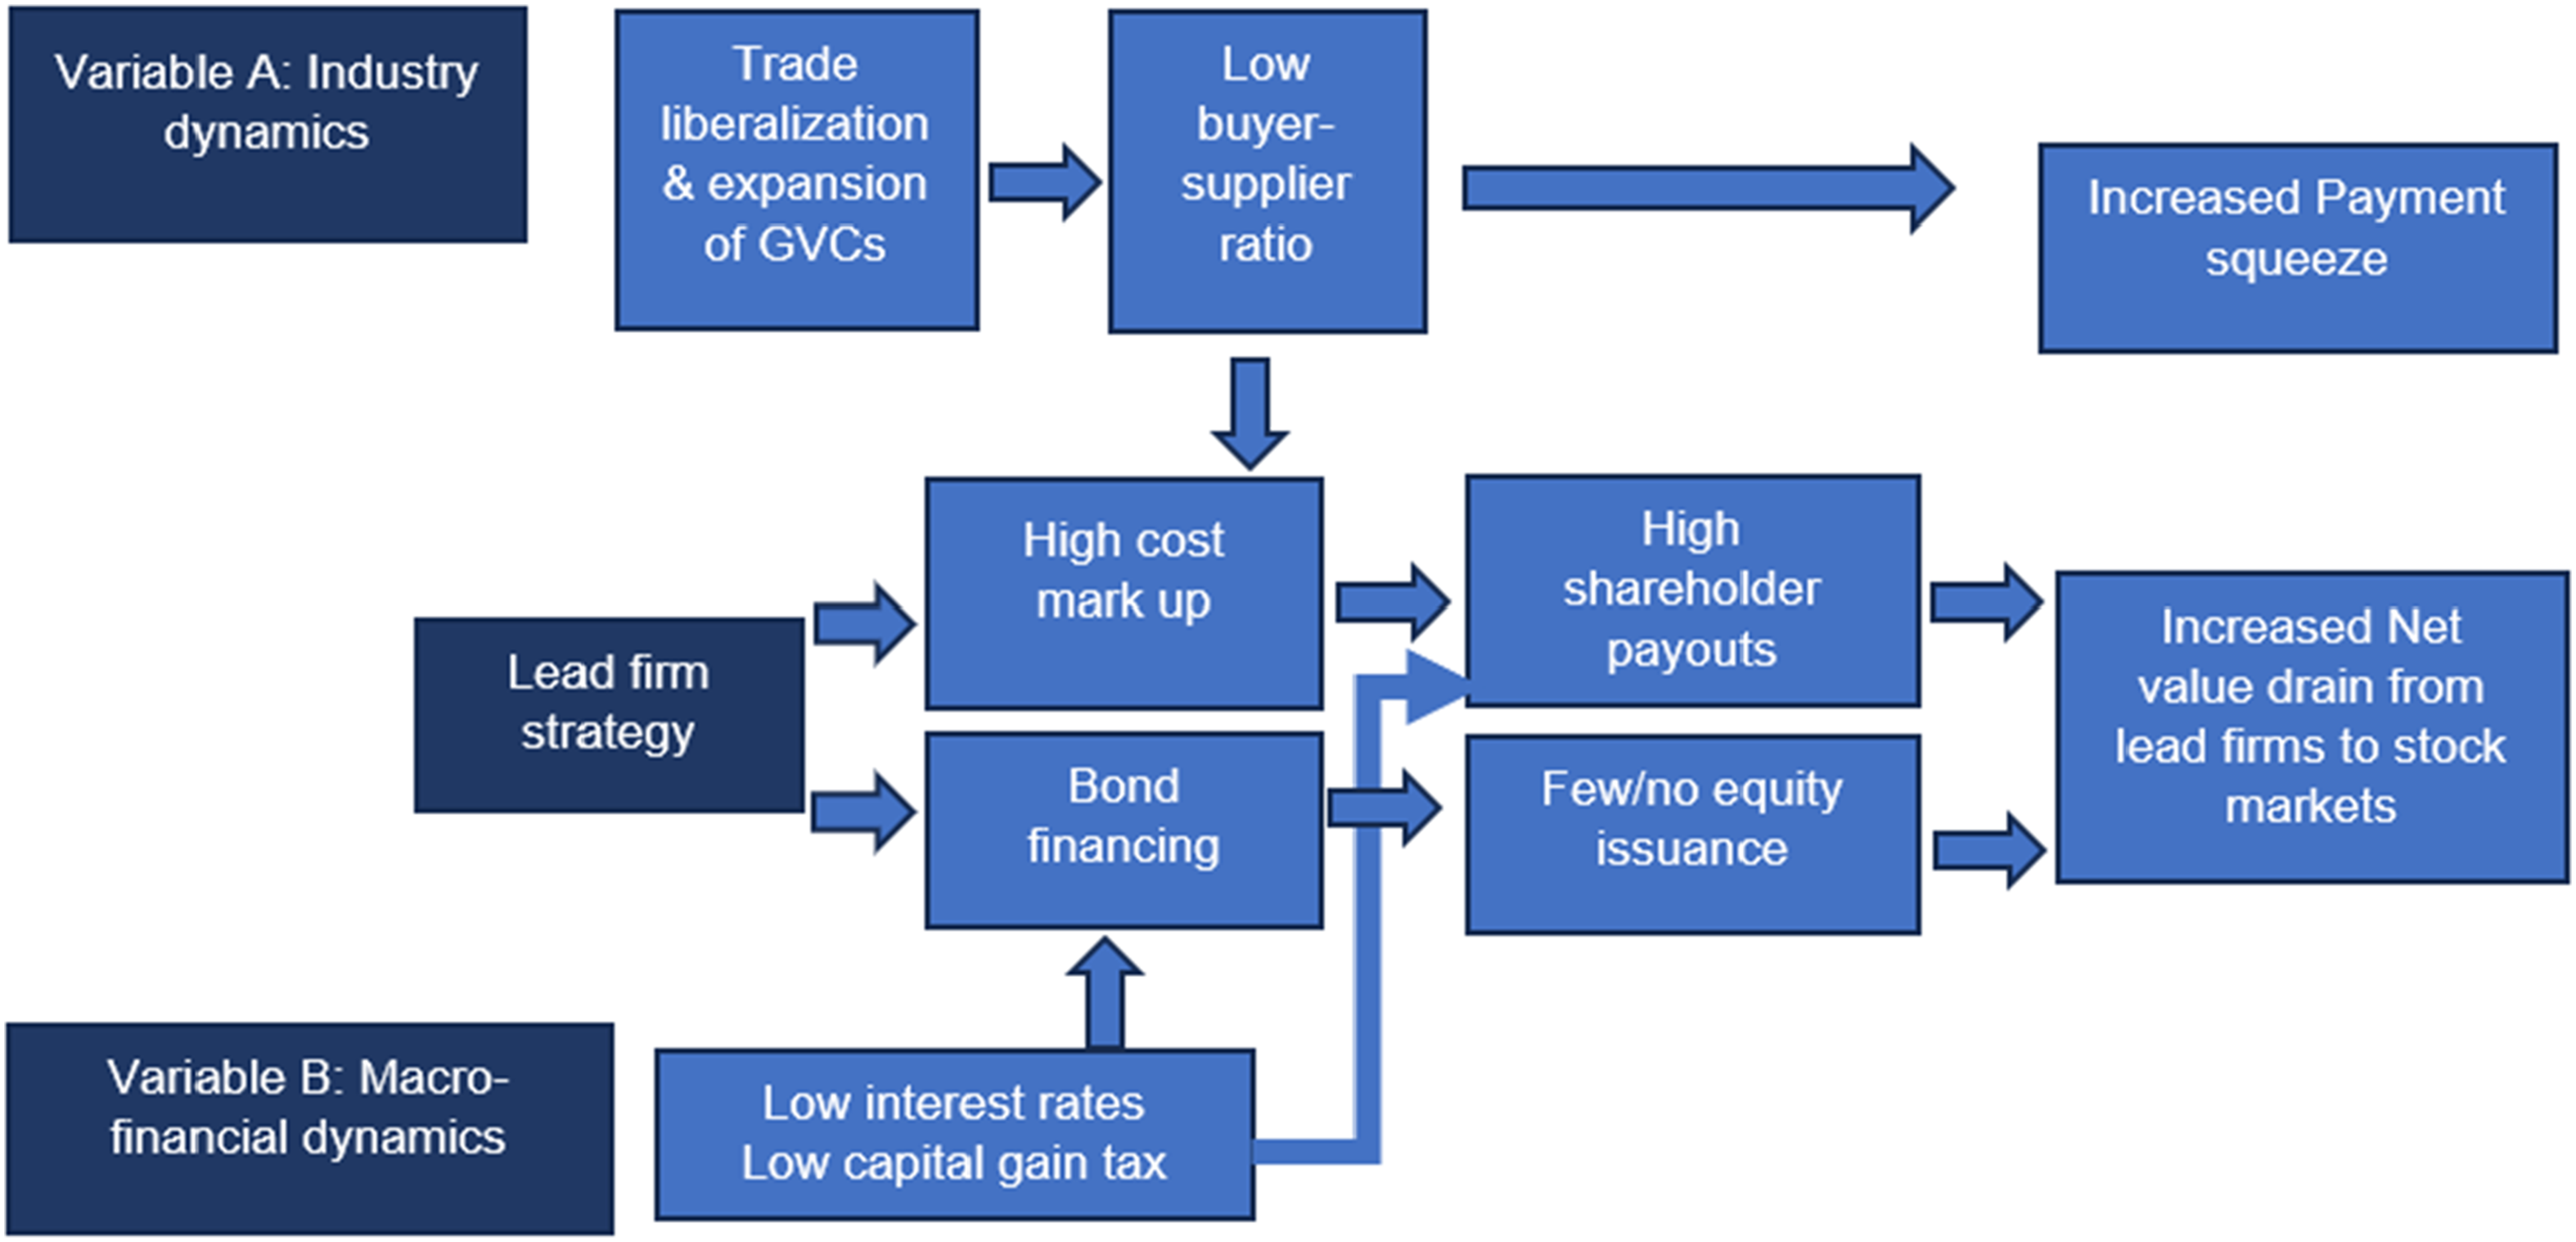
Conclusion
This paper investigated how financial markets and financialization shape the configuration, governance, and value capture along GVCs. Drawing on the literature on corporate financialization, the GVC/GPN-financialization nexus, and empirical contributions on financialization across globalized industries, our conceptual framework aims to explain the drivers of value capture between financial markets and GVC actors, highlighting two key variables—global industry dynamics that shape lead firms’ mark-up capacity and macro-financial environments that influence lead firms’ financing and shareholder payout patterns. There are three main findings. First, corporate financialization covers diverse processes, with simultaneous patterns of financialization and de-financialization. Financialization indicators vary across time, jurisdictions, sectors, and firms, linked to lead firms’ mark-up capacity and macro-financial environments. Second, despite variation, there are two key trends across all four GVCs that were investigated: Supply chains are used as a “source of value,” as higher profits on sourcing costs correlate with higher shareholder payouts; and as a “source of liquidity,” given that the extension of supplier payment terms allows lead firms to improve their working capital position. Third, a specific constellation of globalized production and global financial market dynamics during the 2000s and 2010 led to a substantial “net value drain” from lead firms (and their GVCs) towards stock markets: High profit-capacity of lead firms through their GVCs, and low-cost bond financing in combination with low equity issuance culminated in shareholders becoming the “main beneficiaries” of GVCs. In essence, value that is created in GVCs is captured by shareholders through large-scale dividend payments and share buybacks.
Our contribution to the corporate financialization literature and the GVC/GPN literature focusing on financialization is the development and application of a conceptual framework that assesses distributional outcomes from financial markets to lead firms and suppliers, linking specific industry dynamics with macro-financial environments. It shows how specific GVC dynamics are important drivers of mark-up capacity and distributional outcomes that are not primarily explained by, but may fuel, financialization. Understanding the distributional outcomes of financialization of firms requires an in-depth engagement with industry specificities, and lead firms’ supply chain strategies and governance. Shareholder value pressure to deliver on financial results and payouts undoubtedly impacts lead firm strategy, but the capacity to deliver these payouts is grounded in the characteristics and dynamics of specific sectoral profit creation patterns articulated in global supply chains. At the same time, financialization patterns and uneven value capture between financial markets and GVC actors are linked to financial market dynamics, including interest rate levels, which are processes that are virtually absent in the GVC literature.
Combining these factors in the conceptual framework presented in this paper, we offered one way to make sense of extractive relationships between different actors in financial markets and GVCs: Matching (lead) firms’ sources of funds and profits (flowing from both financial markets and lead firms’ suppliers) with lead firms’ uses of funds and profits allowed us to unpack the causal transmission lines of extractive relationships, and identifying the actors that create and capture value in the global economy. Situating the bilateral financial relationships within broader industry and supplier country contexts as well macro-financial cycles accounts for the external drivers that enable, sustain, or curtail extractive relationships.
More broadly, our article therefore advances GVC analysis by examining which actors capture value in GVCs, the mechanisms they employ, and why these dynamics change over time.
Supplemental material
Supplemental Material - Shareholders as the main beneficiaries of globalized production: Corporate financialization and value capture along global value chains
Supplemental Material for Shareholders as the main beneficiaries of globalized production: Corporate financialization and value capture along global value chains by Ubay Felix Maile and Cornelia Staritz in Competition & Change
Footnotes
Acknowledgments
We wish to thank the participants of the Workshop on Power and Inequality in Value Chains and Production Networks in Johannesburg (June 2024) and the Financialization Panel at the International Initiative for Promoting Political Economy (IIPPE) Conference in Istanbul (September 2024). We are also grateful to the team members of the Creating and Capturing Value Project, and in particular the Global Value Chains and Finance Project, for their valuable insights, discussions, and feedback. We would like to extend our special thanks to Annina Kaltenbrunner, Bernhard Tröster, Aleksandra Wojewska, and Tobias Klinge, as well as to the Editor, the Reviewers, and the Special Issue Editors, Stefano Ponte and Juliane Lang, for their thoughtful and constructive comments.
Ethical considerations
The study involved interviewing human participants. The study was carried out after a self-assessment on research ethics based on the Research Ethics Questionnaire by the Faculty of Social Sciences of the University of Vienna.
Funding
The authors disclosed receipt of the following financial support for the research, authorship, and/or publication of this article: The authors would like to acknowledge financial support by the Danish Fellowship Centre (Grant Number DFC 19-01-RUC).
Declaration of conflicting interests
The authors declared no potential conflicts of interest with respect to the research, authorship, and/or publication of this article.
Data Availability Statement
The authors are willing to make the data supporting the results and analyses presented in the paper available upon request.
Supplemental material
Supplemental material for this article is available online.
Notes
References
Supplementary Material
Please find the following supplemental material available below.
For Open Access articles published under a Creative Commons License, all supplemental material carries the same license as the article it is associated with.
For non-Open Access articles published, all supplemental material carries a non-exclusive license, and permission requests for re-use of supplemental material or any part of supplemental material shall be sent directly to the copyright owner as specified in the copyright notice associated with the article.