
Abstract
The increase in cash holdings held by non-financial corporations in emerging economies in general, and Latin American in particular, has received less attention vis-à-vis their advanced economies’ peers. Considering that cash holdings contain not only cash but also short-term, interest-bearing assets, we test whether the pursuit of financial revenues was one motive behind the decision to hold this type of asset as it is claimed in analyses of corporate financialization. We use a panel of listed non-financial firms from Argentina, Brazil, Chile, Mexico, and Peru between 1998 and 2018 to test this hypothesis. Although we find supporting statistical evidence in favor of this relation, this is mostly explained by Brazil and results point towards a low economic significance.
Keywords
Introduction
During the 2000s, Latin American economies went through a period of accelerated economic growth and buoyant financial markets in the midst of the upward phase of the commodities prices and foreign capital inflows cycle. In spite of this favorable context, non-financial corporations’ (NFCs) economic performance fell behind expectations (Economic Commission for Latin America and the Caribbean, 2019; International Monetary Fund, 2015). Moreover, this disappointing behavior seems to linger on today.
Meanwhile, and in a similar fashion to their developed economies peers, Latin American NFCs steadily increased their holdings of financial assets. Between 1998 and 2018, the median ratio of financial assets to total assets owned by Argentinian, Brazilian, Chilean, Mexican, and Peruvian listed firms grew between 19% and 26.5%, depending on the categories considered. 1 From all these categories, cash and short-term investments (CSTI) 2 stand out with an increase higher than 50%, also mirroring a similar performance by advanced economies’ corporates. Although substantial media and academic attention has been devoted to growing cash holdings in developed countries (Bates et al., 2009; Davis, 2018; Pinkowitz et al., 2015; Villani, 2021), the recent increase by Latin American firms has been mostly overlooked by scholars.
In the case of advanced economies, the financialization literature traditionally linked the increase in financial assets held by NFCs to the quest for financial revenues (Crotty, 2005; Krippner, 2011; Orhangazi, 2008; Stockhammer, 2004). It has only been recently that different studies, both at the macro and micro level, appeared to assess the general validity of that statement, finding mixed evidence. The case of CSTI (a category that includes interest-bearing assets) is especially relevant since it has experienced one of the largest increases of all financial assets (Davis, 2016; Rabinovich, 2019). Specifically for the US case, while Rabinovich (2019) rejects what he refers as the financial turn of accumulation hypothesis, Davis (2018) finds a positive relation between interest income and cash holdings. To the best of our knowledge, the latter is the only econometric analysis on the relation between those variables. 3 Within the corporate finance literature, Bruno and Shin (2017) and Caballero et al. (2016) perform similar exercises but without considering explicitly firms’ interest income.
Surprisingly, there is no study on that relation for the case of emerging market economies even though the link may be stronger. We say this taking into account that, in the case of emerging market economies, firms have higher possibilities to get access to high yielding government bonds (Bonizzi, 2013; Ebeke and Lu, 2014) and speculate with national currencies (Chui et al., 2014; Farhi and Borghi, 2009; Rossi Júnior, 2013; Zeidan and Rodrigues, 2013). Moreover, recent developments in international capital markets have left firms from emerging market economies in a better position to exploit interest rates differentials and carry trade opportunities stemming from domestic currency appreciation. Several studies claim that in the aftermath of the Global Financial Crisis (GFC), non-financial firms gained prominence as conduits of global liquidity, mostly through dollar-denominated bond issuances (Avdjiev et al., 2016; Kim and Shin, 2021; Shin, 2014) which was channeled into financial assets denominated in domestic currency (Acharya and Vij, 2020; Bruno and Shin, 2017).
In this context, the objective of this paper is to estimate the determinants of CSTI for listed Latin American firms during the last 20 years focusing on whether financial returns have been associated with movements in that asset. We focus on two variables. The first, interest income, captures interest and dividends from investment securities and interest from securities of national and local governments. The second, non-operating income net of interest income, includes any income (net of expense) that results from secondary or non-operating business-related activities including exchange-rate gains.
We use annual firm-level data retrieved from Compustat Global from a sample of listed firms from five Latin American economies: Argentina, Brazil, Chile, Mexico, and Peru between 1998 and 2018. With this data, we estimate standard cash holdings equations to which we add the two measures of financial revenues. The main contribution of this paper is to show that, on average, interest income determines cash holdings for Brazilian NFCs during the whole period. However, besides the statistical significance of these results, the economic relevance needs to be relativized: an increase in one standard deviation of interest income represents less than 9% of cash holdings to assets standard deviation. Cash and short-term investments in Chile are also positively related to interest income only after the GFC while non-operating income net of interest income is mostly non-statistically different from zero except for big firms in Chile and Mexico before the GFC and Brazil afterwards. Additionally, interest income has decreased throughout the period in most countries and non-operating income has been mostly negative. Our results support, on the other hand, more traditional pecking order models. A robust finding across countries is that CSTI are increased by firms’ profits and used when they make capital expenditures and acquisitions.
The remainder of the paper is organized as follows. Next section reviews the relation between the increase in cash holdings and the financialisation of the firm in developed and emerging economies. Following sections present the model and hypotheses, data and stylized facts, and methodology respectively. We next discuss the econometric results and the last section concludes.
Cash holdings and the financialization of the firm
General motives
A motive for cash and short-term investments demand highlighted by the financialization literature is the quest for financial profitability (Davis, 2018). Various transformations in the operating and financial environment starting in the 1970s and the 1980s originated this shift from NFCs’ more traditional activities and sources of profits. Broadly speaking, these motives can be grouped into two non-exclusive reasons.
The first highlights the different types of problems in the production sphere. Magdoff and Sweezy (1987) point towards the stagnation of the economy and the increasing difficulty to realize profits through traditional ways such as private consumption and investment. The underperformance and slowdown of aggregate demand in the 1970s are also highlighted by Davis (2016) and Crotty (2005). On top of this, Krippner (2005) emphasizes the higher degree of labor militancy at home and increased international competition abroad. Moreover, at the same time that NFCs were experiencing different types of difficulties in production, the financial sector presented the opposite situation creating, therefore, incentives to invest in the financial market (Orhangazi, 2008).
The second group of explanations of the shift to financial activities focuses on the internal changes experienced by NFCs in terms of power relations between managers and shareholders (Stockhammer, 2004; Tomaskovic-Devey et al., 2015). Based on the post-Keynesian theory of the firm (Lavoie, 1992; Rabinovich, 2020; Wood, 1975), it is claimed that while managers have a preference for growth, shareholders favor profits. The alignment of the former´s preferences with those of shareholders was introduced by the hostile take-over movement and changes in pay structure, which resulted in NFCs becoming more rentier-like and abandoning growth-oriented priorities.
Paradoxically, the quest for financial profits linked to the increased acquisition of financial assets, or what Rabinovich (2019) defines as the financial turn of accumulation hypothesis, has been tested only indirectly (with the exception of Davis, 2018) and somewhat disconnected from the corporate finance literature on cash holdings. We say indirectly because most empirical studies focus on the effect of financial income on physical investment (capital expenditures) rather than financial investments (see, e.g., Orhangazi, 2008; Stockhammer, 2004; Tori and Onaran, 2018, 2020). Negative and significant values of the estimated parameters are thus interpreted as a proof of the turn to financial accumulation that crowds-out productive accumulation (Hecht, 2014; Orhangazi, 2008; Stockhammer, 2004).
However, in many cases, different types of financial assets are found to have a positive effect on investment. Davis (2017) takes a broad definition of financial assets that includes cash and short-term investments, current receivables, other current assets (less inventories) along with investments and advances, finding a positive relation with investment. A financial profit rate is found to have a positive effect on investment as well. She interprets them, respectively, as due to the greater flexibility provided by liquid financial assets to support real investment, and the possible complementarities between the financial and non-financial components of their business (e.g., store-issued credit cards supporting the sales of non-financial products). Some paradigmatic case studies such as those carried out for Ford or General Electric have focused on that aspect of their business model (Froud et al., 2006). Other econometric studies take a narrower definition of financial assets like Auvray and Rabinovich (2019) and Hecht (2014) who consider cash and short-term investments only and still find that they are positively correlated with investment.
Mainstream literature has also pointed to this direction. CSTI may prove to be the only source of liquidity when no other access to finance is available and thus propel real operating activities and investment. Myers and Majluf (1984) posit that when information asymmetries increase the cost of raising external capital, firms with reliable investment projects) will avoid external finance. Thus, when facing liquidity requirements (such as investment disbursements or debt repayments), firms will first resort to internal financing, then turn to debt, and finally issue equity (for a review of the pecking order theory see Frank and Goyal, 2008).
Besides this, when firms are financially constrained and cannot secure external finance, they are prone to accumulate cash and equivalents out of current cash flows to meet future investment opportunities and debt repayments. Almeida et al. (2004), show that firms with unconstrained access to external finance find no reason to safeguard against future investment needs by managing corporate liquidity. In contrast, firms facing financing constraints may find that saving cash out of current cash flows becomes crucial to timely take advantage of investment opportunities when they arise. They empirically test this hypothesis and find strong support in a sample of US companies. In addition, Acharya et al. (2007) consider an alternative use of internal funds to hedge future investment against income shortfalls: the repayment of debt, that allows higher debt capacity to be available when investment opportunities emerge.
Emerging-markets specific motives
Although traditionally focused on developed economies, the financialization literature has progressively broadened the scope incorporating emerging market economies, usually comparing them with their developed peers (for a review see Bonizzi, 2013; Bortz and Kaltenbrunner, 2018; Karwowski and Stockhammer, 2017; specifically for Latin America see Abeles et al., 2018; and for the corporate sector see Rabinovich and Pérez Artica, 2020; Torija Zane & Gottschalk, 2018). In the case of NFCs, the motives allegedly making them move towards finance were, in many cases, also present in emerging market economies. The falling rate of profit, higher returns in the financial sector and poor macroeconomic performance are examples of them (Demir, 2007, 2009a, 2009b). 4
On top of these common explanations, scholars have highlighted some specific causes which make the quest for financial profit more compelling in emerging countries. To begin with, interest rates tend to be consistently higher in these economies. This can be attributed to internal and/or external reasons. The former include factors such as higher inflation, foreign-denominated debt burden, current account deficits, and default history, among others (Bellas et al., 2010; Cantor and Packer, 1996). However, even with strong internal fundamentals, emerging market economies may still need to keep interest rate differentials due to their subordinate role in the international financial system (Conti et al., 2014; Kaltenbrunner, 2015). In any case, as put by Bonizzi (2013: 85), “financialisation through interest income may be of particular relevance for many developing countries, since inflation and the need to encourage capital inflows (or discourage capital flight) has often induced these countries to adopt high interest rates.”
Higher interest rates offer the opportunity to simply hold high yielding bonds or engage in more complex and speculative activities like carry trading, which involves exploiting interest rates differentials by becoming indebted in AE (typically with lower interest rates) and investing in EME (typically with higher interest rates). Although traditionally associated with financial institutions, different authors found that in the presence of capital controls, in the aftermath of the GFC non-financial firms from emerging market economies have been increasingly engaged in such activities, acting as surrogate financial intermediaries (Shin, 2014). Non-financial corporations have comparative advantages in bypassing capital controls compared to financial institutions mainly through intracompany loans which are classified as FDI in the balance of payments (Acharya and Vij, 2020; Avdjiev et al., 2014; Kim and Shin, 2021; McCauley et al., 2013).
So far, a growing literature has shown that the bulk of the proceeds from such bond issuances has been used to accumulate local currency-denominated financial assets. Using firm-level data from 18 emerging economies, Caballero et al. (2016) find a positive and statistically significant impact of capital controls with regards to liquid financial assets. Bruno and Shin (2017), also using firm-level data from both emerging and advanced economies, show that the firms belonging to the first group, vis-à-vis their advanced economies peers, borrow more in dollars when they already have high cash balances and maintain a higher proportion of those funds in cash within the next 3 years. From a group of possible explanations including precautionary motives, capital expenditures, R&D, long-term debt reduction, and carry trade, the authors find evidence for the latter. Hardy and Saffie (2019) also find evidence of carry-trading for Mexican firms but they associate this with lending credit to related partners, rather than holding CSTI.
Speculative activities by NFCs from emerging market economies are not only limited to carry trades. Farhi and Borghi (2009) report cases from Brazil, Mexico, and Hong Kong in which financial derivatives were used to bet that their national currencies wouldn´t depreciate against the dollar rather than hedging, and had enormous losses. Although in most cases these NFCs were exporters, therefore making sense to protect themselves from appreciation, the amounts were much higher than the volume of exports. Chui et al. (2014) add the cases of South Korea and China and discuss the contracts with a “knock-in, knock-out” (KIKO) feature which had lower costs but were more risky, as exporters would be forced to sell their dollars at below market prices if domestic currency depreciated. Zeidan and Rodrigues (2013) focus on the example of a Brazilian company, Aracruz Celulose, who lost more than US$2 billion with currency derivatives. Using a panel of 200 Brazilian NFCs which represent approximately 68% of all market capitalization in Brazil, Rossi Júnior (2013) shows that approximately 15% of derivatives users could be classified as speculators in 2008 and 2009.
Studies specifically focusing on the determinants of CSTI and financial assets’ increase by Latin American firms are scarce. Torija Zane and Gottschalk (2018) discuss the hypothesis of carry trade but do not test it empirically. Pérez Artica et al. (2018) document the increase in cash holdings and highlight the relevance of macroeconomic factors such as exchange rate fluctuations, balance of payment result and GDP growth. However, they do not consider financialization as one of the possible explanations. Neither do Arata et al. (2015) who find that international Brazilian and Mexican firms hold more cash than their non-internationalized peers.
Finally, an interesting distinction can be derived from the financial activities engaged by NFCs in emerging and developed countries. In the case of the latter, case studies generally show that they are related to the provision of financing to their clients (Froud et al., 2006). Therefore, it is an activity that is dependent on their main production. In the case of NFCs belonging to emerging markets, the engagement in financial activities is also originally related in many cases with their main activity (managing foreign currency and financial derivatives due to exports) but then becomes independent of it. In this sense, it could also be argued that NFCs from emerging market economies could be more financialized than their advanced economies peers.
Model and hypothesis
Based on the theoretical insights developed in the previous section we propose to estimate the following equation
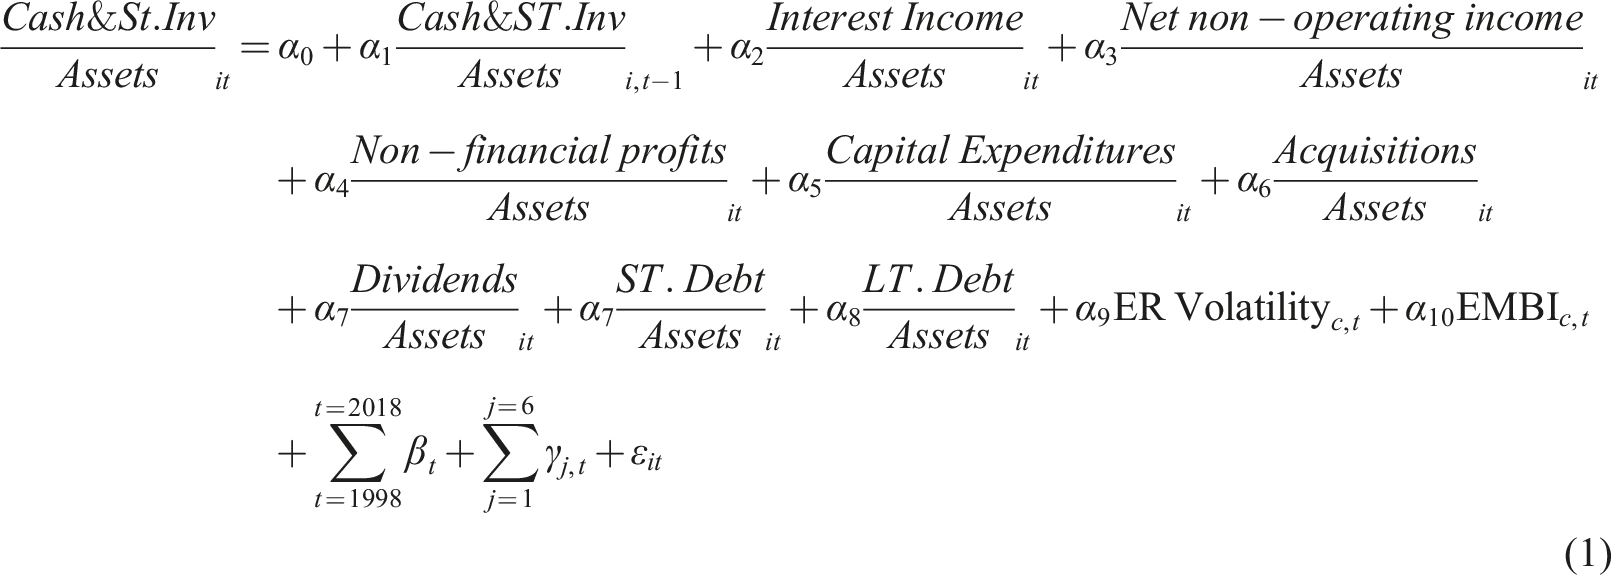
Our dependent variable is defined as CSTI (Compustat Data Item 1) over total assets (Compustat Data Item 6). This is a standard variable used in the literature (Bruno and Shin, 2017; Caballero et al., 2016; Shin and Zhao, 2013). The numerator includes both immediately negotiable medium of exchange or any instruments normally accepted by banks for deposit and interest-bearing assets which may be converted to cash within a relatively short period (CDs, money market accounts, high-yield savings accounts, government bonds, and Treasury bills). Our equation includes a lagged value of CSTI in order to capture the dynamic nature of cash holding decisions or its path dependency (we also refer the reader to the methodology section for further rationale)
We regress this cash and short-term investments ratio on a set of firm-level regressors intended to capture the effect of two types of financial income and control for a set of theoretically relevant variables that consider the main sources and uses of funds available for the firm. We describe each regressor below.
Interest income (Compustat Data Item 62) comprises interest and dividends from investment securities and interest from securities of national and local governments. We take the ratio to total assets and do not subtract interest expenses. Calculating a measure of “interest profitability” with the later would result in a downward biased measure since interest expenses compute all financial expenses rather than those limited to the cost of acquiring and holding financial assets (i.e., it includes interest from debt taken to finance productive activities). Figure A1 in the online appendix illustrates this.
Additionally, and to further capture income generated by other financial activities like exchange rate movements and other capital gains, we also consider non-operating income net of interest income (Compustat Data Item 61 minus Compustat Data Item 62). This variable is broader than interest income including any income (net of expense) that results from secondary or non-operating business-related activities (i.e., excluding those considered part of the normal operations of the business). 5
The hypothesis we want to test is the following: if firms are actively engaging in financial activities, then the
In an article with a very similar objective to ours, Davis (2018) also used interest income as an explanatory variable. In this paper, we further include other potential sources of financial income. We believe this is a better choice than other alternatives found in the literature. Bruno and Shin (2017) focus more concretely on carry trade and calculate it as the difference between the domestic money market rate and the US money market rate divided by a measure of volatility. Caballero et al. (2016) also take a differential between rates. In both cases, a country-level measure is imputed to each firm rather than what they are actually earning. By choosing a measure that captures the proceeds from financial investment for each firm, we avoid that problem.
In terms of our control variables, firms save cash out of their cash flows to prevent future liquidity shortages (Acharya et al. 2007). Consequently, we control a variable we call Non-financial profits, and we measure it as the ratio of income before extraordinary items (Compustat Data Item 18) net of non-operating income to total assets. 6 We expect the corresponding parameter to be positive.
One of the main uses of funds is related to the expansion of the firm through capital expenditures and mergers and acquisitions. The fact that firms will mostly turn to their cash holdings in the first place when incurring in capital expenditures has been highlighted by different theoretical strands, both mainstream (Bates et al., 2009; Myers and Majluf, 1984) and non-mainstream (Eichner, 1976; Wood, 1975). Capital expenditures (Compustat Data Item 128) and Acquisitions (Compustat Data Item 129) are measured as a proportion of total assets, and we expect its parameter to be negative.
Dividends are measured as dividends paid (Compustat Data Item 127) to total assets. As in the case of capital expenditures, firms will use their cash holdings when deciding to distribute to their shareholders. In addition, firms that pay dividends tend to be less risky and have greater access to capital markets, thus reducing the need for precautionary cash holdings (Bates et al., 2009; Hadlock and Pierce, 2010). Thus, we also expect this parameter to be negative.
We take two measures of debt: short-term debt (Compustat Data Item 34) and long-term debt (Compustat Data Item 9), both as a ratio of total assets. Both assess the extent to which firms access to credit and debt markets and are therefore relevant for cash holding management. On the one hand, we could expect these coefficients to be negative, reflecting a lower need to hedge against financial constraints. On the other hand, firms have been increasingly engaged in offshore long-term bond issuance after the GFC (Avdjiev et al., 2014) accumulating part of those proceeds as CSTI. Therefore, the effect of short-term debt is indetermined but we expect a positive effect for the long-term one during the second period.
Besides these firm-level variables, we include a set of sectoral dummies capturing the specificities of each sector as well as time dummies controlling for general macroeconomic fluctuations. Cash holdings are also affected by perceived uncertainty and Latin America is a particularly volatile region, characterized with big fluctuation in different variables vis-à-vis the rest of the world, even other EME (Bértola and Ocampo, 2013, chapter 1). We pick the Emerging Markets Bond Index (EMBI) and exchange rate volatility to control for each country risk. We calculate the latter by applying the standard deviation of the logarithmic monthly changes using BIS information while we collect the EMBI from the World Bank.
Data and stylized facts
We extract our data from Compustat Global database that includes information, among others, on Latin American publicly listed firms’ Balance Sheet, Income Statement, and Cash Flow Statement. Compustat provides standardized and consolidated firm-level information for listed companies that we organize according to the Standard Industrial Classification (SIC) of each corporation excluding financial firms identified by the primary codes from 6000 to 6799. Working with consolidated information implies that all subsidiaries are included, even the financial ones. This represents an advantage as we capture the whole range of NFCs’ operations. We use annual information for all active and inactive, publicly listed NFCs in Argentina, Brazil, Chile, Mexico, and Peru between 1998 and 2018. 7
It can be seen in Table A1 in the online appendix that the number of firms differs among countries. This is also the case in some other important dimensions such as mean values of CSTI, interest income, and size, among others. Apart from this, the firms that are considered in our study are only those listed ones, a particular sub-sample of the whole population of firms within each country characterized by larger firms. Therefore, our results should be taken with caution not only in terms of the representativeness for the whole country but also for comparative purposes among them.
As it is usually the case, our firm-level data requires some treatment before we can apply econometric techniques. In terms of missing values, we eliminate those observations with no info or nil values in net property, plant and equipment; net revenue; total assets and liabilities; CSTI; non-financial profits; interest income and net non-operating income. On the other hand, we transform missing values of capital expenditures, acquisitions, and dividends into 0. Once we have done this, we only take firms that have at least four consecutive observations, something required for our Generalized Method of Moments (GMM) econometric technique (Bond et al., 2003). This is to assure that our test statistics are calculated for each firm and to avoid missing values in our focal variables. In terms of extreme values, we winsorize all variables at the upper and lower 0.5% of each variable’s distribution. Table A1 provides the basic descriptive statistics of the data we will be using and Table A2, a correlation matrix. A quick look to the latter indicates there are no collinearity problems with our variables.
Figure 1 presents the evolution of four types of assets: “cash and short-term investments,” “receivables” (Compustat Data Item 2), “other current assets + other assets” (Compustat Data Items 68 + 69), and “investments and advances” (Compustat Data Items 31 + 32). Although the first two categories are clear financial assets, the last two also include non-financial ones. As it can be seen there, although receivables started from higher levels and increased in some cases, specially before the GFC, CSTI present a clearer growth. Similarly to receivables, it also increases up to 2007/2008 but then it continues to grow in Argentina and Mexico, and stagnates in Brazil, Chile, and Peru. The “other” category also grew in all cases but Peru. We will also test the effect of interest income and non-operating income net of interest income in the remaining categories of financial assets besides CSTI. Financial assets in Latin American NFCs, 1998–2018.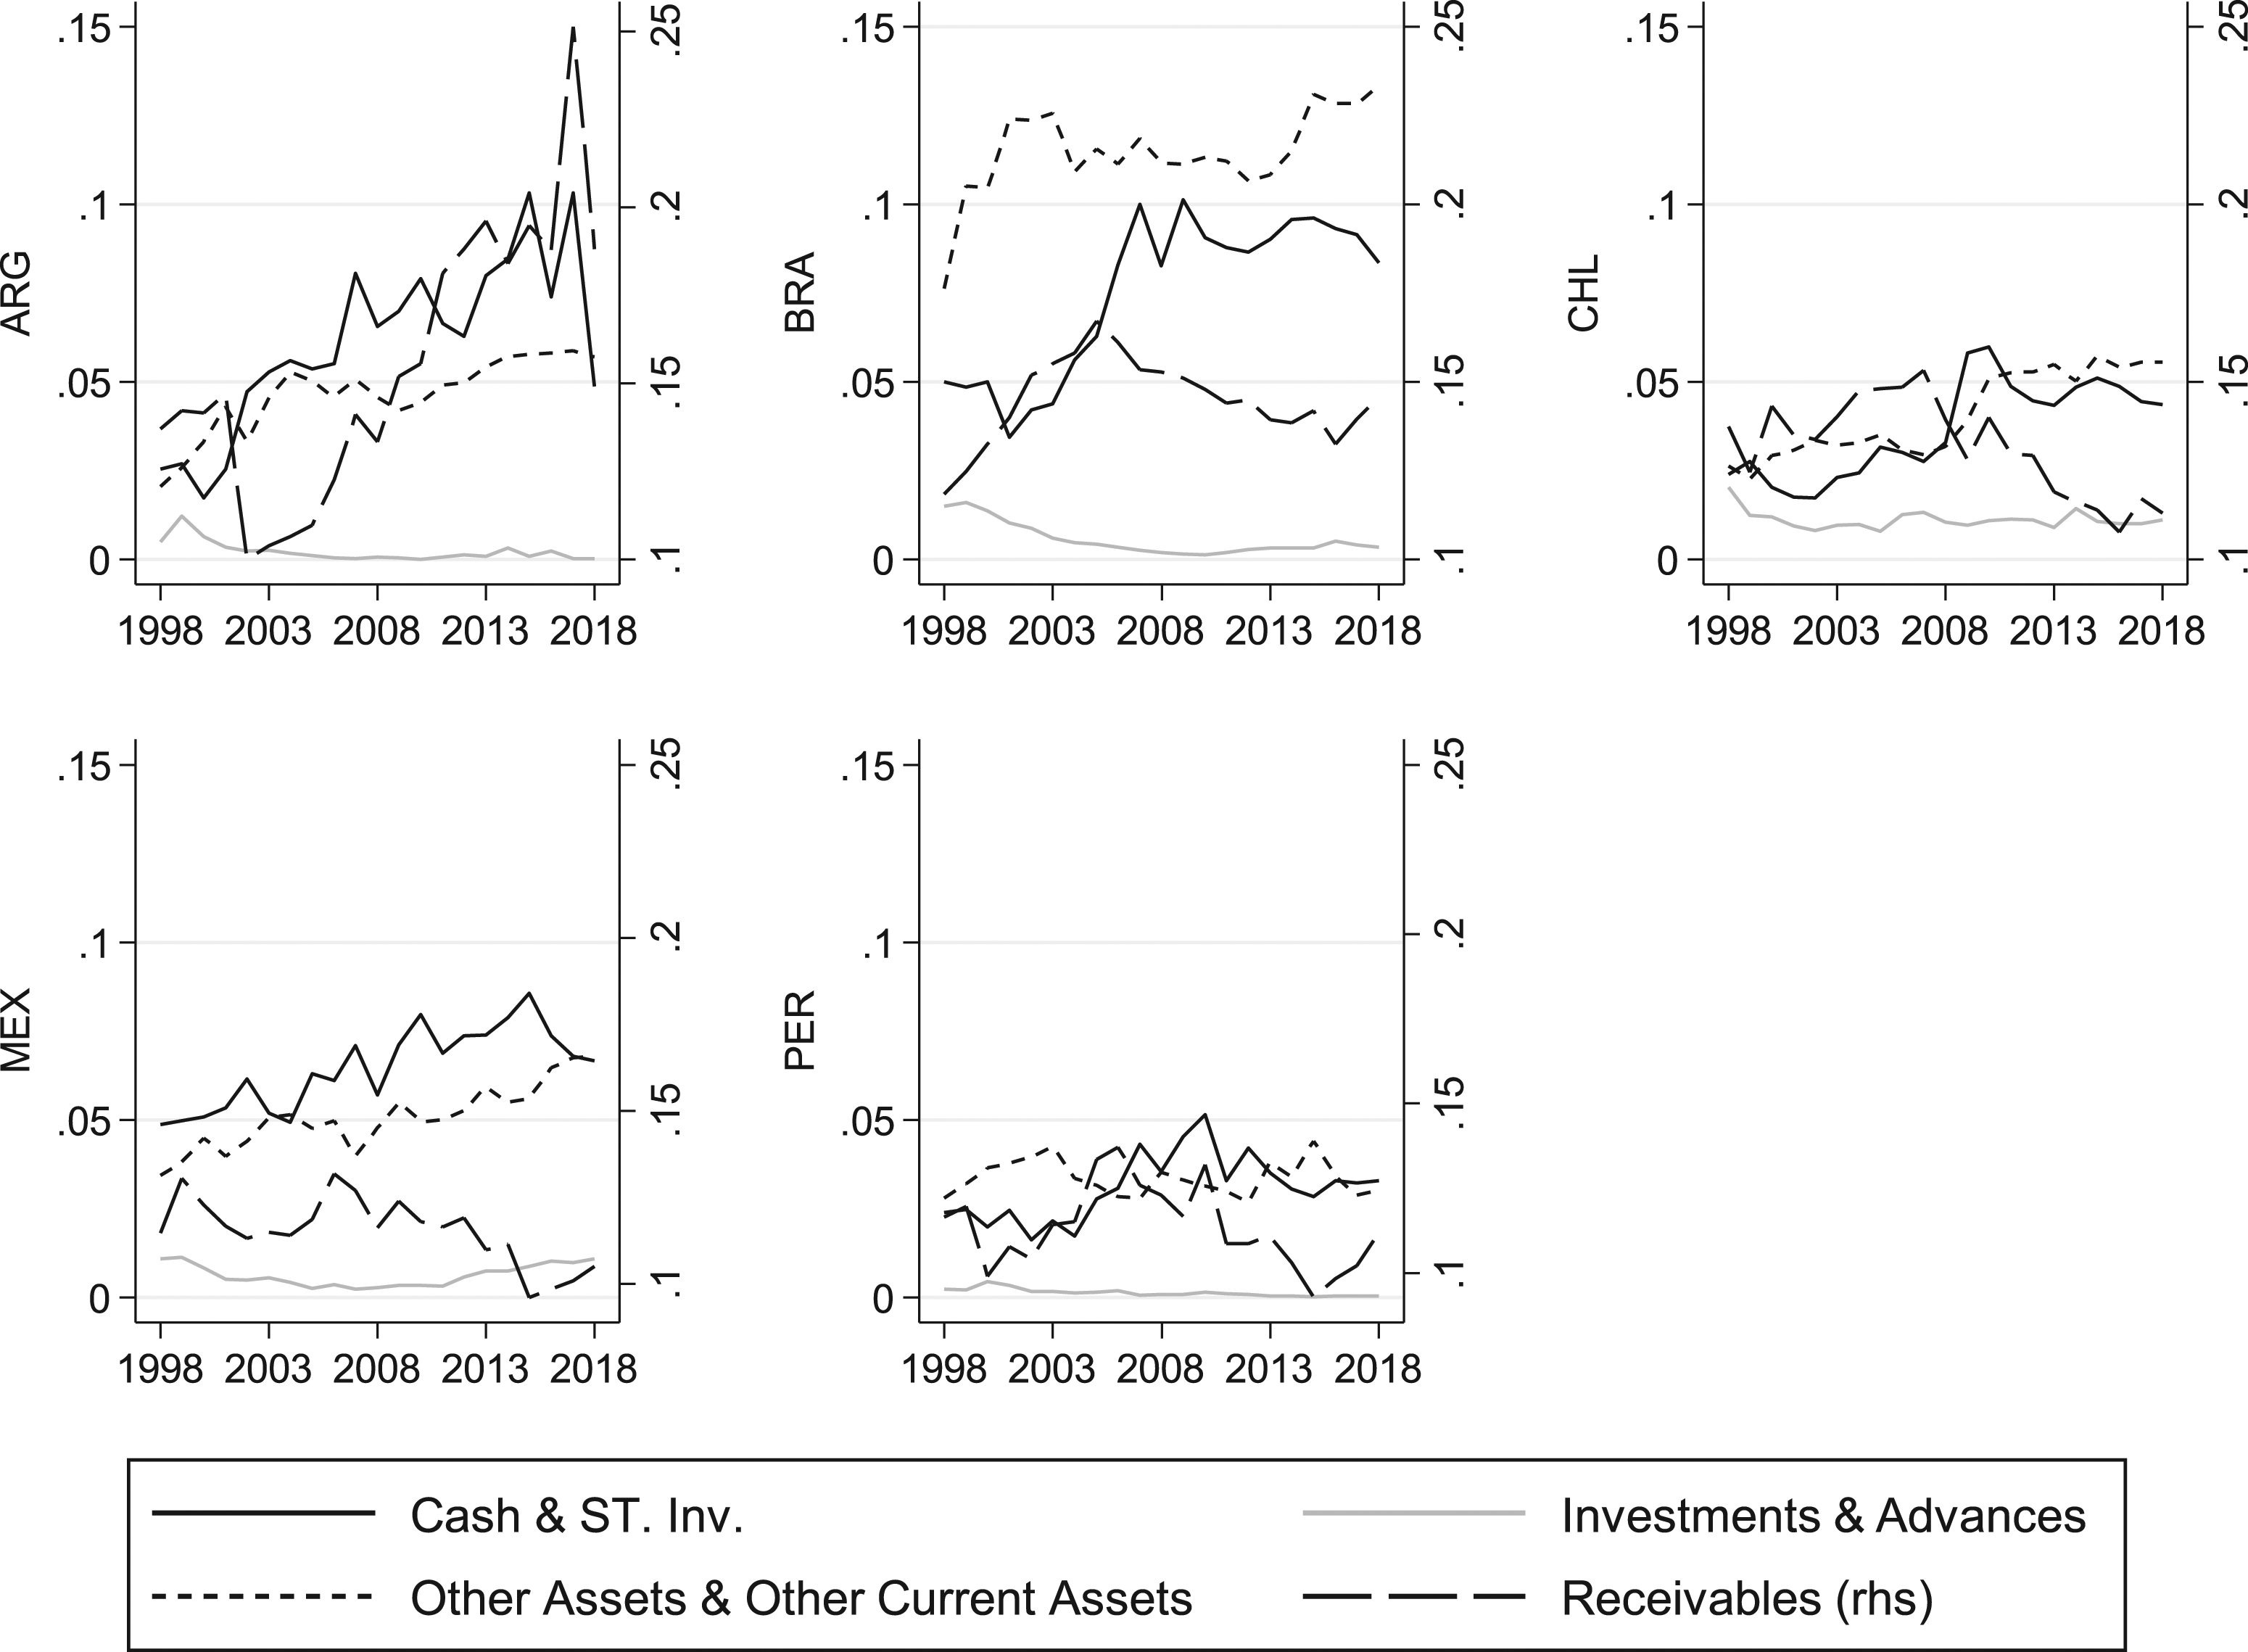
Turning to CSTI only, Figure A2 further indicates that its increase has been shared by all industry groups: Primary (SIC codes 0100–1499), Construction (1500–1799), Manufacturing (2000–3999), Transportation, Communications and Utilities (4000–4999), Wholesale and Retail Trade (5000–5999), and Services (7000–8999). Moreover, the trajectory is similar to that of countries: an increase until the GFC followed either by a decrease or stagnation. However, the primary sector exhibits an impressive increase that reaches a cash-to-assets ratio of almost 15% in 2008. Services come in afterwards with a marked growth as well. In both cases, the ratio decreases afterwards.
The question we are addressing is whether these movements in cash holdings have been linked to a quest for financial revenues. Figure 2 presents, therefore, the evolution of our main variables of interest: interest income and non-operating income net of interest income. For the former, countries display a similar pattern with a decreasing proportion until the beginning of the 2000s followed by an upward phase until the GFC and then a new declining trend (except for Argentina).
8
The latter follows, on the other hand, a more erratic pattern and is, most of the times, negative both at the country and industry level. To recall, this variable captures any income net of expense resulting from non-operating business-related activities such as FX-related gains. Financial income in Latin American NFCs, 1998–2018.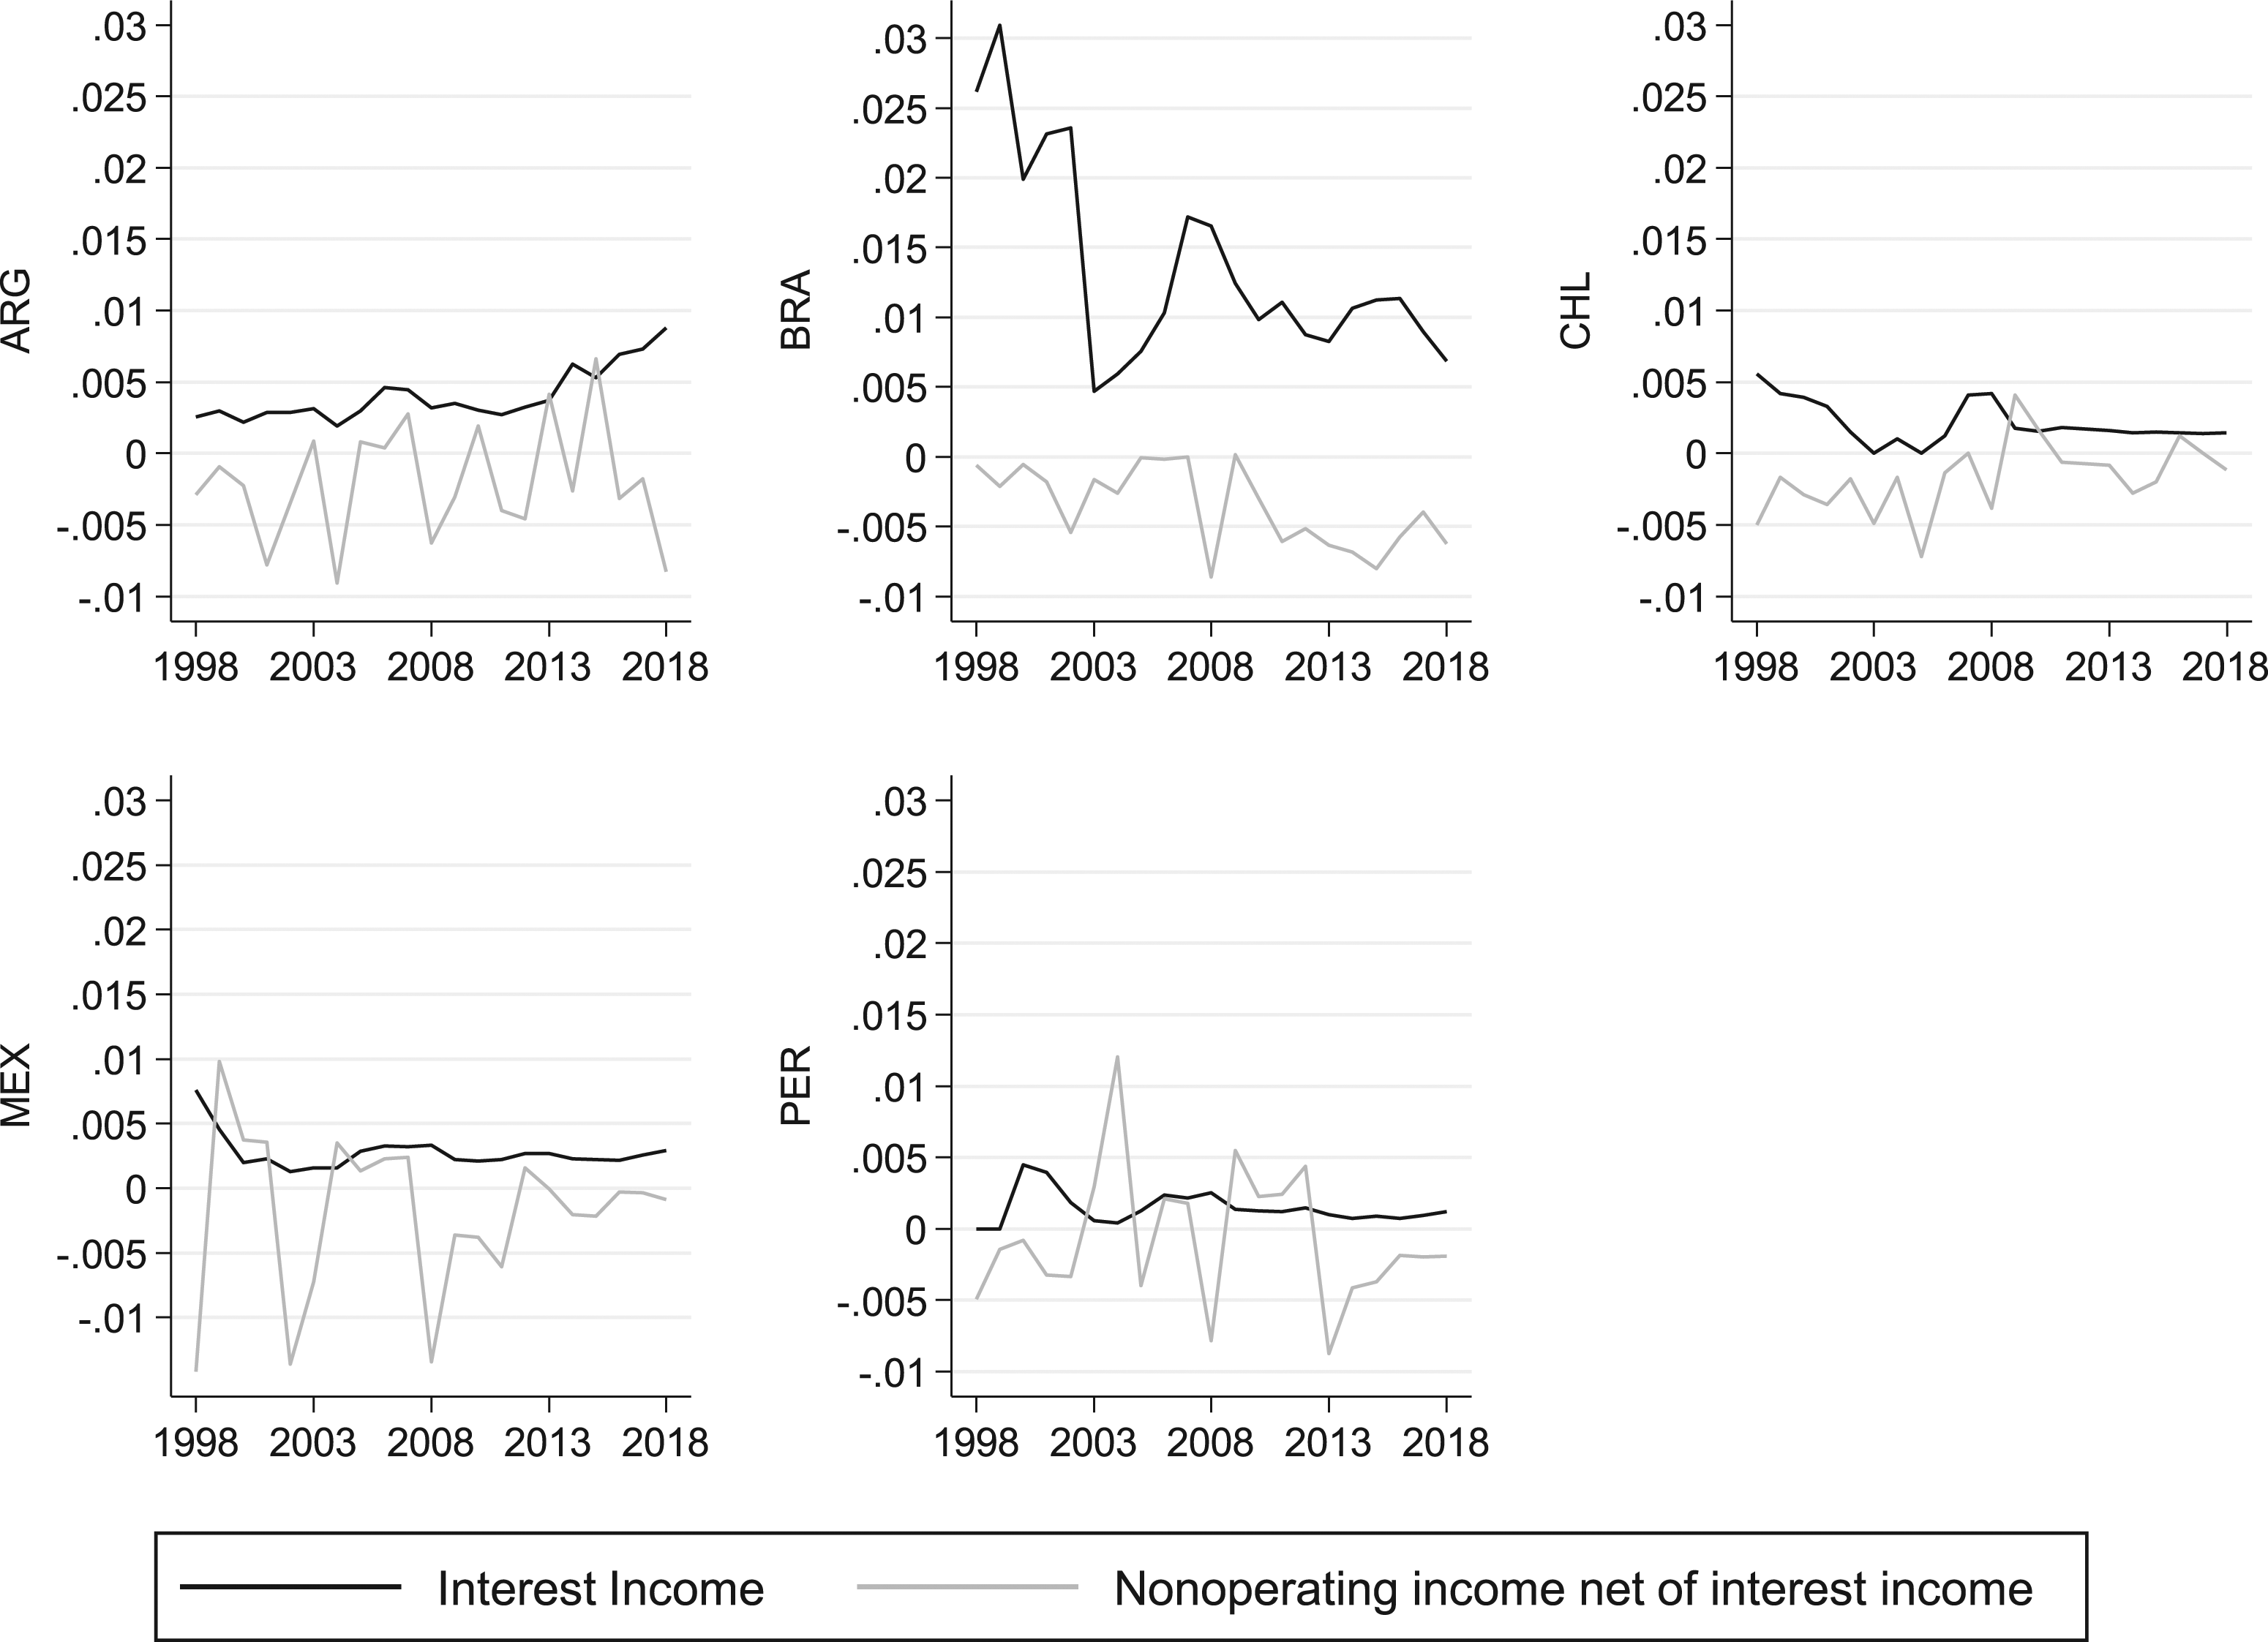
This general pattern is also followed at the industry level (Figure A3). It stands out that the impressive increase in cash holdings in the primary sector does not have a counterpart in terms of interest income. More generally, both figures indicate that interest income does not seem to have played a relevant role in the overall revenue structure of Latin American non-financial firms, being 3% at most in the case of Brazil. Nevertheless, besides these low levels, CSTI and interest income seem to share a common trend especially since the 2000s with an upward trend until the crisis followed by a stagnant or declining one.
Part of this common trend is a logical outcome of the fact that higher cash holdings will generate higher interest income. The question we are posing, however, is rather the reverse. In the next section, we describe the methodology to address it.
Methodology
Endogeneity arising due to unobservable individual heterogeneity is a well-known problem associated with microeconomic data, rendering ordinary least squares (OLS) to be inconsistent as it requires explanatory variables to be uncorrelated with the error term. This is also the case with the within groups estimator (Pindado and Requejo, 2015). Although the transformation into deviations from the means eliminates constant unobservable heterogeneity, taking variables as strictly exogenous in microeconomic decisions is a strong assumption. Moreover, in dynamic panel models, the lag of the dependent variable is, by definition, correlated with the error term. The Within estimator will be biased and its consistency depends upon T being large (Nickell, 1981).
On the other hand, instrumental variables (IV) methods can overcome endogeneity problems as long as the chosen instrument is also uncorrelated with the error term. Generalized methods of moments is a particular IV method where more than one instrument for each explanatory variable can be used. Moreover, rather than looking for instruments outside the model, GMM offers the possibility to use the lags of explanatory variables as instruments. Not only these instruments naturally contain more information than variables outside the model but also, as it was proved by Arellano and Bond (1991) and Blundell and Bond (1998), they are uncorrelated with the error term.
Arellano and Bond (1991) proposed a GMM procedure that is more efficient than that of Anderson and Hsiao (1981). The latter implies first differencing the model to remove the individual effects and then using the second lag of the dependent variable as an instrument for the first lag which would not be correlated with the error as long as it is not serially correlated. The procedure proposed by Arellano and Bond (1991) uses additional instruments based on the orthogonality condition that exists between lagged values of the right-hand side variables and the error term. The estimator has one-step (for homoscedastic disturbances) and two-step variants (for heteroscedastic disturbances). Although the latter is more general, the standard errors are usually low. Nevertheless, the finite-sample correction derived by Windmeijer (2005) adjusts the standard errors for heteroscedasticity making the two-step more efficient than one-step.
Finally, a problem with the original Arellano and Bond (1991) estimator is that lagged levels tend to be poor instruments for first differences. Arellano and Bover (1995) showed that, under certain conditions, when the original equations in levels were added to the system, the efficiency could be increased. Later, Blundell and Bond (1998) provided the necessary assumptions for the augmented estimator more precisely. The new instruments will be valid as long as the stationarity condition is fulfilled: the correlation between the explanatory variables and the unobserved effects does not change over time.
System GMM can generate quite a great number of instruments, something that, although does not compromise consistency, can move it away from the asymptotic ideal and overfits endogenous variables failing to expunge their endogenous components (Roodman, 2009: 98). To reduce the number of instruments, we use one instrument for each variable and lag distance instead of one for each time period, variable and lag distance (we collapse the instrument set).
The correct specification of the model is evaluated by means of 3 tests. The first addresses serial correlation in the disturbance term. Since the model takes first differences, it could have first order but not second order serial correlation in the residuals. The m 1 and m 2 statistics test that (ar1p and ar2p in the tables are the p-values associated with those tests). The final test addresses endogeneity. The Hansen J statistic of overidentifying restrictions evaluates the validity of instruments by testing the correlation between instruments and the error term.
Results
General results
Estimation results based on equation (1). Period: 1998–2018.
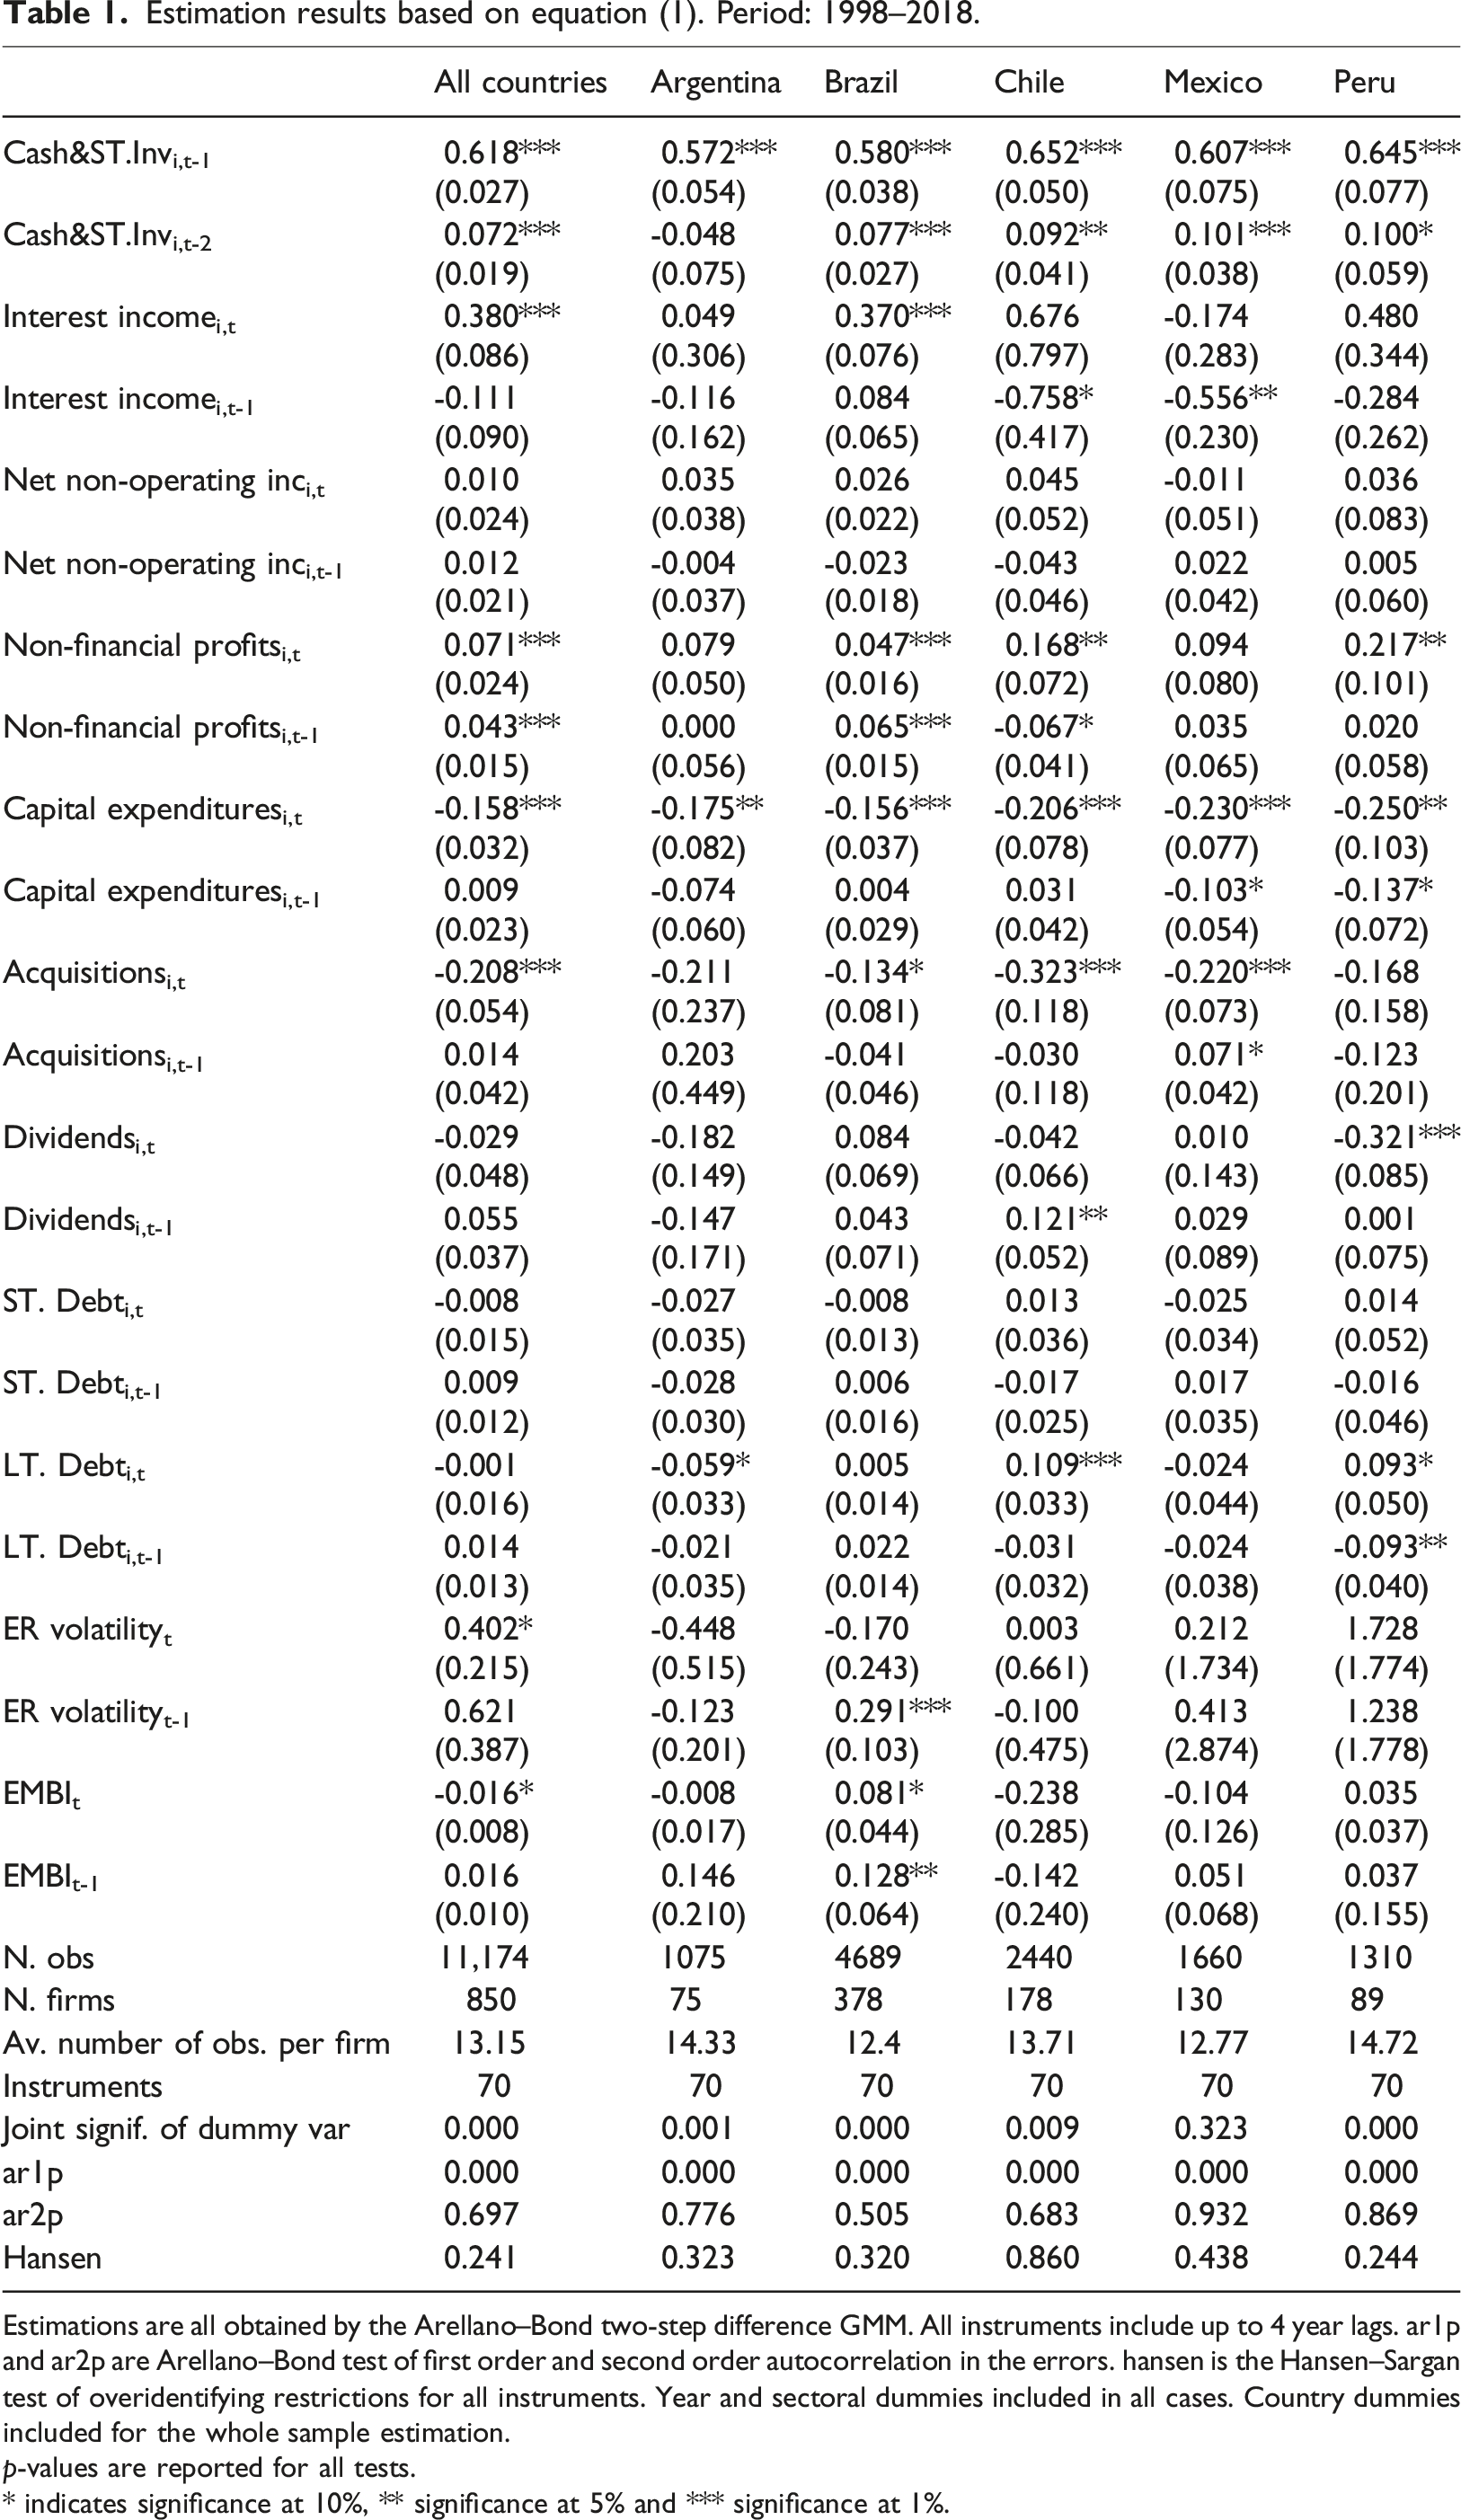
Estimations are all obtained by the Arellano–Bond two-step difference GMM. All instruments include up to 4 year lags. ar1p and ar2p are Arellano–Bond test of first order and second order autocorrelation in the errors. hansen is the Hansen–Sargan test of overidentifying restrictions for all instruments. Year and sectoral dummies included in all cases. Country dummies included for the whole sample estimation.
p-values are reported for all tests.
* indicates significance at 10%, ** significance at 5% and *** significance at 1%.
In terms of our first variable of interest, interest income, we find supporting evidence of a positive effect over CSTI. Nevertheless, this result seems to be driven by Brazil to a large extent considering the weight of that country in the complete sample. Results are statistically significant at the 1% level only for that country. The coefficient is 0.370, which implies that a 1-standard-deviation increase in the ratio of interest income to assets, that is 2.52% in Brazil, generates an increase in the ratio of CSTI to asset of 0.93%, which has a 11.21% standard error. 9 This represents 8.32% of CSTI to assets standard deviation. For the remaining countries it is non-statistically different from zero except from Chile and Mexico where it has a negative value, statistically significant at the 10% and 5% level, respectively. Non-operating income net of interest income, is non-statistically different from zero in all cases.
As we indicated when presenting the data, these results should be restricted to the specific sample of listed firms that are being analyzed rather than a generalized phenomenon happening across all different types of firms. Therefore, not observing positive and statistically significant values for Argentina, Chile, Mexico, and Peru does not imply that the behavior we are studying couldn’t be verified for non-listed firms.
Moving to the other variables, the lagged value of liquidity holdings is statistically significant at the 1% level with similar values ranging from 0.57 to 0.65 in all cases. The second lag is also significant for the whole sample except Argentina. These results confirm the existence of a dynamic process in terms of cash holdings’ decisions, and therefore the importance of using a dynamic model. Additionally, it indicates positive feedbacks from previous values.
Not only the lagged value of liquidity but also other variables are robust across the whole sample and countries. First, non-financial profitability has a positive and statistically significant effect for all countries except Mexico and Argentina (still positive in both cases) showing that firms retain part of the internally generated cash flows. Second, a result that is robust across all countries is the negative and statistically significant value of capital expenditures and acquisitions. This indicates that whenever firms decide to increase their productive capacity, they will turn to their internal cash holdings: all countries have a negative and statistically significant effect which is close to 0.2 in all cases. Other variables such as debt (both short-term and long-term) and dividends are non-robust and less significant. ER volatility has a positive and statistically significant value driven mostly by Brazil indicating that, at least for that country, firms have increased their cash holdings when facing uncertainty. This result is also confirmed by the positive and statistically significant value of EMBI in Brazil.
Tables A3 and A4 present the results for two periods, before and after the GFC. As it was highlighted in Figure 1, the highest increase in cash holdings was verified on the eve of the crisis. After that, both cash holdings and financial income stabilize or slightly decrease. Results from Table A3 indicate that higher levels in cash holdings during the first period are related to interest income for Brazil only. Interestingly, both the contemporaneous and lagged value of net non-operating income become positive (but non-statistically significant) for Brazil only. This result is consistent with the previous literature that found speculative activities carried by those firms before the crisis (Farhi and Borghi, 2009; Rossi Júnior, 2013) as well as case studies (Zeidan and Rodrigues, 2013). For Chile and Mexico, interest income still maintains a negative and statistically significant value. The other control variables remain similar.
The second period (Table A4) show interest income being statistically significant for Brazilian and Chilean NFCs. Differently from the previous period, long-term debt becomes positive and statistically significant for Brazil. This is consistent with Bruno and Shin’s (2017) finding that emerging market economies’ firms use of bond proceeds for cash saving is driven mainly by the post-2007 period, when the demand for high-yield corporate bonds surged. Argentina and Peru, on the other hand, present negative and statistically significant values for interest income.
Summing up, firms tend to hold more cash when they are more profitable and collect larger internal funding. By contrast, firms tend to decrease their cash holdings when they carry out capital expenditures and acquisitions. These results are consistent with traditional pecking order models of cash, as discussed by Opler et al. (1999) and Bates et al. (2009). In terms of financial revenues, our evidence points mainly towards Brazil as the case in which we find statistically significant results in both periods, while Chile stands out in the aftermath of the GFC (although at a lower statistical significance vis-à-vis Brazil). We will next test the robustness of these results and dig further into them. For reasons of space, we present full tables in the Online Appendix.
Robustness checks and further analysis
First, we carry out an exercise that further considers the relation of CSTI with firm size. The financialization literature recognizes differential effects in terms of size, with bigger firms engaging more in financial activities. Orhangazi (2008) finds that financial payouts and financial income present a negative and significant effect on capital expenditures which is 50% higher than for small firms. Davis (2017) also finds a negative and significant effect of financial payouts for larger firms. We therefore create a dummy for the upper quartile (P75) of total assets by year and country, and present results interacting that dummy with our two measures of financial income during the two different periods discussed above (Tables A5–A6).
During the first one, both Chile and Mexico show a positive and statistically significant effect for the interaction term with net non-operating income at the 5% and 10% level, respectively. In the second period, the interaction term with net non-operating income becomes positive for Brazil. At the same time, we find negative and statistically significant interaction terms for that same variable for Argentina and Peru in the first and second period, respectively (also for the interaction between size and interest income in Peru). Considering both periods altogether, our main results do not seem to be driven by big firms as interest income is still significant in Brazil during both periods and Chile during the second, and additional effects are not robust. Additionally, we evaluate both interest income and non-operating income by size quintiles in Figures A4–A5 and show that the evolution of those types of financial income is similar across sizes.
Second, we also evaluate whether our findings are driven by a specific sector (Tables A7–A8). To that end and based on the conclusions of previous works that found higher speculating activity for those firms with higher exchange rate exposure and export activity (Farhi and Borghi, 2009; Rossi Júnior, 2013), we interact interest income variable with a sectoral dummy for the primary sector. In both periods, when significant, values are either negative or flip from positive to negative. On the other hand, results for Brazil are not altered suggesting that firms’ behavior in relation to financial income is generalized across sectors. Overall, the primary sector is not behind our findings.
Finally, we assess whether our measures of financial income are related to the other categories of financial assets (both the clearer categories like receivables as well as the blurrier ones), again dividing the sample in two periods (Tables A9–A14). Results are overall weak in almost all cases, both for interest income and non-operating income net of interest income which indicates that, from all possible financial assets, CSTI are more clearly connected with financial revenues.
Conclusion
This article has focused on the evolution of cash and short-term investments from listed NFCs belonging to Argentina, Brazil, Chile, Mexico, and Peru trying to identify, specifically, whether the quest for financial income was a determinant driver. Cash and short-term investments typically include interest-bearing assets and different scholars have presented evidence for and against the hypothesis of a financially driven accumulation by NFCs from advanced economies. However, the relevance for emerging markets has been comparatively off-radar.
Paradoxically, studies focusing on the specificities adopted by financialization in emerging economies have highlighted the comparatively better prospects offered by these countries vis-à-vis developed to engage in such activities. Emerging markets typically have higher interest rates than advanced economies. When these are coupled with fixed or semi-fixed exchange rates (if the exchange rate is constant or appreciating) they allow for carry trades. Non-financial corporations also have better opportunities compared to financial firms to bypass capital controls. Other studies have highlighted different cases of NFCs using financial derivatives to speculate rather than hedge against the volatility in national currencies.
Overall, our results cast doubt on the predominance of these speculative behaviors on an aggregate basis, an hypothesis that characterized early works on financialization both in developed (Crotty, 2005; Krippner, 2005) and developing economies (Demir, 2007, 2009a). Although more recent literature has criticized the validity of what has been termed the turn to financial accumulation hypothesis for the USA (Fiebiger, 2016; Rabinovich, 2019) this is the first paper that critically evaluates it in developing economies. Although it is true that non-financial firms have been more involved with financial markets and increased their holdings of financial assets, the motivation behind that decision does not seem to be related to financial profit-making.
We show this by using annual firm-level data for the last 20 years and testing the relation between interest income, net non-operating income and cash and short-term investments. Our results point towards Brazil mostly, with interest income standing out in relation to non-operating income as a driver of CSTI accumulation. The surge in CSTI occurred in the years before the GFC, remaining constant or slightly decreasing afterwards. When dividing the sample in two periods, we found that Brazil presents positive effects for interest income in both periods whereas Chilean firms only in the second (although with a low statistical significance).
Further econometric exercises showed that big firms were more actively engaged in financial profit-seeking accumulation in Mexico and Peru before the GFC and Brazil afterwards. In all these cases, the effect is through non-operating income rather than interest income. In fact, we find a negative effect of interest income in cash holdings in Mexico and Peru. Apart from CSTI, we further explored other categories of financial assets (receivables) as well as other groups that include both financial and non-financial assets (investment and advances and other current assets + other assets and current assets). However, we did not find significant results in these cases.
All in all, the only case where we find more consistent evidence of financial profit-seeking is Brazil. Besides the results in interest income and non-operating income discussed in the previous paragraph, long-term debt relation to CSTI also becomes positive after the GFC which is consistent with Bruno and Shin’s (2017) finding that emerging market economies’ firms use of bond proceeds for cash saving. Still, these results for Brazil can be nuanced due to various reasons. Only interest income is consistently significant in all our specifications. However, the economic relevance of this relation seems mild as the increase in one standard deviation of interest income only represent 8.32% of CSTI standard deviation. Additionally, the proportion of interest income over total assets has been fairly low (a maximum of 3% at the beginning of the period) even without considering, due to lack of data, the cost of acquiring, holding and trading financial assets. Moreover, non-operating income net of interest income has become increasingly negative throughout the period. Therefore, further and more concrete analysis on specific sectors and firms’ sizes in Brazil would be welcome (as an example of this see Cassini et al., 2019).
Although the objective of this article has been limited to test financialization-related hypotheses in relation to the determinants of CSTI, rather than all possible drivers, our results are consistent with traditional pecking order models of cash management. We find that firms tend to hold more cash when they are more profitable and collect larger internal funding and decrease their cash holdings when they carry out capital expenditures and acquisitions. Additionally, in line with findings in the corporate finance literature (Bates et al., 2009), we find evidence of a precautionary motive for holding cash, as exchange rate volatility has proven to be significant, mostly in Brazil.
Besides this general picture, we can point to some limitations of this research and qualify our results. First, results for non-operating income net of interest income need to be taken cautiously as this variable includes various types of non-financial income. Second, our database presents incomplete information to individually identify cash, on the one hand, and short-term investments, on the other. Therefore, additional research is needed in one-by-one cases with the help of the financial statements and their notes.
Supplemental Material
Supplemental Material—Cash holdings and corporate financialization: Evidence from listed Latin American firms
Supplemental Material for Cash holdings and corporate financialization: Evidence from listed Latin American firms by Joel Rabinovich and Rodrigo Pérez Artica in Competition & Change
Footnotes
Acknowledgements
We would like to thank the two anonymous referees for their very helpful comments on different drafts of this paper. Earlier versions of this paper have been presented at the Workshop “How to Conceptualise Financialisation in Developing and Emerging Economies? Manifestations, Drivers and Implications” in Cambridge, UK (December, 2018) and the “Financialization and Development in the Global South” Conference in Buenos Aires, Argentina (November, 2019). The paper has benefited from discussions there and from comments by Tristan Auvray, Nicolás Zeolla, João Pedro Scalco Macalos, Cristiano Duarte and Annina Kaltenbrunner. All errors and omissions remain the sole responsibility of the authors.
Author Contributions
Both authors contributed equally.
Declaration of conflicting interests
The author(s) declared no potential conflicts of interest with respect to the research, authorship, and/or publication of this article.
Funding
The author(s) received no financial support for the research, authorship, and/or publication of this article.
Supplemental Material
Supplemental material for this article is available online.
Notes
References
Supplementary Material
Please find the following supplemental material available below.
For Open Access articles published under a Creative Commons License, all supplemental material carries the same license as the article it is associated with.
For non-Open Access articles published, all supplemental material carries a non-exclusive license, and permission requests for re-use of supplemental material or any part of supplemental material shall be sent directly to the copyright owner as specified in the copyright notice associated with the article.