
Abstract
Training is identified as a key feature of good quality work. Labour market education and training in the United Kingdom, however, operates within a weak institutional context and state interest is reserved for supply issues. Employer demand for a skilled labour market is constrained and the burden of investment in training is left with the individual. Can adult training in the United Kingdom offer a pathway to better work and life outcomes, particularly for those who are already disadvantaged? Using a longitudinal nationally representative data set, the UK Understanding Society initiative (2010–2020), we identify the effects of different types of training and their intensity on life satisfaction. We assess how the impact of training on life satisfaction is moderated by the socio-demographic characteristics of the learner, namely, employment status, gender, ethnicity and migration status, age and deprivation of the area in which they live.
Introduction
Job quality policy and academic work have brought into focus the benefits of better work with regard to economic and social outcomes, alongside the costs of low quality work (see Findlay et al., 2017 for a review). Transnational collaborations (UNESCO, 2016; OECD, 2014) promote initiatives to generate better quality work through technological enhancement in the workplace and to mobilise the structural levers that can support better quality work and life opportunities in this regard. Training is a key feature of the academic and policy narrative on job quality. Participation in high quality training provides individuals with a means of obtaining the skills they need to access better quality work. For employers, higher job quality promotes greater innovation and skill utilisation (Watson et al., 2018). Bad jobs, by contrast, are characterised by features including poor pay, precarious employment protection and security, and limited training and career development opportunities (Findlay et al., 2017; Murray et al., 2023). The direct effects of poor quality work impact individuals and also specific groups, such as women, ethnic minorities, people with low qualifications and people excluded or marginalised from the workplace. But the indirect effects on organisations and government are also significant. For organisations, low quality work can lead to higher employee turnover rates because of a lack of meaningful and satisfying work, or higher absence and sickness due to worker stress and burnout (Daniels et al., 2022). For governments there are spillover demands on health and well-being services, social security provision to subsidise low-paid employment, and slow or lower gross national product (GDP) due to low productivity (Chandola, 2010).
On the face of it, the drivers of better work in industrialised economies seem obvious, but delivery remains stubbornly elusive and highly variegated both across and within nations. Solving the problems of addressing inequalities involves understanding the national contextual features that shape the quality of work and learning which levers might work better and for whom. Skills policy and economic growth strategies are particularly sensitive to local context (Phelps et al., 2005; Tregaskis and Almond, 2018) and with regard to which implementation of national policy may play out in different ways.
In this article we focus on training, which is identified as a critical pathway by which people can access better quality work and life opportunities. We use a nationally representative panel data set of work and non-work training in the United Kingdom, which enables us to contextualise training provision within the wider UK skills policy and business model debates. Adopting the measure of life satisfaction as an individual’s appraisal of the quality of their life outcomes we evaluate the relationship between the type (work and non-work related) and quality of training (measured in terms of duration). As the costs of bad jobs are shown to fall differentially on different groups within society, we include six moderators, and track the same individuals over a 10-year period from 2010 to 2020. In doing so we seek to challenge the thesis that training is a pathway to better quality outcomes. We ask whether training delivers greater life satisfaction gains, and for whom? In the discussion, we set out the broad UK skills policy and business model context in relation to the debates on job quality, and explain our measures of training and life satisfaction and the rationale for the focus on six specific groups in the United Kingdom.
UK skills policy and business models in the context of quality work
For over four decades the critique of labour market training in the United Kingdom has wrestled with the structural weaknesses that perpetuate low-wage, low-skill work driven by managerial control over the training market and weak state intervention. The voluntarist model of the 1980s, whereby employers were encouraged to invest in training, began to shift with the ‘New Labour’ government in 1997 toward a more nuanced form of state intervention that attempted to increase control over the supply side of training in terms of design, curriculum content and delivery (Durrant, 2016; Keep et al., 2006). The educational and skills systems have been used to drive up not only the quantity and quality of skills and qualifications in the United Kingdom, but people’s expectations of better work and opportunities. Despite these supply-led efforts, participation in learning beyond compulsory education remains low in the United Kingdom, with around 40 per cent of adults not participating in any form of learning after leaving school (NIACE, 2015). Critics argue that a focus on supply mechanisms that rely on individuals investing in their own skills is not sufficient to generate employer demand for higher skills or quality job creation (Keep and James, 2012). Demand-side state levers are needed in tandem with supply-led levers to create an equilibrium shift.
Business models in the United Kingdom have arguably exploited this weaker institutional context. The United Kingdom’s low-skill equilibrium over the past 40 years is characterised by employer business strategies within the framework of which profits surge on the basis of low skills and low cost products (Keep et al., 2006). Widening evidence of health and economic inequalities across the nations of the United Kingdom serve to reinforce the failings of this education and skills policy to deliver better quality work opportunities (Abdallah et al., 2017; Warhurst, 2017). With the marketisation of higher education in the United Kingdom, graduates who have invested in their skills find that there are few graduate jobs, leading them to take up lower-skilled work and under-utilisation of skills by employers (Tholen et al., 2016). Research demonstrates that young people moving into poor quality jobs experience lower life satisfaction and well-being than those in unemployment (What Works Wellbeing, 2017). Thus a poor quality job is worse than no job for young people.
In sum, the UK context is arguably institutionally barren in terms of the hard levers it might use to foster better quality work and constrain poor quality work. However, training is a key lever that can be mobilised.
Training and life satisfaction
We adopt life satisfaction as an outcome measure of the effectiveness of training experiences. Life satisfaction captures an overall evaluation of one’s life and is recognised as an important feature of well-being and a legitimate policy objective (Layard, 2005; Stiglitz et al., 2009). It is highly correlated with well-being indicators from the psychological literature (Diener, 1984), namely affective (emotion) and eudemonic (meaningfulness) well-being. Well-being indicators can include ‘feelings of autonomy, mastery, personal growth, learning new things, positive relations with others, sense of accomplishment, sense of meaning, purpose in life and self-acceptance’ (Daniels et al., 2022: 3; Ryff and Keyes, 1995). These are outcomes that training is often designed to generate. The validity of single-item life satisfaction measures like the one used here have been tested against the more established and robust five-item Satisfaction with Life Scale (SWLS) developed by Diener et al. (1985) and show a high degree of criterion validity with it (Cheung and Lucas, 2014). Life satisfaction has been adopted in policy research across the globe as an alternative to Gross Domestic Product (GDP) as a measure of how well a society is doing (Layard, 2005; UNESCO, 2016). Life satisfaction is a useful outcome indicator for examining the value of training in the context of the better work debate because it signals the role of training in how individuals perceive their life chances.
In our analysis we include both work and non-work training, and consider the duration of this training as a proxy for training quality (Dolan et al., 2012; Webster, 2021; Woodall et al., 2016). Training is identified as a key attribute of a good job (Kalleberg, 2021). Effective training supports individuals and organisations in responding to dynamic technological and sectoral shifts. It creates the knowledge, skills and attitudinal capabilities that not only enhance individual economic returns but generate prosocial benefits (Aguinis and Kraiger, 2009; Ilies et al., 2015; Knight et al., 2017; Watson et al., 2018). However, much of the policy research on training effectiveness in the United Kingdom has focused on work-based training because of the primary role of employers in the skills system, as described above. Furthermore, much of the policy work focuses on participation in training only and does not capture the quality of the training. We know from individual intervention studies that short training spells can be less effective, and this can be particularly problematic for short online provision (Watson et al., 2018). Furthermore, job-related training opportunities tend to be more difficult to access by groups who are not in employment. This is important for the negative impact of unemployment on individual well-being, social isolation and loss of self-esteem, alongside the wider social costs to societies in terms of health, welfare and poverty (Gedikli et al., 2023; Jahoda, 1981). Thus, consideration of other forms of training that may include these groups warrants further investigation. For example, there is a growing body of research that has identified the value of volunteering and hobbies or leisure activities in providing informal and formal training opportunities (Bennett and Iwnicki, 2022; Ronkainen et al., 2022). The personal development opportunities that hobbies and leisure-related training provide individuals have been found to boost confidence, decrease social isolation, and open up new economic and social opportunities that enrich the quality of life (Inspiring Change Manchester, 2022). This research raises important questions about the value of non-work training as a pathway to better life outcomes for those unable to access workplace opportunities.
Moderators
The evaluation of training outcomes in the UK policy arena has yielded mixed and at times contradictory findings due to the use of different training measures, and outcomes across studies, and a focus on different groups or socio-demographic features across studies. This makes it difficult to ascertain whether training is a universal policy lever, or whether it may operate differently for different groups of individuals. We consider the following groups.
Employment status is a critical access route to training in the United Kingdom. We know little about the training opportunities accessed by those not in employment, or whether the quality measured through intensity makes a difference in terms of the satisfaction gained (Dolan et al., 2012).
Gender differences in training participation and access are seen to be a core driver of economic and career disadvantage (Dieckhoff and Steiber, 2011). Male participation in work-related training tends to outstrip that of women with the disadvantage for women increasing when the training is employer-provided. O’Halloran (2008) suggests that if analysis went beyond mere participation in training and considered training duration it would be likely to show even greater disadvantage for women. Longer, more intensive training requires a greater time and financial investment in return for career and financial advances. The wage gap between men and women begins to appear around age 30 even after part-time work is accounted for (Global Institute for Women’s Leadership, 2019). Any gender gap is worrying in terms of eroding labour market inequalities.
Prior qualifications are an important correlate of training participation. Those with qualifications are more likely to engage in further training (Social Mobility Commission, 2017). However, the reasoning is complex, and it may be that people’s poor prior experiences of the education system lead to a reluctance to engage in the future, or there may be dispositional differences that explain the different participation rates (Institute for Lifelong Learning, 2009).
Life-course research demonstrates that our health, financial and psychological resources and needs change over time and are a key explanatory factor in the decline of life satisfaction with age (Layard, 2005). Training can thus satisfy – or not – different motivational drives for economic, social or health reasons associated with age. This means that the life satisfaction returns from training could be highly variegated, depending on age and the type of training undertaken (Bunea, 2020; Toepeol, 2013).
Ethnicity and training show a variegated picture in the United Kingdom. Analysis of minority groups reveals an Indian group with strong educational attainment, employment and pay outcomes, which contrasts starkly with a more disadvantaged Pakistani group (Heath and Cheung, 2007; Longhi et al., 2013). The lowest educational achievement at age 16 is shown to be for those of White British and Black & White Caribbean heritage from low socio-economic backgrounds (Strand, 2021). However, educational attainment shows an overall minority advantage at age 16 that does not necessarily translate into an advantage in the labour market (Longhi et al., 2013).
Neighbourhood deprivation is a new and relatively untested area of study in the United Kingdom due to the lack of availability of data (Knies et al., 2016). However, it is relevant here as the level of deprivation is likely to be related to differing social and community resources available to those living in the area. Limited financial resources, housing instability, increased family stress from living in areas with lower public services and higher crime characterise deprived areas (Bradley and Corwyn, 2002; Reiss, 2013). This can affect people’s material and psychological resources, which could mean that training is a key support mechanism or even inaccessible. More deprived areas also tend to have more minorities and people not in employment. It is thus important to disentangle deprivation from these other features (Knies et al., 2016).
Data and analysis
Data
We use data from Understanding Society, a longitudinal household survey that started in 2009 with a sample of around 30,000 households (University of Essex, 2015). This comprised a nationally representative sample of 26,000 households plus an ethnic minority boost sample of around 4000 households. 1 Every year, adult members of the household, that is, those 16 years of age or above, are eligible for interviews, at which they are asked about different aspects of their lives. This includes questions about their family background, socio-economic characteristics, labour market activity, education, fertility, partnership, health and well-being, and attitudes and values. Most of these questions are asked by the interviewer, but some questions considered to be sensitive are asked in a self-completion questionnaire. From Wave 2 onwards, interviewees were asked about their experience of training in the past year. So, the data we used in this analysis are restricted to information collected in Waves 2 to 10, that is, during 2010–2020 (March).
Dependent variable
We used life satisfaction as the measure of individual well-being. This was measured on a seven-point scale ranging from 1 (completely dissatisfied) to 7 (completely satisfied). Life satisfaction is measured in the self-completion questionnaire.
Life satisfaction is one of the three definitions of well-being or happiness considered by researchers across different disciplines (Diener, 1984): ‘social scientists have focused on the question of what leads people to evaluate their lives in positive terms. This definition of subjective well-being has come to be labelled life satisfaction and relies on the standards of the respondent to determine what is the good life.’ It is a cognitive measure of well-being, as opposed to an affective or experienced measure. The validity of single-item life satisfaction measures such as the one used here has been tested against the more established and robust five-item Satisfaction with Life Scale (SWLS) developed by Diener et al. (1985) and showed a high degree of criterion validity with it (Cheung and Lucas, 2014).
Explanatory variable
Training was measured by combining the responses from two survey questions. One measures the type of training and the second, training intensity in terms of hours. To understand the type of training, respondents were asked about their training experiences in the past year. If they said they had received training, they were then asked to identify the purpose of up to three main training spells. The types of training were grouped into three areas for this analysis: (i) job-related (‘to help you get started in your job’, ‘to improve your skills in your current job’, ‘to maintain professional status and/or meet occupational standards’, ‘to prepare you for a job you might do in the future’, ‘to help you get a promotion’); (ii) hobbies and leisure-related training; and (iii) health and safety-related training. We note that 84 per cent of those reporting health and safety training also reported job-related training and it may be that health and safety training formed part of their job-related training.
The literature suggests that there are qualitative differences between low and high intensity training. To measure training intensity, we used the data on the duration of each training spell in days and hours. We converted these into total hours for each type of training received and categorised total hours into ‘low intensity training’ if less than or equal to the median and ‘high intensity training’ if more than the median, where the median is the total hours of training, such that 50 per cent of the sample received total hours of training that was less than this and 50 per cent higher. The median is 24 hours for job-related training, 30 hours for hobbies and leisure training, and 14 hours for health and safety training. We chose the median as a cut-off as that provides a relative measure of intensity for each type of training, with high intensity training above it and lower intensity below it.
Moderators
Drawing on the literature already discussed we focused on the following six social and demographic attributes of learners that are identified as favouring or not the acquisition of good quality jobs as well as factors hindering access to training opportunities, thus potentially reducing the impact of training on life satisfaction.
Employment status, whether someone is in paid employment, unemployed, retired, taking care of family, long-term ill or disabled, or other.
Gender, based on self-reporting as men or women.
Age group, 16–24 years of age, 25–49, 50–64, 65 years of age or above.
Educational qualifications, such as a degree, other higher, A-level or equivalent, GCSE or equivalent, other lower qualification, no qualification. 2
Ethnicity and migration status, we refer to those who self-reported their ethnic group as White British/ English/ Scottish/ Welsh/ Northern Irish/Irish as ‘white majority’ (often referred to as ‘White British’) and everyone else as ‘ethnic minority’. We combined this information with country of birth information to create a three-category variable to control for ethnicity and generation/migrant status: White majority, ethnic minority born in the United Kingdom (second generation or higher) and ethnic minority not born in the United Kingdom (first generation or migrants).
Area-level deprivation, measured by the 2010 English Index of Multiple Deprivation (IMD, 2010) at the level of Lower Super Output Area (LSOA, areas with approximately 1500 individuals). A composite measure of deprivation is calculated using 38 measures of deprivation across seven domains (income, employment, education, health, crime, barriers to housing and services, living environment), and this measure is then used to rank the LSOAs within England and the ranking forms the Index of Multiple Deprivation (IMD). These IMDs are available separately for each UK country and as the IMD can be used to compare area-level deprivation only within each UK country, we have focused on the English IMD as England has the largest population and 95 per cent of ethnic minorities live there. We converted the IMD into a quartile, so that 25 per cent of our sample lived in areas with the lowest deprivation and so on.
Controls
In all models we control for the following because of their association with life satisfaction (Dolan et al., 2008; Knies et al., 2016; Layard, 2005): region of residence (London, North, Midlands, East and South, Wales, Scotland and Northern Ireland); marital status (single never married, cohabiting as a couple, married or in civil partnership, separated/divorced and widowed), number of own children in the household (none, one, two, three, four or above), whether living in an urban area, health (very/extremely, good/fair, poor) and log of equivalised gross household monthly income.
Sample selection
We restricted the sample to those who are not full-time students and gave a full interview. 3 This resulted in a sample of 57,941 individuals. As we examined the responses of sample members over nine years many of these individuals were interviewed multiple times and so this resulted in 292,517 person-year observations.
As already explained, in the analysis in which we compared the relationship between training and life satisfaction by area-level deprivation, we restricted the sample further to those living in England only. The sample size for this analysis was 45,136 individuals and 227,203 person-year observations.
Analysis
We are interested in estimating the causal effect of changes in the intensity of different types of training on life satisfaction. We could estimate this using OLS by regressing life satisfaction on training intensity. If there are individual factors that are associated with a person’s life satisfaction and their propensity to obtain training, however, then any estimated association between training and life satisfaction could in fact reflect the association between this other factor and life satisfaction. If these other factors are observed (measured) then we can control for them in the OLS regression. But if these are not observed – that is, not measured in the survey we have used in this analysis, Understanding Society – we will not be able to say whether the estimated association is the causal effect between training and well-being or some other factor. Some of these unobserved factors may include cultural or social drivers, as well as individual factors such as levels of motivation, personality traits and preferences. For example, let’s suppose that those who have higher levels of motivation put in a higher level of effort to obtain training. Let’s also assume that because of their high motivation they also have a more positive view of life and hence higher levels of life satisfaction. If we find that those who acquire training have higher levels of life satisfaction how can we be sure that the life satisfaction increase is due to getting training, or if this difference in life satisfaction is instead attributable to different levels of motivation. While there are psychological measures that could capture some of these individual-level factors, we are limited by the information collected in the survey we have used here.
As the data we use are longitudinal – that is, the same set of people are interviewed repeatedly and asked the same questions about training and life satisfaction – they allow us to use a fixed-effects (FE) method to identify the causal effects. 4 If we assume that these unobserved factors, such as motivation, do not change over time, instead of comparing those who get training with those who do not, we can compare the same individuals before and after training. Thus, we can ignore any differences across individuals resulting from levels of motivation.
We acknowledge that this method has limitations in identifying causal impacts if the unobserved factors are time-varying, if the correlation reflects measurement error or if there is reverse causality. As the training took place in the year before the time of the interview when life satisfaction was measured, the role of reverse causality is limited. And whilst the fixed-effects method is limited, it is better at capturing the causal impact relative to the existing research based on OLS analysis.
We estimated a series of life satisfaction models using the fixed-effects method to identify the effects of different types and intensity of training on life satisfaction. 5 We estimated this effect for different groups, characterised by employment status, gender, age, educational qualifications, ethnicity and migration status, and level of deprivation of the area they live in by interacting the training intensity variable with the group indicator (full specification details are provided in a data appendix available at the authors’ institutional research repository). 6
Results
In the first part of the results section, we examine the profile of life satisfaction for the UK sample and how this varies across the moderators we use in our analysis. We also outline the descriptive features of the training variable in relation to the types and intensity of training experience by our UK sample. In the second part, we present the results of the fixed-effects models and show the effects of training on life satisfaction and how this relationship significantly changes, or not, depending on an individual’s socio-demographic characteristics.
Table 1 shows the average life satisfaction score for each group, and these are in line with our expectations from the literature, with (statistically) significant variation across groups, except for gender. Life satisfaction is highest for those who are retired or in employment and lowest for those who are unemployed and long-term sick or disabled. Life satisfaction is lower for 25 to 64 year olds, but higher for younger (16 to 24 year olds) and older (65+ years) adults. Those with higher qualifications tend to report greater life satisfaction than those with lower (intermediate and vocational qualifications) or no qualifications. People from ethnic minority backgrounds born in the United Kingdom have lower life satisfaction than the White majority group and those from ethnic minority groups born outside the United Kingdom. Finally, for residents of England, the average level of life satisfaction decreases with increasing levels of area deprivation.
Average life satisfaction reported by different sub-groups.
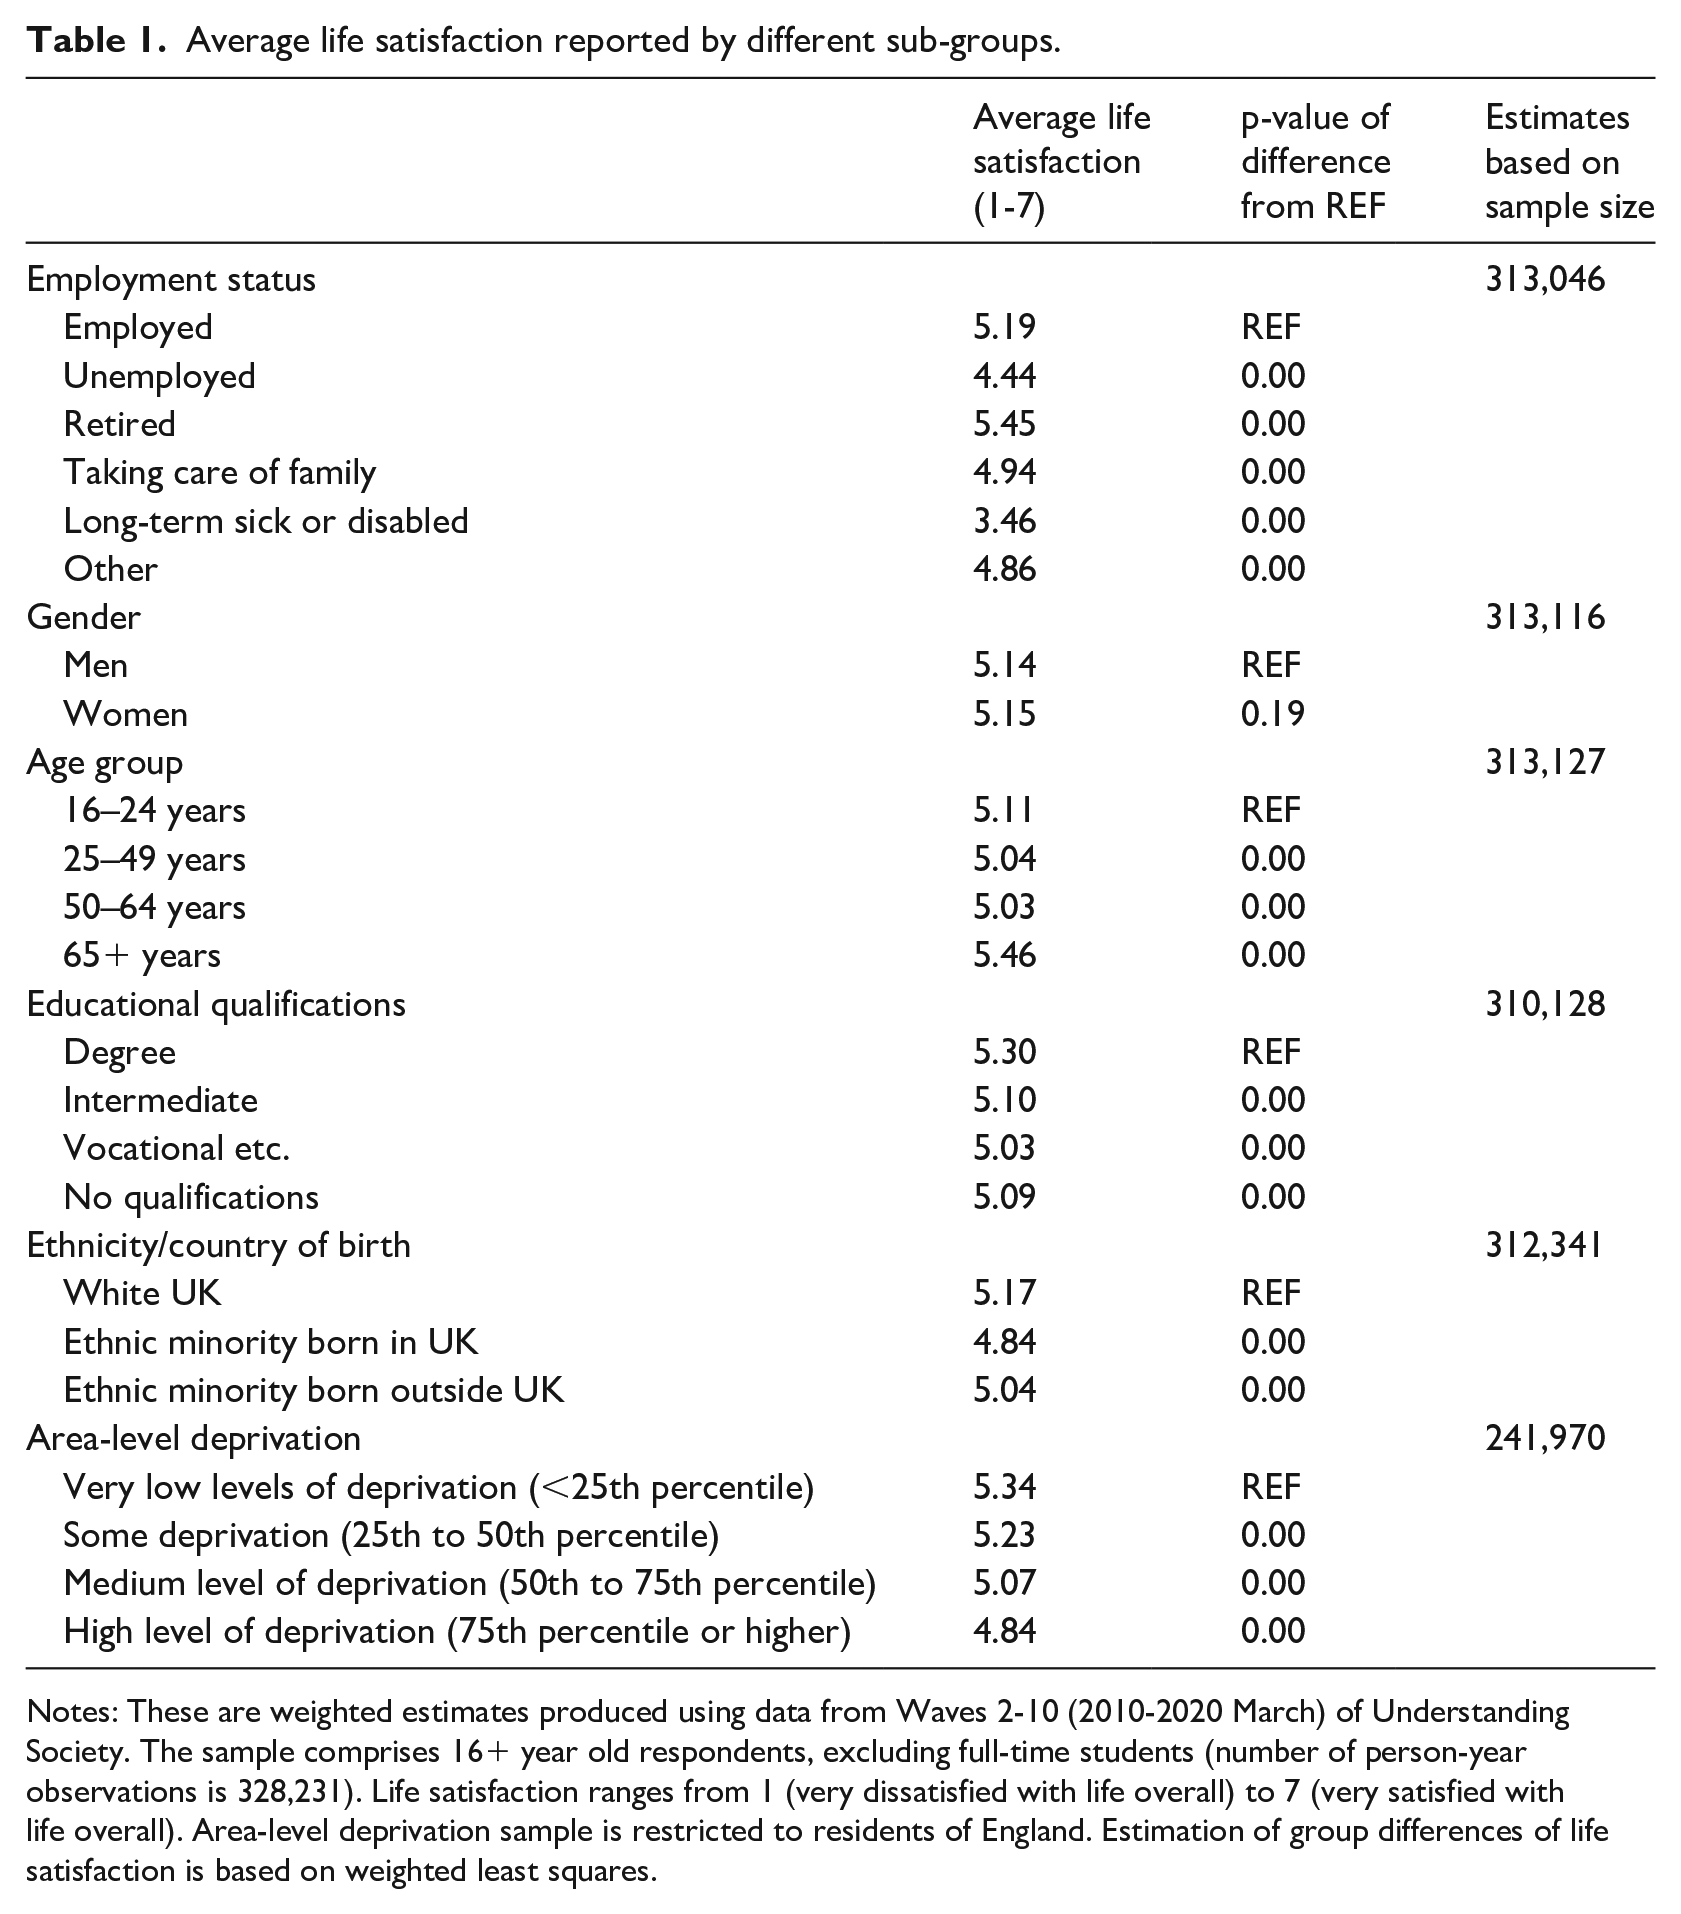
Notes: These are weighted estimates produced using data from Waves 2-10 (2010-2020 March) of Understanding Society. The sample comprises 16+ year old respondents, excluding full-time students (number of person-year observations is 328,231). Life satisfaction ranges from 1 (very dissatisfied with life overall) to 7 (very satisfied with life overall). Area-level deprivation sample is restricted to residents of England. Estimation of group differences of life satisfaction is based on weighted least squares.
Figure 1, showing the different types of training and their intensity, shows that those in employment have had far more experience of job-related training, and health and safety training, which is probably largely linked to work activity. Those not in employment are likely to obtain training through hobbies and leisure activities. We have used weighted data to extrapolate to the UK population. Training participation is highest among the employed, at 29 per cent, which contrasts with 4 per cent among those not employed. Employers are the primary source of job-related and health and safety training, at 76 and 87 per cent, respectively. They also provide 18.3 per cent of hobby and leisure training. In contrast, 74 per cent of hobby and leisure training is not provided by employers or government training schemes or as part of college or university courses, but some other sources. We speculate that these other sources are likely to include public leisure centres and private enterprises and therefore are probably paid for by the person concerned. These descriptive results for the United Kingdom begin to unpack the dominance of employer-led training and problems those not in employment are likely to experience in accessing training as a route to better jobs.
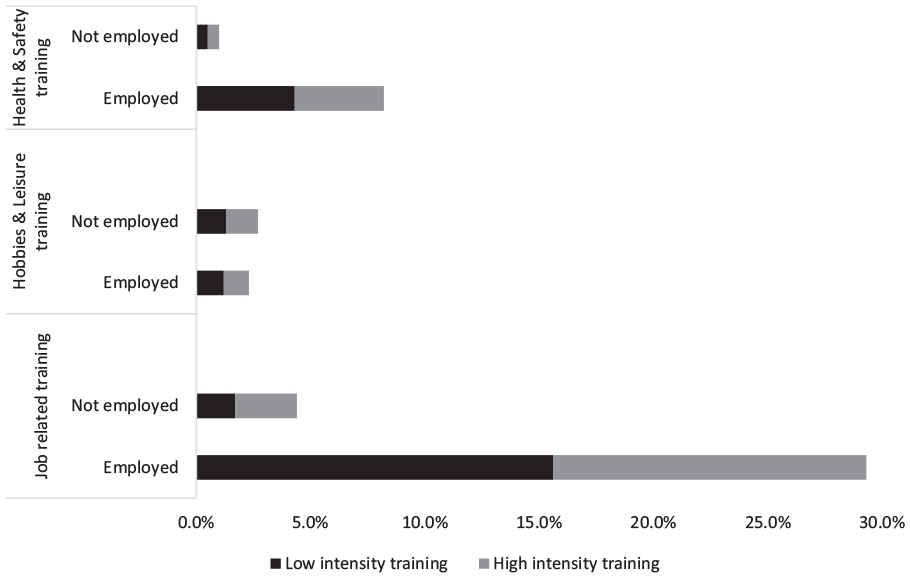
Proportion taking up different types of training by employment status.
Turning to our fixed-effects analysis, Table 2 provides a summary of the significant results from the six models. Specifically, Table 2 shows the average marginal effects (AME) of training on life satisfaction and their (statistical) significance levels. In other words, the average marginal effects show the change in life satisfaction for each group upon taking up training of different types and intensity. To aid the translation or meaningfulness of the results we also convert the average marginal effects of training on life satisfaction into a percentage, reflecting the change in life satisfaction upon receiving training for the ‘average’ person in each group. This percentage is calculated by dividing the average marginal effects of training on life satisfaction for a specific group by the average satisfaction score for that group.
Changes (increase and decrease) to life satisfaction upon taking up different types of training by group, as a percentage of group-level average values: only estimates that are statistically significant at at least a 10% level of significance are shown here.
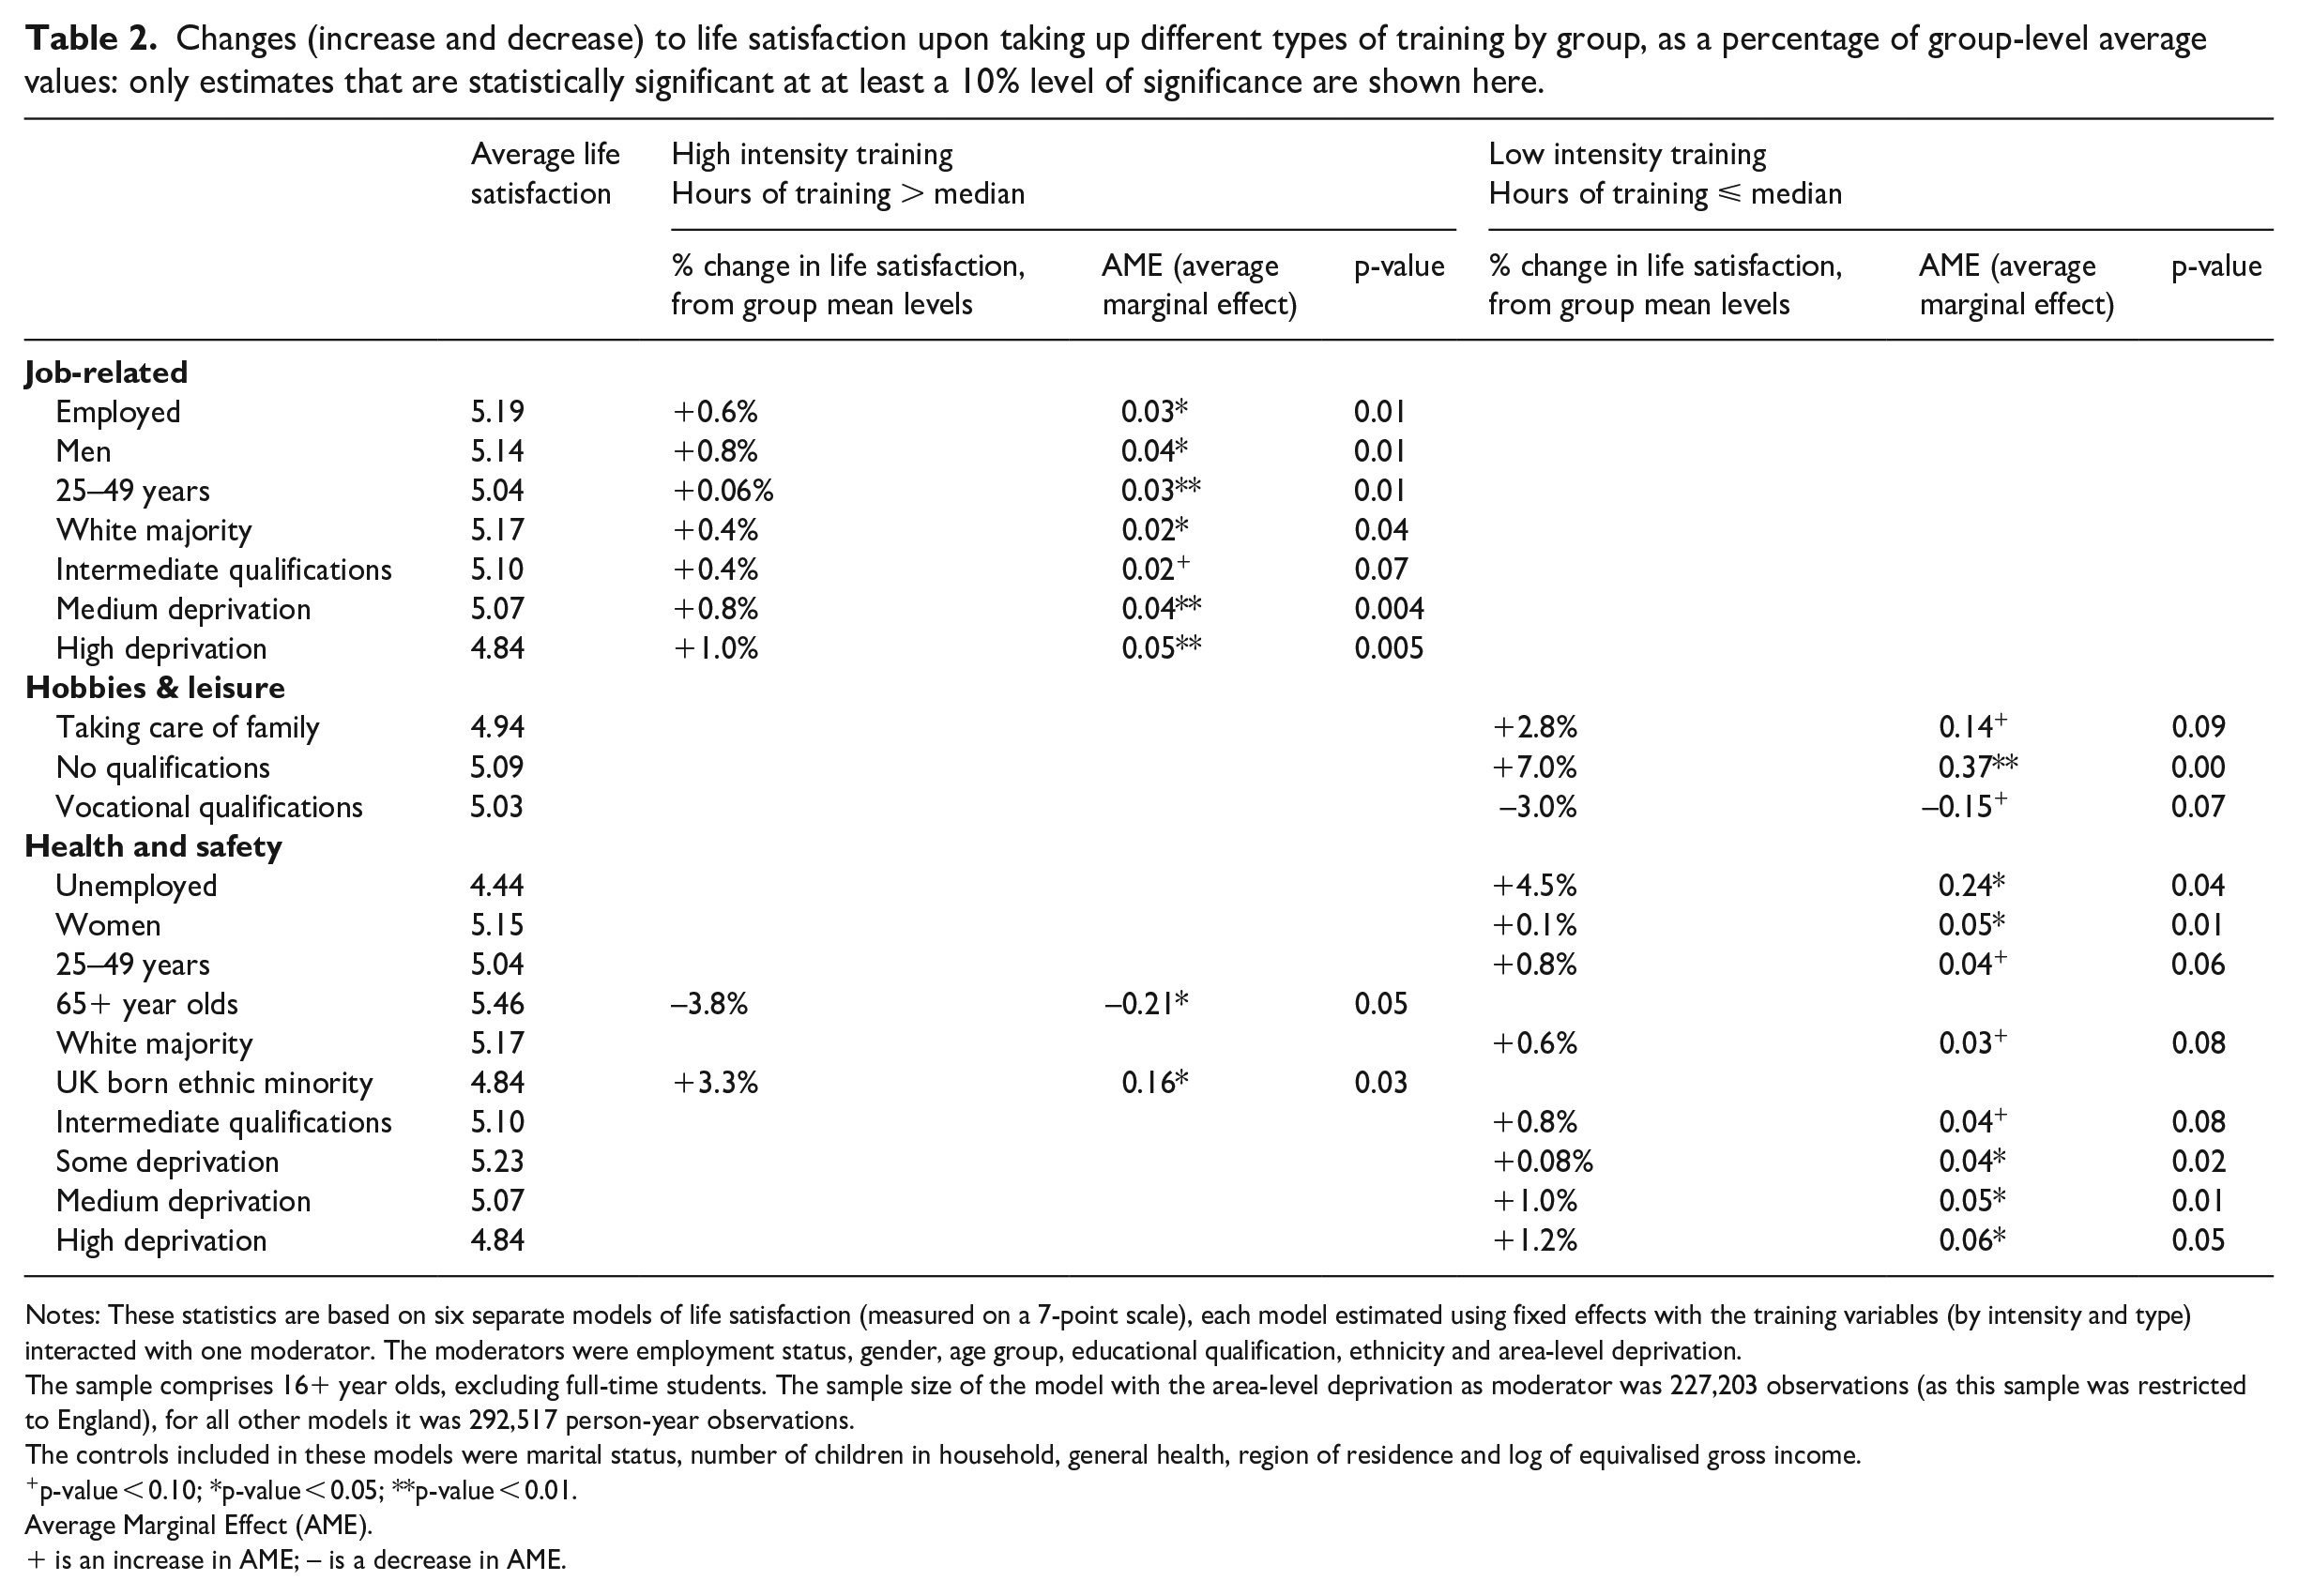
Notes: These statistics are based on six separate models of life satisfaction (measured on a 7-point scale), each model estimated using fixed effects with the training variables (by intensity and type) interacted with one moderator. The moderators were employment status, gender, age group, educational qualification, ethnicity and area-level deprivation.
The sample comprises 16+ year olds, excluding full-time students. The sample size of the model with the area-level deprivation as moderator was 227,203 observations (as this sample was restricted to England), for all other models it was 292,517 person-year observations.
The controls included in these models were marital status, number of children in household, general health, region of residence and log of equivalised gross income.
p-value < 0.10; *p-value < 0.05; **p-value < 0.01.
Average Marginal Effect (AME).
+ is an increase in AME; – is a decrease in AME.
We reported only the average marginal effects of training on life satisfaction for groups (from the six models) that reach at least a 10 per cent significance level. Because of length restrictions, we have not reported the average marginal effects for all groups. These are freely accessible from the authors’ institutional research repository as a Data Appendix. 7 The Data Appendix also includes the estimated coefficients of all variables from the base model of life satisfaction (that is, without the moderator interactions) estimated using fixed effects, which shows that most of the coefficients of the control variables are statistically significant and in the expected directions.
All estimates from all six models are available from the authors upon request.
Job-related training
With regard to job-related training its intensity – specifically high intensity training – is a significant factor in delivering a positive return to life satisfaction across groups. Men and those in employment gain the greatest life satisfaction returns from participation in high intensity training, with a 0.8 and a 0.6 per cent rise in life satisfaction, respectively. This means that high job-related training is expected to push life satisfaction upward for the average employed person from 5.19 to 5.22, and from 5.14 to 5.18 for the average man.
For the average 25–49 year old, high intensity job-related training significantly boosts life satisfaction, from 5.04 to 5.07. Given that our life satisfaction declines as we grow older, job-related training appears to provide a rewarding boost. No significant change in life satisfaction was noted from job-related training for younger workers or 50 plus workers. This may indicate that job-related training is linked to career progression for these age groups specifically.
We find that high intensity job-related training has a positive effect of 0.02 average marginal effects on life satisfaction only for the White majority group, which translates into an increase of 0.4 per cent on the average.
For job-related training, those with intermediate qualifications experience an increase in life satisfaction from high intensity job-related training (AME 0.02), which equates to an increase of around 0.4 per cent in life satisfaction for those with average life satisfaction in that group.
High intensity job-related training has an important impact on the life satisfaction of people living in areas of medium (AME 0.04) and high (AME 0.05) levels of deprivation in England. Both these groups have significantly lower levels of life satisfaction than those living in more affluent areas. As a result, high intensity job-related training appears to boost life satisfaction by 0.8 per cent and by 1 per cent for medium and high areas of deprivation, respectively. This means that the life satisfaction score would rise from 5.07 to 5.11 for those living in medium deprived areas. And for those living in the most deprived areas, life satisfaction would rise from 4.84 to 4.89.
No statistically significant boost to life satisfaction was noted for any group from low intensity job-related training.
Hobbies and leisure training
The pattern of influence of training on life satisfaction is quite different for hobbies and leisure training. Here we see that a boost to life satisfaction comes from low intensity participation. Hobbies and leisure training significantly impacts life satisfaction only for those taking care of family and those with no qualifications. However, the size of the effect is notable. For both these groups hobbies and leisure training give a considerable boost to life satisfaction.
Specifically, for those taking care of family, participation in low intensity leisure and hobbies training boosts life satisfaction by 2.8 per cent, increasing from 4.94 to 5.08. This may reflect an increase derived from the social dimension of this type of training and provide the emotional resources from social contact and self-esteem that can be depleted through isolation.
For those with no qualifications life satisfaction rises by 7 per cent from 5.09 to 5.46. It may be that that low intensity hobbies and leisure training provide a sense of purpose, meaningfulness or value that is not generated through a work environment. We can only speculate, but those with no qualifications may find themselves in lower quality jobs where their potential is undervalued.
One result was unexpected: for those with vocational qualifications a 3 per cent decline in life satisfaction is associated with engagement in hobbies and leisure training.
Health and safety training
Most of the increases in life satisfaction from health and safety training are derived from short intensity training, which, as already discussed, is likely to reflect the fact that this sort of training is connected to work and may be related to starting new work opportunities.
For 25–49 year olds, life satisfaction increases from low intensity health and safety training. This reinforces the argument that for this group health and safety training is probably linked to work and career progression activities. There is a similar pattern of linkage between life satisfaction gains for White majority workers, for those with intermediate qualifications and for those living in more deprived areas, namely that they experience a life satisfaction boost from both high intensity job-related training and low intensity health and safety training. These findings may indicate that the two types of training are connected for these groups. In contrast, women and the unemployed gain a life satisfaction boost from low intensity health and safety training in the absence of any boost from job-related training. This may suggest that for women and the unemployed health and safety training reflects the beginning of new or transitional work opportunities. Examples include part-time work, flexible work, or unpaid and voluntary work, in which in the United Kingdom induction will include mandatory health and safety training.
For UK born ethnic minorities, however, high intensity health and safety training is linked to a boost in life satisfaction (AME 0.16) of 3.3 per cent. It is not certain what exactly this high intensity health and safety training provides to UK born ethnic minorities. However, the UK NHS (National Health Service) has strong ethnic representation, and these results may reflect health-care training which would necessarily be more intensive. Thus, structural differences in the labour market may be important here. But the differential effects of training types warrant closer scrutiny.
Among 65+ year olds, high intensity health and safety training reduces life satisfaction (AME 0.21), which means a decrease of 0.4 per cent (mean life satisfaction for this age group is 5.46). This result may reflect health issues and therefore explain the reduction in life satisfaction.
Summary
In summary, the results demonstrate that the type and intensity of training matters for particular groups and can be a pathway to increasing life satisfaction. It is evident that the impact of training on life satisfaction is not uniform. Where life satisfaction is already considerably lower for some groups the evidence suggests that training can be a powerful pathway to better life outcomes. For example, the unemployed, those looking after family, ethnic minority groups, mid-career groups, those with lower or no qualifications, and those living in more deprived areas all have lower life satisfaction levels than others in their group. In each of these cases, participation in training boosted their individual life satisfaction. Given that lower life satisfaction is associated with a loss of psychosocial resources, including self-esteem, confidence, self-efficacy, social isolation, increased social anxiety or depression, then the value of training in these instances could be considerable. At the same time, there are many groups for which training has no impact on life satisfaction. One caveat we would add to this conclusion is that our analysis was not intended to examine the long-term effects of training on life satisfaction and as such we cannot conclude on the longevity of the effects of training on life satisfaction.
Discussion
Training has consistently been identified as a core feature of better jobs and work-life outcomes by providing opportunities for people to build up social resources, networks, psychological resources, and embodied knowledge. However, methodological limitations have made it difficult to evaluate the value of training as a policy lever. In this article we have attempted to unpack the groups for whom training delivers positive outcomes. Our use of panel data over a 10-year time frame enhances the robustness of our claims regarding the effects of training. Our findings indicate that job-related training (including health and safety training) offers a significant pathway to improved life satisfaction for groups that are already disadvantaged, namely those living in deprived areas of England, those with low qualification levels and the unemployed. However, men and white majority continue to gain most from job-related training, suggesting there are continuing barriers for women and people from ethnic minority groups. We also gained insight into how the type of training and its quality may reflect occupational stratification of ethnic groups in sectors such as the health service in the United Kingdom (Batnitzky and McDowell, 2011).
We draw three insights from the findings. First, the type of training matters when considering the impact on different groups. Our policy focus on job-related training delivered through a voluntarist system in the United Kingdom has arguably limited our consideration of the needs of those who are not in paid work. Unforthcoming state intervention in the labour market has opened up space in recent years for community groups linked to hobbies and leisure activities to fill the void. Communities of practice around local food initiatives and so-called ‘men’s sheds’, where men work on practical DIY projects, have risen to prominence in Scotland and Northern Ireland. Such groups are often driven primarily by social rather than economic goals. Local food initiatives encapsulate narratives around sustainable food production and food poverty. Men’s sheds grew as a health policy response to poor health outcomes for men compared with women, the recognition of high suicide rates among men, and the isolation many experience as they leave the labour market. These learning communities offer an opportunity to use and pass on skills from expert to novice, to learn new skills, to connect with others or replace social networks lost through retirement. They also shape expectations of quality work and life, and fulfil psychological needs for autonomy, control and purpose (Bharucha et al., 2020; Kelly et al., 2019; McGeechan et al., 2017). Our results point in particular to their value for people looking after family members (for example, children, those with long-term health problems and disabilities) and people with no qualifications. For those looking after family, community learning may be important in combating isolation. For those with no qualifications, the learning that takes place through informal activities may be an important substitute for formal instruction based learning. The drivers are likely to differ and closer scrutiny would allow learning levers to be designed more effectively, with quality work outcomes in mind.
Second, the intensity of training is significant. For work-related training in particular, high intensity training is important to delivering effective outcomes, more so than short spells of training. This finding extends prior systematic review evidence of individual interventions, indicating that short duration training can be less effective, particularly when delivered online (Watson et al., 2018). Learning technologies and experiences of working remotely during the COVID-19 pandemic are likely to have increased the volume of short duration training delivered remotely. More work is needed in this area to unpack why people value high intensity training more. Higher intensity training may be linked to career progression rewards, although the training measured here does not necessarily result in qualifications. Therefore, the reasoning may have more to do with the peer support and informal career networks that have been found embedded in the design of high intensity forms of training (Watson et al., 2018).
Finally, the findings shed light on the value of work and non-work training in the UK context, which many have argued is locked into a low road low skills trajectory, with weak institutional levers making it difficult to forge an alternative pathway. The evidence here does little to challenge that narrative. However, the findings do shed light on some disadvantaged groups for whom training is creating significant positive returns, while perpetuating advantages for the already advantaged. Our work supports calls by Findlay et al. (2017) for a multi-level policy response to better quality work that looks not only at actors within the workplace but those outside it. We would argue that limited progress on overcoming barriers encountered by disadvantaged groups requires a much stronger policy mechanism for their voice, which also illustrates the expressive or deliberative dimension of better work (see Murray et al., 2023). The use of more networked and locally devolved social action collaborations allowing communities and disadvantaged groups to co-create solutions is probably long overdue.
Footnotes
Acknowledgements
Understanding Society is funded by the Economic and Social Research Council and various UK Government Departments, with scientific leadership by the Institute for Social and Economic Research, University of Essex, and survey delivery by NatCen Social Research and Kantar Public.
Funding
This work was supported by the Economic and Social Research Council [grant number ES/N003586/1].
Ethical approval
Data availability statement
1
In the second wave of the survey, a sample of around 8000 households was added. This was the surviving sample of the long-running (1991–2008) British Household Panel Survey.
2
Other lower qualifications include vocational qualifications such as ‘youth training certificate’, ‘key skills’, ‘basic skills’, ‘entry level qualifications (Wales)’, ‘modern apprenticeship/trade apprenticeship’, ‘RSA/orc/clerical & commercial quals (e.g., typing/shorthand/book-keeping)’, ‘city and guilds certificate’, and ‘other vocational, technical, or professional qualification’.
3
We have excluded proxy respondents, that is, cases where someone else gave a shorter interview on behalf of the sample member who could not be interviewed due to various reasons.
4
We adopt the established economic fixed-effects method. The method, description and justification of this method is available in econometrics textbooks, such as Wooldridge (2012, 2010) and ![]() . A statistical appendix offering more explanation is available from the authors.
. A statistical appendix offering more explanation is available from the authors.
5
The data were analysed using Stata version 14.