
Abstract
Background
No comprehensive study has been conducted on the effects of high tibial osteotomy (HTO) on the coronal, sagittal, and axial alignments of the ankle joint. Therefore, this study aimed to investigate the multiplane changes in the ankle joint following HTO using the EOS biplanar X-ray imaging system.
Methods
The medical records of 43 patients who underwent HTO for the treatment of medial knee osteoarthritis were retrospectively reviewed. Preoperative and postoperative EOS images and lower-extremity scanograms were evaluated; the correlations between the outcomes were evaluated.
Results
After HTO, the ankle joint axis point on the weight-bearing line showed significant lateralization (p < .001). The knee lateral ankle surface angle increased significantly in the sagittal alignment (p < .001). The distal tibia showed a significant internal rotation in the axial plane (p = .022). Tibial rotation showed no significant relationship with the other parameters.
Conclusions
HTO induced lateralization of the ankle joint axis (coronal), increased the posterior tibial slope (sagittal), and caused the internal rotation of the distal tibia (axial). Axial changes in the distal tibia showed no significant relationship with other coronal and sagittal parameters of the ankle joint. We suggest that surgeons should consider, during HTO, that the ankle joint axis shifts laterally and distal tibia has tendency to rotate internally after HTO.
Introduction
In medial open-wedge high tibial osteotomy (HTO), weight-bearing loads are transferred from the medial compartments to the lateral compartment of the knee to prevent or slow medial joint destruction progression caused by osteoarthritis (OA). 1 Previously, most studies have investigated and reported changes in the coronal plane of the knee joint after HTO based on lower extremity scanogram measurements.
Recently, several studies have assessed changes in the coronal alignment of the ankle joint after HTO.2-4 However, changes in the sagittal and axial planes of the ankle joint have not been considered despite being clinically important. The EOS biplanar X-ray imaging system simultaneously analyzes two-dimensional (2D) images of the whole body of patients in the weight-bearing position and reconstructs three-dimensional (3D) images of bone structures for evaluating the coronal, sagittal, and axial planes of the lower extremities. 5 Recently, Oh et al. 6 have demonstrated that the ankle joint’s coronal and sagittal alignments were significantly affected by HTO based on scanograms and EOS measurements. Other recent studies have reported that the distal tibia was significantly internally rotated after HTO.7,8
To date, no comprehensive study has been conducted on the ankle joint’s changes in the coronal, sagittal, and axial alignments after HTO. Moreover, the correlations between these multiplane parameters have not been demonstrated. Therefore, this study aimed to investigate the multiplane changes in the ankle joint following HTO using the EOS system. We hypothesized that the internal rotation of the distal tibia would significantly affect the coronal and sagittal alignments of the ankle joint.
Methods
The present study was approved by the Institutional Review Board in a single tertiary hospital. Ninety-five patients who underwent medial open-wedge HTO for varus knee OA correction between January 2016 and September 2021 were eligible to participate in the study. A single surgeon performed all operations; EOS imaging was performed before and after surgery. Patients with a history of lower extremity fractures (n = 10; three, three, and four cases of femoral, tibial, and ankle fractures, respectively) or those who had undergone surgery due to other diseases (n = 9; hip OA, hip dysplasia, ankle OA) were excluded. 12 months were set as the minimum follow-up period to demonstrate radiologic changes using EOS.
9
Furthermore, 18 patients who had insufficient EOS data and 15 with radiologic follow-up of <12 months were excluded. Finally, 43 patients (comprising 46 knees; three underwent HTO on both knees) were enrolled in the study and retrospectively examined (Figure 1). The operative technique for HTO has been previously described.
6
Briefly, after identifying the center of the hip, targeting the lateral intercondylar tubercle of the tibia was performed by the ankle cable method.
10
The correction angle was determined based on the severity of the knee deformity. The correction angle was analyzed as the coronal angle between the two osteotomized lines of the proximal tibia on computed tomography (CT) images.
6
Retrospectively reviewing the patients’ electronic medical records, the demographic, historical, and operative data of the patients were analyzed. Flow diagram of participant eligibility in this study.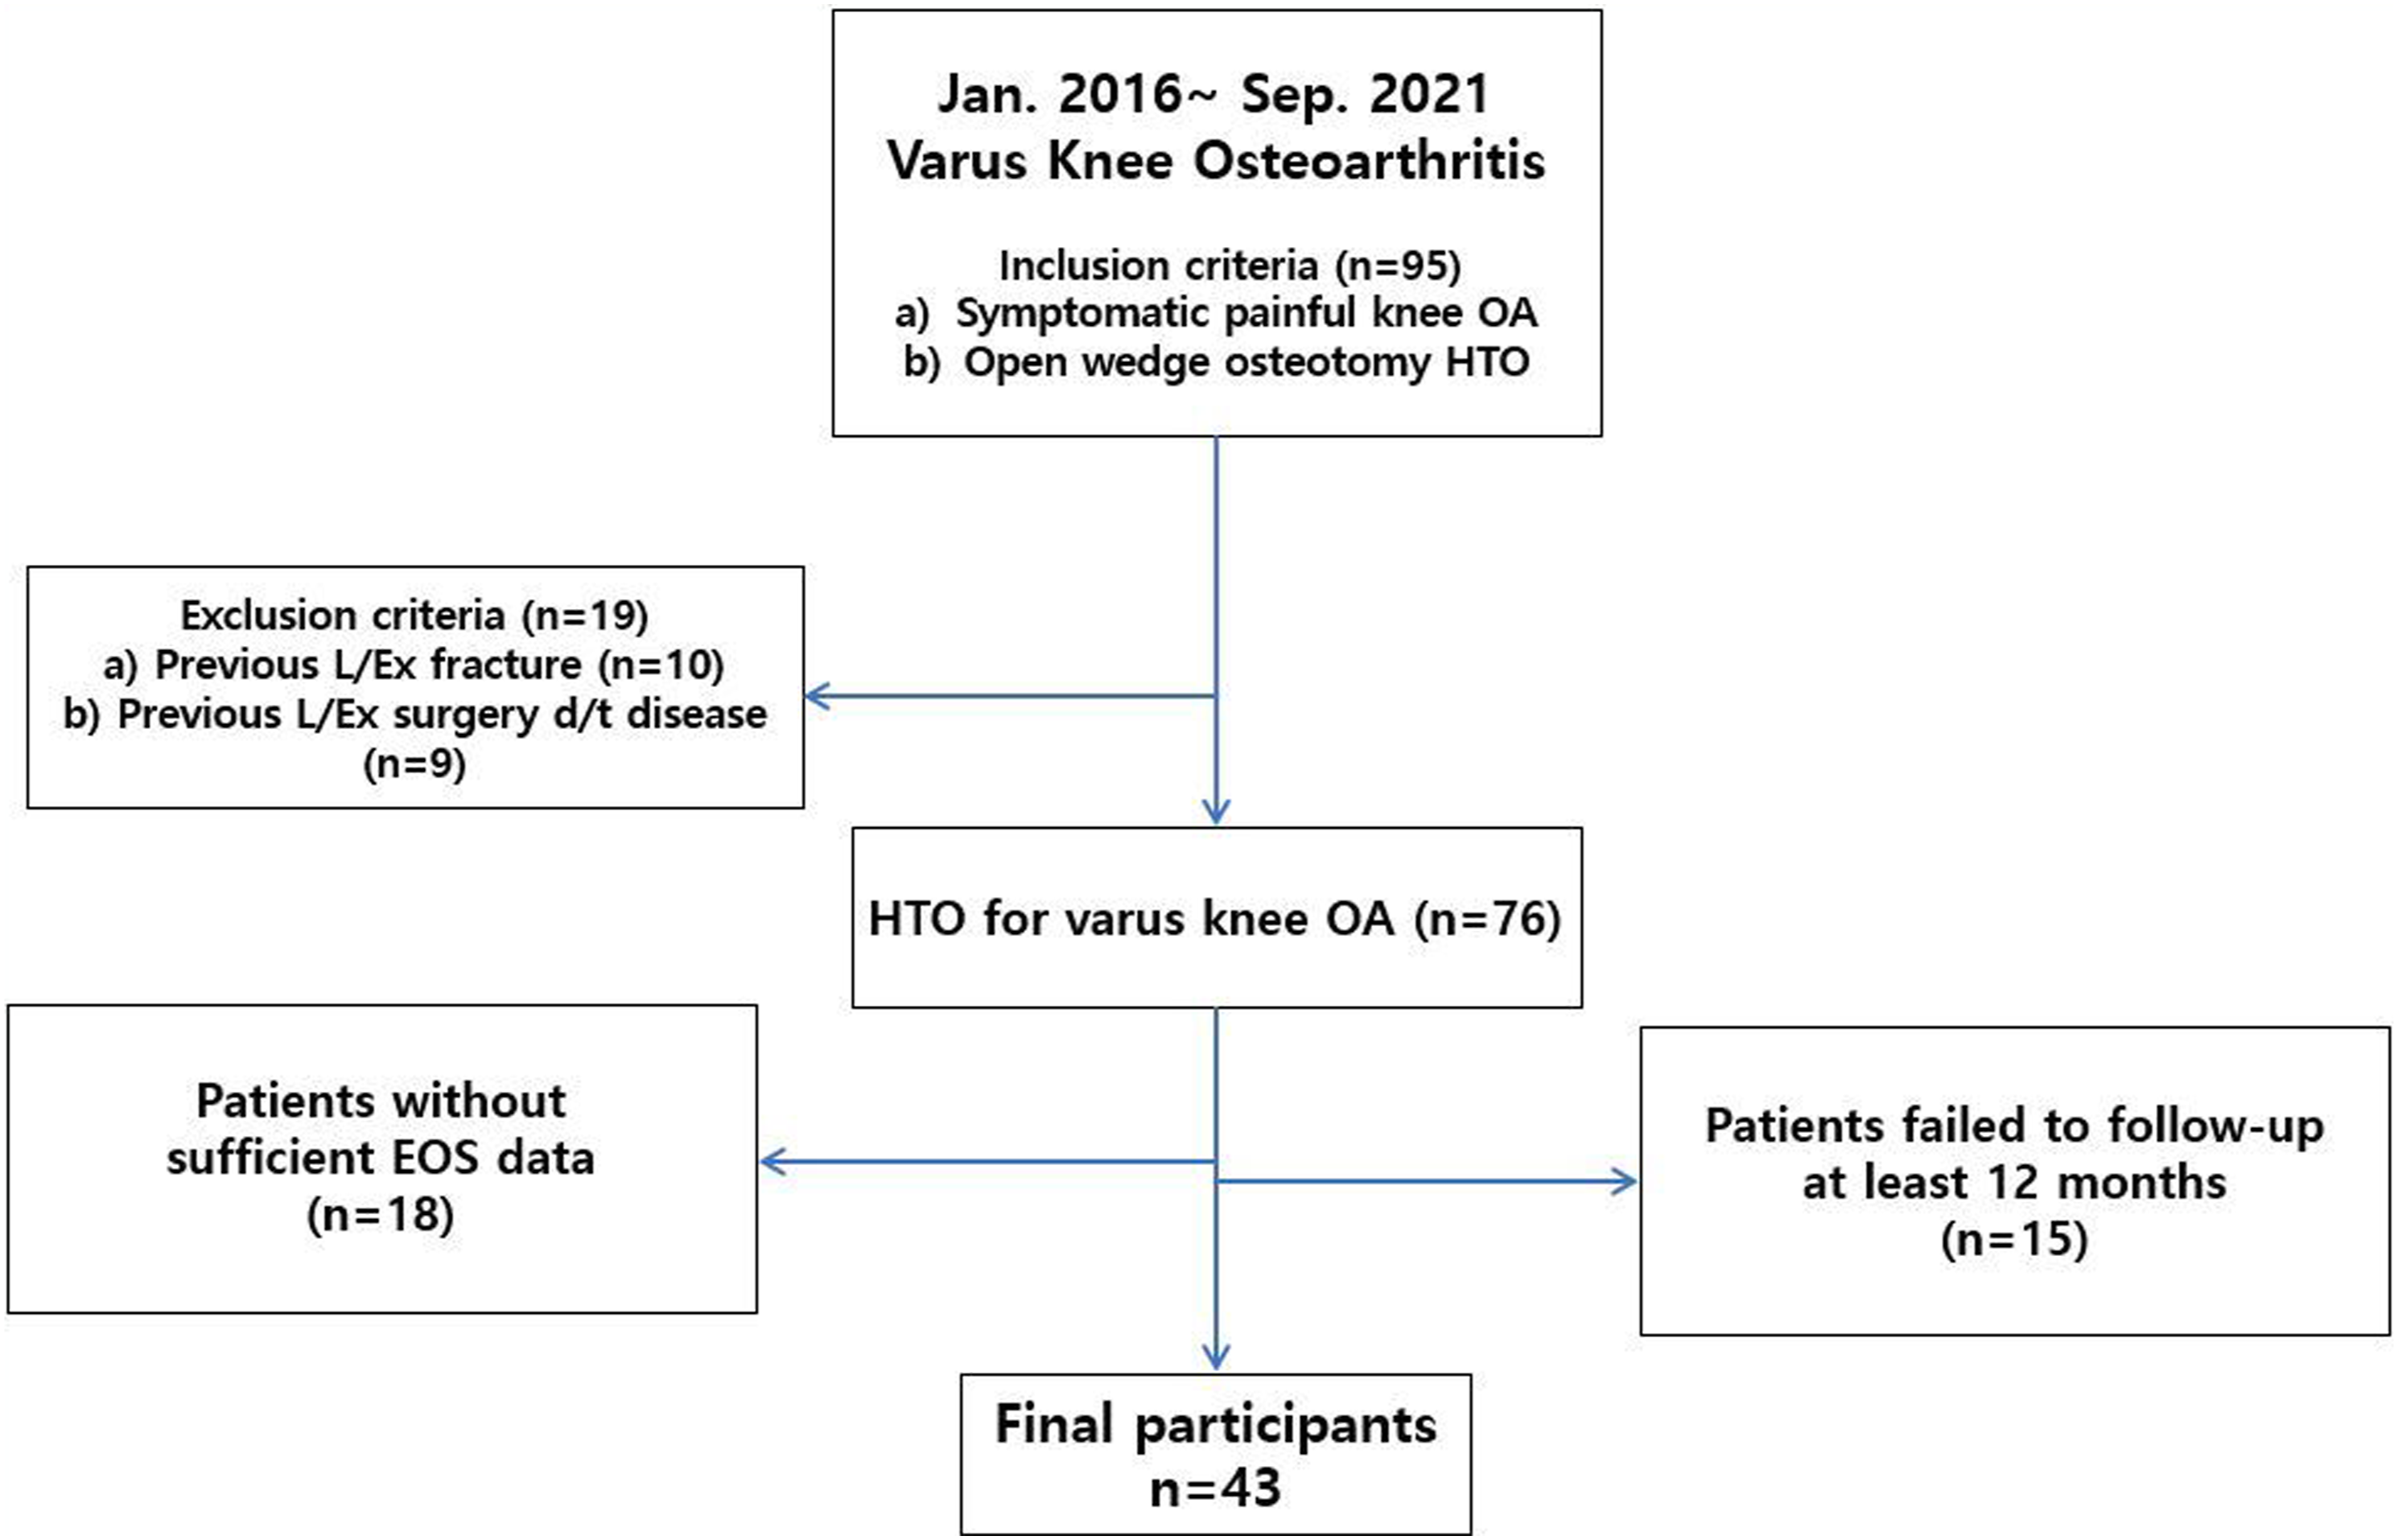
Radiographic evaluation
Preoperative and postoperative radiologic data were measured mainly using the EOS system and partially using the lower extremity scanogram. 6 Postoperative outcomes were obtained at the last follow-up after 1 year. Using indicators by the Picture Archiving Communication System (PACS, Marosis; Seoul, South Korea), all radiologic outcomes were obtained digitally and measured. Evaluation of the radiographic parameters was performed by two researchers who did not participate in the clinical treatment; their assessments were averaged and investigated. Regarding assessment of interobserver reliability, two authors measured all radiographic parameters independently. Considering assessment of intra-observer reliability, the same observers re-evaluated all radiographic parameters 2 months after the initial measurement. Intraclass correlation coefficients (ICC) were used for the outcomes of interobserver and intraobserver reliabilities. All radiographic outcomes revealed excellent intraobserver and interobserver reliabilities (ICC >0.8).
EOS biplanar X-ray imaging system
The EOS system was used to measure the coronal, sagittal, and axial alignments of the knee, ankle joints (Figure 2). In regard to the coronal plane, the limb length, tibial length, hip–knee–ankle (HKA) angle, and medial proximal tibial angle (MPTA) were automatically evaluated using the EOS. With respect to the sagittal plane, the flexion/extension angle of the knee joint was automatically measured using the EOS. Knee lateral ankle surface angle (KLAS) was measured manually as the angle between the one line extending from the anterior to the posterior area in the tibial plateau and the other line between the anterior and posterior margins in the tibial plafond.
6
Moreover, the EOS analysis included parameters on the axial plane. The femorotibial and tibial rotation angles were automatically obtained using the EOS. Briefly, the femorotibial rotation angle was defined as the angle between the line of the femoral posterior condyle and the tibial plateau posterior rim. The tibial rotation was defined as the angle between the line of tibial plateau posterior rim and the line of bimalleolar axis. During the femorotibial or tibial torsion, these values were defined ‘positive’ if the distal fragment exhibited external rotation (Figure 3). Schematic images of lower extremity alignment evaluation by EOS system. (a) Gross image of the participant performing EOS exam. (b) Preoperative and (c) postoperative coronal, sagittal, axial lower extremity parameters measured by EOS. Schematic measurements of axial parameters by EOS system. (a) Preoperative and (b) postoperative axial images of EOS showing femorotibial rotation (white line a and (b) and tibial rotation angle (white line b and c). Femorotibial rotation was the angle between the axis of the posterior condyles of the femur and the posterior tibial plateau rim and tibial rotation was the angle between the axis of the posterior tibial plateau rim and the bimalleolar axis.

Lower extremity scanogram
The radiologic outcomes of the scanogram were measured as previously described.2,3,6 The researchers manually measured knee tibial plafond angle (KTPA) to assess the coronal alignment of the knee.
2
Tibial plafond inclination (TPI)
2
and ankle joint axis point on the weight-bearing line (AAWBL) ratio
3
were analyzed to measure the ankle joint’s coronal alignment. AAWBL was calculated using the line between the femoral head center and lowest point of the calcaneus.
3
The AAWBL ratio was calculated as previously described (Figure 4).
3
(a) Preoperative and (b) postoperative EOS images of a 44-year-old female patient who underwent HTO on her left knee. Yellow dotted line (a) indicates weight bearing axis measured by drawing the line from the center of the femoral head to the lowest point of the calcaneus. After the knee alignment was neutralized by HTO, ankle joint axis point on weightbearing-line (AAWBL) ratio (b/c × 100) increased, flexion/extension angle (d) and (e) of knee joint and knee lateral ankle surface angle (KLAS, f ang (g) increased, and tibial rotation angle (h) and (i) decreased.
Statistical analysis
SPSS version 22 (IBM, USA) was used for statistical analyses. Before the analyses, data normality was tested. We used the paired t test to compare pre- and postoperative radiologic data. To investigate the relationship strength between the variables of interest, Pearson’s correlation coefficient test was performed.
Results
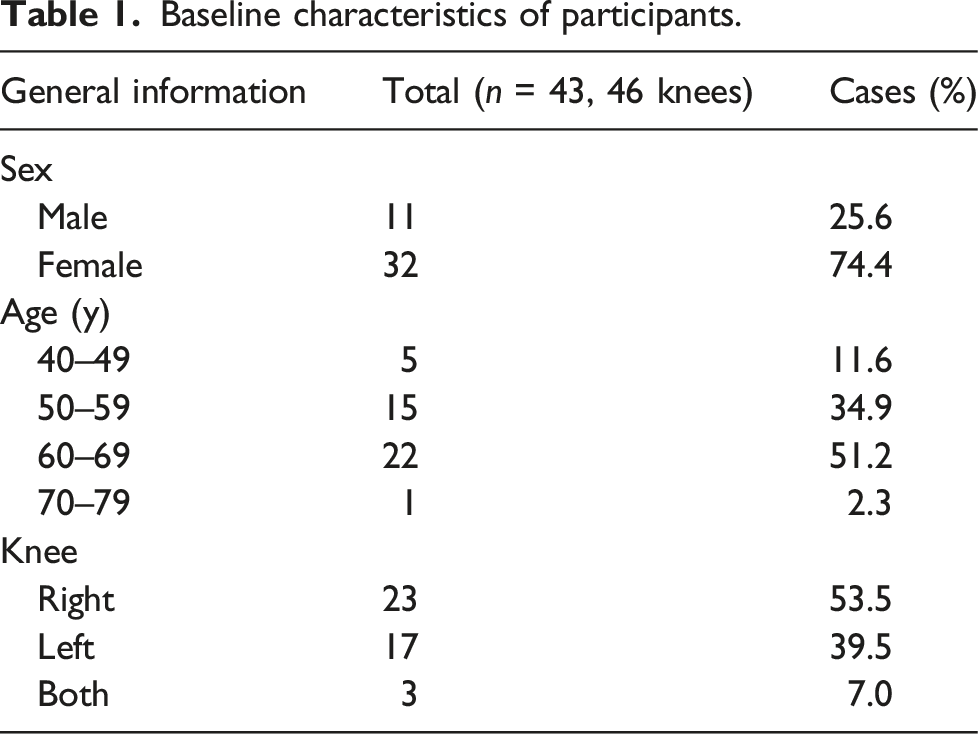
Baseline characteristics of participants.
HTO significantly corrected varus malalignment of the knee joint. The mean tibial correction angle was 8.5°(range: 5–13°). Regarding the coronal alignment of the knee joint, the HKA angle, MPTA, and KTPA were significantly corrected after HTO (all, p < .001). Regarding the ankle joint’s coronal alignment, the TPI significantly decreased (p < .001); the AAWBL ratio showed significant lateralization after HTO (p < .001).
Regarding the ankle joint’s sagittal alignment, the KLAS angle increased significantly (p < .001). The flexion/extension angle of the knee joint significantly increased (p = .013).
Preoperative and postoperative radiologic outcomes.

aThe values are given as the mean, standard deviation and the range.
bΔ, delta (the amount of correction) was calculated as postoperative value minus preoperative value.
cPaired t test. The p values shown are for the comparisons between the preoperative and follow-up investigations.
dThe parameters were investigated by lower extremity scanogram.
eThe parameter was manually evaluated by EOS imaging system. The other parameters were automatically measured by EOS.
HKA, hip knee ankle; MPTA, medial proximal tibial angle; KTPA, knee tibia plafond angle; TPI, tibial plafond inclination; AAWBL, ankle joint axis point on the weightbearing line ratio; KLAS, knee lateral ankle surface angle. Bold indicates p value < 0.05.
Correlation among the variables of interests. a

aThe data are presented as Pearson’s R values.
bΔ, delta (the amount of correction) was calculated as postoperative value minus preoperative value.
*p < .05, **p < .01.
HKA, hip knee ankle; MPTA, medial proximal tibial angle; KTPA, knee tibia plafond angle; TPI, tibial plafond inclination; AAWBL, ankle joint axis point on the weightbearing line ratio; KLAS, knee lateral ankle surface angle.
Discussion
This study demonstrated that HTO significantly affected the coronal, sagittal, and axial alignments of the ankle joint. The most important finding was the axial changes in the distal tibia, which exhibited significant internal rotation after HTO, showing no significant relationship with the other coronal and sagittal parameters of the ankle joint. Our hypothesis that axial rotation of the distal tibia after HTO would significantly affect the coronal and sagittal alignments of the ankle joint was therefore rejected.
After HTO, the coronal parameters in the knee joint, including the HKA angle and MPTA, revealed significant correction. These results were comparable to that in previous studies. Regarding the radiographic parameters in the sagittal plane, the flexion/extension angle of the knee joint significantly increased. The increased posterior tibial slope after medial opening-wedge HTO might have led to the increase in the flexion/extension angle of the knee joint and KLAS angle of the ankle joint.6,11,12 Among coronal parameters in ankle joint, KTPA and TPI were significantly corrected after the knee joint was realigned. The AAWBL ratio increased after HTO due to the lateralization of the ankle joint axis, which is consistent with the finding in a previous study. 6
Similar to that in previous studies, distal tibia showed significant internal rotation in the axial plane after HTO. Jang et al. 8 demonstrated that the unintended tendency for increased internal distal tibial rotation following HTO was positively related to the opening width and tuberosity osteotomy angle. Hinterwimmer et al. 7 suggested that increased tension in the semitendinosus tendon, which remains distal to the open-wedge osteotomy site, may cause the internal rotation of the distal tibia. Moreover, variations in the location and direction of the hinge axis may influence the distal tibial rotation.
Among these variables, the AAWBL ratio correction (R = 0.624) showed the strongest relationship with the tibial correction angle. The correction angle showed a significant relationship with changes in limb length, tibial length, HKA angle, MPTA, and KTPA. However, changes in tibial rotation showed no significant correlation with the other variables. Meanwhile, the AAWBL ratio significantly increased from 45.8% to 61.9%. The authors presumed that significant internal rotation of the distal tibia after HTO might have a substantial effect on the valgization of the hindfoot alignment, which could further lead to lateralization of weight-bearing line (WBL) after HTO. However, our data revealed no significant correlation between the changes in distal tibial rotation and other radiographic outcomes of the ankle joint, including the AAWBL ratio. Although the degree of internal rotation in the distal tibia did not affect the alignment of the ankle joint, we suggest that surgeons should be aware that the WBL in the ankle joint can shift laterally and that the distal tibia can rotate internally after HTO. Special caution is needed in patients with preoperative lateralization of the ankle joint axis and internal rotation of the distal tibia.
This study has several strengths. This is the first comprehensive study to analyze ankle alignment changes in all coronal, sagittal, and axial planes after HTO by investigating radiographic parameters automatically measured using the EOS system. This study analyzed the correlation between the degree of axial rotation of the distal tibia and other multiplane parameters of the ankle and knee joints that have not been investigated previously. In addition, all operative procedures were performed by the same surgeon with the same implant, to minimize the confounding variables.
The limitations of this study include its retrospective nature. Relatively short follow-up period is another limitation. Moreover, we did not investigate the clinical outcomes in the patients. Additional investigations of the correlation between radiologic and clinical outcomes are necessary.
In conclusion, this study showed that HTO tended to induce lateralization of the ankle joint axis (coronal), increase the posterior tibial slope (sagittal), and cause internal rotation of the distal tibia (axial). Axial changes in the distal tibia showed no significant relationship with the other coronal and sagittal parameters of ankle joint. However, we suggest that during HTO, surgeons should consider that the WBL of the ankle joint shifts laterally and that the distal tibia has a tendency to rotate internally after HTO.
Footnotes
Declaration of conflicting interests
The author(s) declared no potential conflicts of interest with respect to the research, authorship, and/or publication of this article.
Funding
The author(s) disclosed receipt of the following financial support for the research, authorship, and/or publication of this article: This study was supported by the National Research Foundation of Korea; RS-2023-00211971; 2022R1F1A1074656 and this work was supported by Konyang University Myunggok Research Fund of 2024.