
Abstract
Aim
To explore the effects of tibial osteotomy varus angle combined with posterior tibial slope (PTS) on the stress of polyethylene liner in total knee arthroplasty (TKA) by building finite element model (FEM).
Methods
Established the FEM of standard TKA with tibial osteotomy varus angle 0° to 9° were established and divided into 10 groups. Next, each group was created 10 FEMs with 0° to 9° PTS separately. Calculated the stress on polyethylene liner in each group in Abaqus. Finally, the relevancy between tibial osteotomy angle and polyethylene liner stress was statistically analyzed using multiple regression analysis.
Results
As the varus angle increased, the area of maximum stress gradually shifted medially on the polyethylene liner. As the PTS increases, the percentage of surface contact forces on the medial and lateral compartmental of the polyethylene liner gradually converge to the same. When the varus angle is between 0° and 3°, the maximum stress of the medial compartmental surfaces of polyethylene liner rises smoothly with the increase of the PTS. When the varus angle is between 4° and 9°, as the increase of the PTS, the maximum stress of polyethylene liner rises first and then falls, forming a trough at PTS 5° and then rises again. Compared to the PTS, the varus angle has a large effect on the maximum stress of the polyethylene liner (p < .001).
Conclusion
When the varus angle is 0° to 3°, PTS 0° is recommended, which will result in a more equalized stress distribution of the polyethylene liner in TKA.
Keywords
Introduction
Total knee arthroplasty (TKA) is the most effective treatment for end-stage osteoarthritis of the knee, with a forecasted increase in TKA rates of approximately 43% by 2050, but the number of revision total knee arthroplasty (rTKA) will increase at an even faster rate of nearly 90%. 1 The threat of aseptic loosening due to polyethylene liner wear after TKA to the long-term survival should not be underestimated, accounting for roughly 24% of the causes of rTKA. 2 In addition to causing aseptic loosening of the prosthesis, polyethylene wear may also directly increase the rates of periprosthetic joint infections because wear debris from polyethylene liner can cause significant rejection reactions. 3 A review described that the most important influence on the generation of wear particles was the contact stress. 4
The tibial osteotomy angle has a direct relationship to the distribution and value of contact stress on the polyethylene liner surface. In a study of component alignment in TKA, it was shown that tibial component alignment had a greater effect on postoperative force lines in the knee than femoral component alignment. 5 At the same time, improper rotation of the tibial component can lead to impingement of the tibial post against the femoral condyle, thereby increasing the maximum stress around the post, a phenomenon more common in posterior stabilized knee prostheses with fixed platforms. Polyethylene liner load distribution is directly related to prosthesis wear and prosthesis longevity. Therefore, it is more relevant to study the tibial osteotomy angle in TKA than the femoral osteotomy angle. In the coronal plane, Dong et al. showed by finite element orthogonal tests that the maximum stress of polyethylene liner was minimal in 90° neutral alignment of the tibial component, and that both varus and posterior tibial slope (PTS) would increase the maximum stress of polyethylene liner. 6 In the sagittal plane, Shi et al. found that PTS was positively correlated with postoperative knee flexion range of motion and that changes to PTS in the range of 0° to 7° had no effect on knee stability. 7 Kang et al. found that excessive PTS can lead to laxity of the knee ligaments, and the greater the posterior tilt the tighter the collateral ligament tension in a series of finite element analyses.8,9 Also not recommended for large PTS is that Pourzal et al. showed a 9.3 mm3/year increase in polyethylene liner surface wear rate for larger PTS (>7°) compared to smaller PTS (<3°) in TKA. 10 In contrast, Wang et al. concluded that a larger PTS resulted in a larger tibiofemoral contact area and reduced contact pressure. 11 These studies were performed only in the coronal plane or only in the sagittal plane for tibial osteotomies. However, the osteotomy of the tibial plateau in TKA needs to be performed in all three planes, and considering only a single plane does not realistically simulate the actual situation. There has been no study reported on the tibial osteotomy varus angle combined with PTS on the stress distribution of polyethylene liner in TKA.
Finite element analysis (FEA) allows relatively accurate calculations and simulations in TKA. 12 Finite element analysis has been further investigated in terms of prosthesis materials and design, prosthesis component alignment and surgical protocols. 12 It provides an important reference for the accurate diagnosis and treatment of knee diseases, the design of artificial knee prosthesis and the study of knee biomechanics. Finite element model (FEM) studies on the structure of the human knee joint and knee prosthesis under various loads are quite well established.13–15 Therefore, we explored the appropriate varus angle combined with PTS by establishing TKA FEM, and analyzed and discussed the maximum stress of the polyethylene liner and its distribution area and the surface contact force of the medial and lateral compartments on the polyethylene liner.
Materials and methods
Data acquisition
A 25-year-old healthy male (height 175 cm, weight 70 kg) left knee was selected as the original knee model and signed an informed consent form. CT scans (TOSHIBA Aquilion) were performed on the knees of the volunteers from 10 cm above the knee to 10 cm below the knee. The layer thickness and layer spacing of the scans were 1 mm. The CT scan data were saved in DICOM format and stored in CD-ROM.
Building of the preoperative three-dimensional model
First, the CT images of the knee were imported into Mimics 2.0 (Materialise, Belgium), and bone tissue was extracted. The 3D model of the knee joint is reconstructed by the functions of threshold setting, region growth, image segmentation and automatic extraction in the software system. Then, the 3D model of the knee joint created in Mimics was imported into Geomagic Studio 2013 (Geomagic, Inc, Research Triangle Park, NC, USA) for model surface noise reduction and solid transformation. Using Boolean operations, the overlap and redundancy generated during the reconstruction of each structure were subtracted to ensure the fit between the reconstructed tissues, which completed the preoperative 3D model reconstruction of the knee joint (Figure 1(a)). Then, a CRONOS 3D scanner (Open Technologies, Italy) was used to scan the femoral component (cobalt-chromium-molybdenum), the tibial component (titanium) and the polymer polyethylene liner of the knee TKA prosthesis (XM, Beijing Chunli Zhengda Medical Equipment, PS Prosthesis). The “STL” format file for each component of the prosthesis was processed and converted into a “STEP” format file, which was then imported into Abaqus to generate the FEM of the prosthesis. Knee model in different formats (a) Reconstructed geometric model of the knee joint. (b) Frontal image after TKA. (c) Lateral image after TKA. (d) Two contact surfaces of the femoral prosthesis and polyethylene liner. (e) Mesh delineation of each component after TKA.
Building of the TKA 3D model
First, the femoral mechanical axis (connecting the center of the femoral head to the center of the knee joint) and the tibial mechanical axis (connecting the center of the tibial stem to the center of the tibial tuberosity) were identified as reference standards for prosthesis positioning in RapidformXOR3 (Rapid Corporation, Korea), respectively, according to the preoperative model of the knee joint. The knee prosthesis used in this study was a PS prosthesis, and the anterior and posterior cruciate ligaments of the knee needed to be removed intraoperatively. Then, a virtual operation of the knee model was completed according to the TKA surgical guidelines and the surgeon’s recommendations, and the prosthesis type was determined according to tibial and femoral dimensions to simulate a total knee replacement (Figure 2.). Firstly, 10 3D models of the knee joint with tibial plateau osteotomy varus angles of 0° to 9° were established respectively, and divided into 10 groups (I-X). And in each group then build a 3D model of the knee joint with PTS 0° to 9°, respectively. Ultimately, 100 total knee postoperative models of 0° to 9° varus angle combined with PTS 0°-9° were obtained. Stratigraphy for FEM of TKA.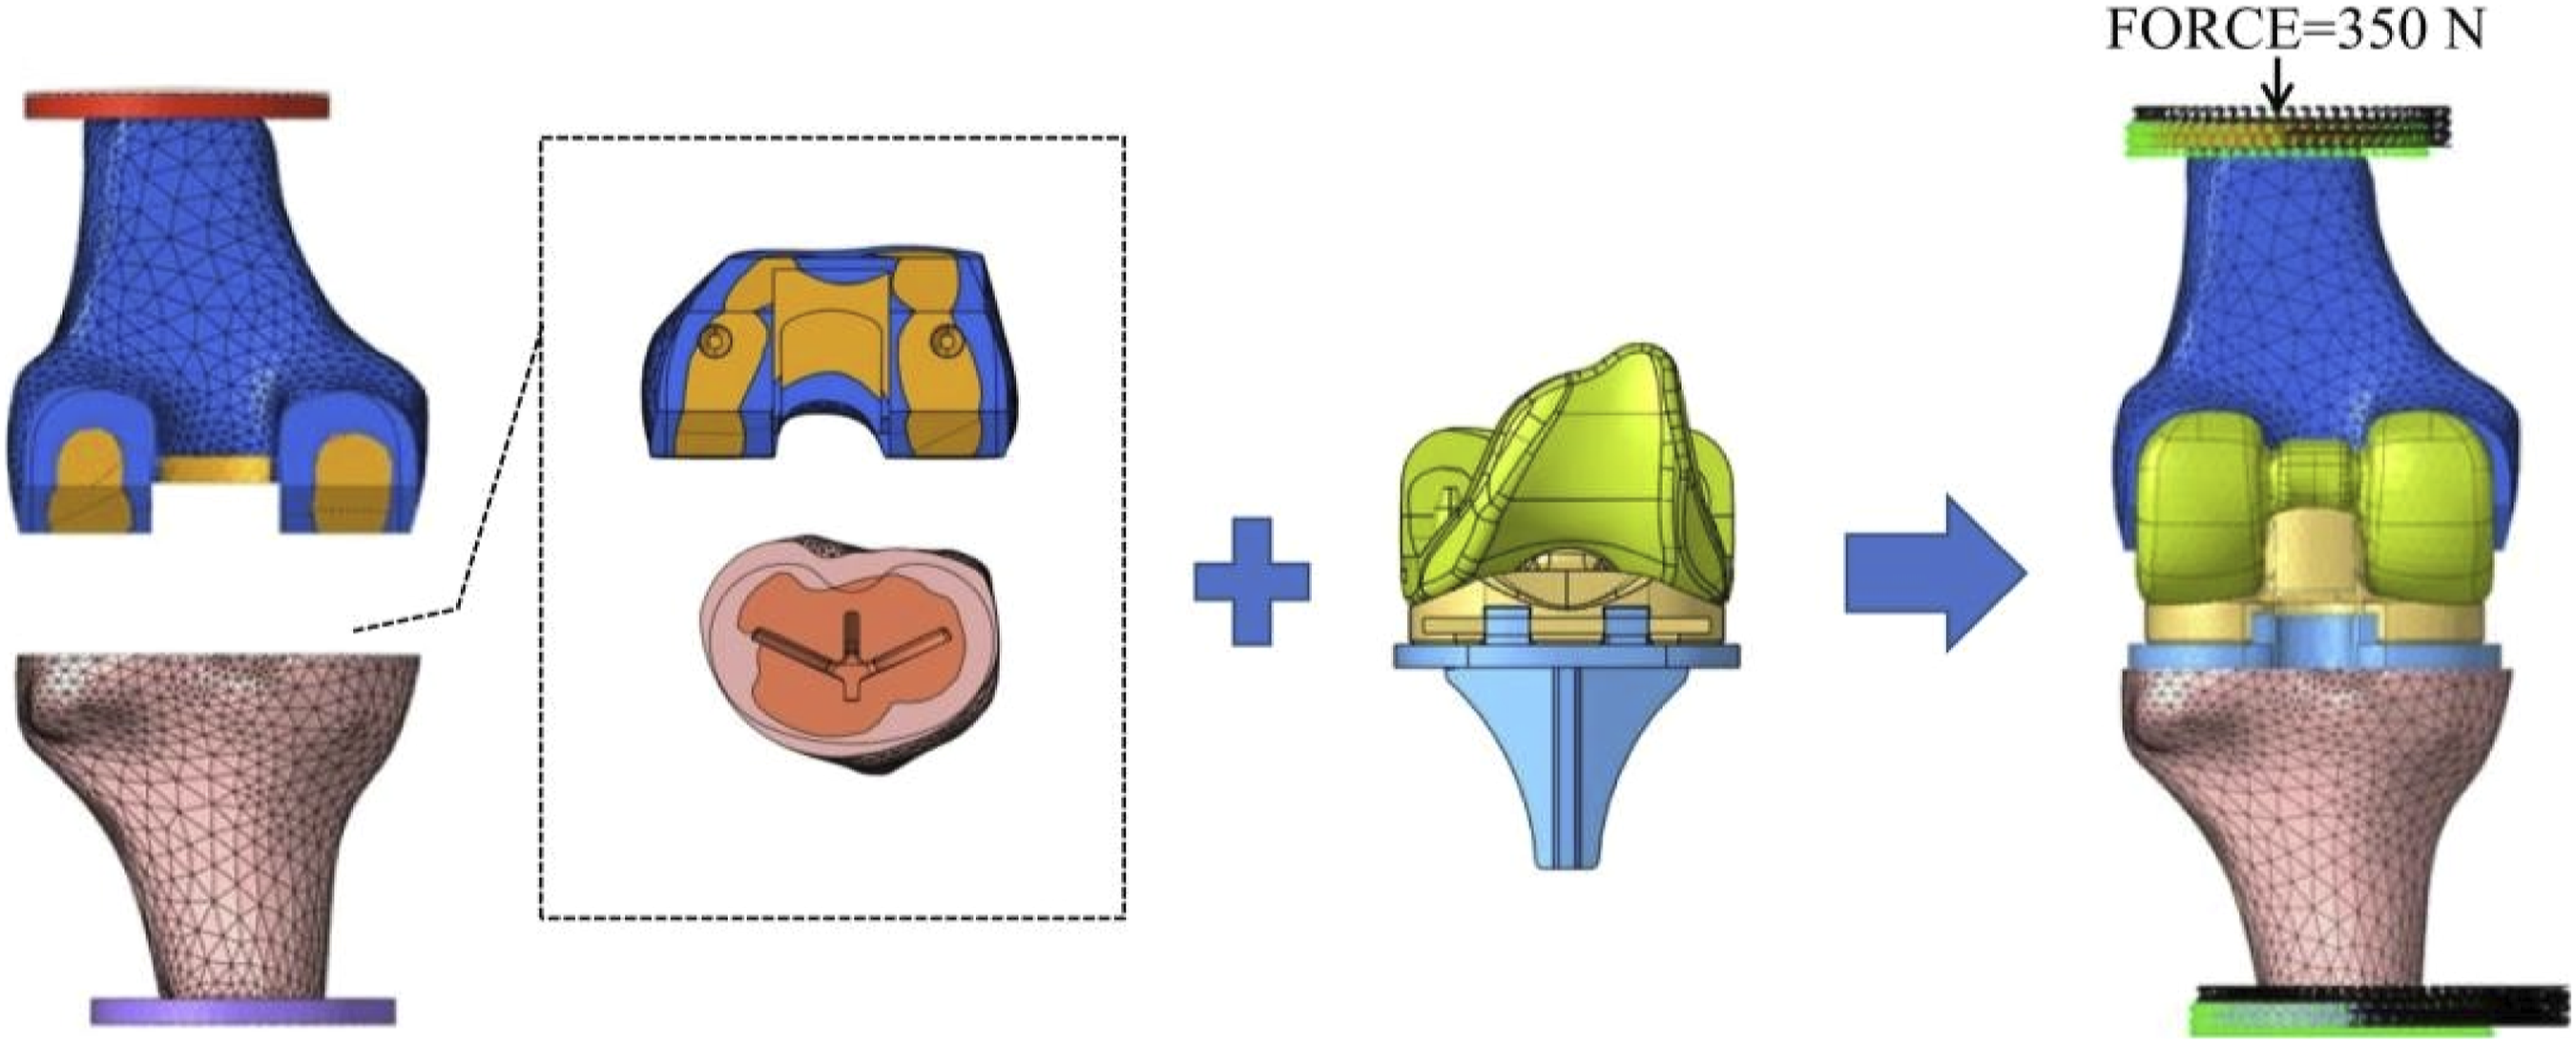
Constraint settings
According to the real structure of the knee joint simulated contact settings. The tibial component and polyethylene liner were fixed by the locking mechanism, and the tibial prosthesis was fixed with the tibia and the bone cement between the distal femur and the femoral component, all of which will not undergo relative displacement, so it was set as a binding constraint, and no relative motion and deformation will occur during the analysis.
Material properties
Material properties.

Boundary and loading conditions
In order to facilitate loading, a disc was added to the proximal femur and distal tibia with a diameter of 50 mm and a thickness of 5 mm, and the disc was set as a discrete rigid body, which basically does not undergo relative deformation during the model calculation. A reference point was established at the center of the upper surface of the disc proximal to the femur, and a vertical downward axial force of 350 N (half the weight of the volunteer) was applied to the reference point (Figure 1(b) and (c)). To facilitate force transmission, the reference point on which the force was applied is coupled to the upper surface of the disc for restraint, ensuring that the femoral disc can transmit the force and move accordingly under the action of the force. The proximal femur was fixed, allowing only its translation in the vertical direction (Z-direction) relative to the tibia, while allowing rotation of the tibia relative to the femur in three axial directions.
Grid segmentation
All the components involved in the analysis were meshed under the Mesh module of Abaqus, and the components with poor boundary quality (sharp edges after cutting operations) were chamfered or virtual topology was divided using a ten-node modified tetrahedral cell (C3D10M) (Figure 1(d)).
Solving calculations
In order to simulate the most realistic contact condition, we divided the contact surfaces of the polyethylene liner and the femoral condyle into two groups on the left and right side in ANSYS software (Figure 1(e)), and the gap between the femoral condyle and the polyethylene liner interface of the model was calculated and adjusted to within 0 to 0.1 mm one by one. In particular, for models that show penetration, the gap needed to be adjusted from negative values to within 0 to 0.1 mm, which generated the best fit for the calculation of the model after knee arthroplasty.
Statistical methods
The data of each group were statistically analyzed using SPSS 21.0 (IBM, USA). The data of maximum stress and surface contact force of polyethylene liner conform to normal distribution, and the data were expressed as X ± S. Multiple regression analysis was applied to correlate the relevancy between tibial osteotomy angle and polyethylene liner stress.
Results
Verification of normal TKA FEM
A vertical force of 350 N was applied along the femoral mechanical axis on the normal TKA FEM, the percentage for surface contact force of the medial and lateral compartmental surfaces of the polyethylene liner is 62.1% and 37.9%, which are similar to the literature results. 16 The maximum stress of the medial and lateral compartment surface of the polyethylene liner were 3.23 MPa and 2.77 MPa, which are similar to the literature results. 17 All of the above indicated the FEM was valid.
The Von Mises stress cloud map on the surface of the polyethylene liner
The Von Mises stress cloud map presents the location of the stress concentrations in each group at the medial posterior corner of the polyethylene liner and around the tibial post. As the PTS increases, the stress concentration shifts to the posterior of the polyethylene liner. As the varus angle increases, the stress concentration shifts to the medial of the polyethylene liner. Sometimes with changes in the angle of the tibial plateau, the position of the maximum stress will shift from the medial posterior side of the polyethylene liner to around the tibial post. We have chosen a part of representative von Mises cloud maps displayed in Figure 3. The Von Mises cloud map of the polyethylene liner at different tibial osteotomy angles.
Maximum Von Mises stress on polyethylene liner
As the PTS increased (0° to 9°) at varus angle is 0°, the maximum stress of the polyethylene liner increased from 3.23 MPa to 4.54 MPa. As the varus angle increased (0° to 9°) at PTS 0°, the maximum stress of the polyethylene liner increased from 3.23 MPa to 7.67 MPa. The maximum stress of the polyethylene liner increased from 3.23 MPa at 0° varus combined with 0° PTS to 11.15 MPa at 9° varus combined with 9° PTS. In all groups, the maximum stress of the medial posterior side of the polyethylene liner increased as the PTS increased, and when the PTS reached about 8°, the maximum stress of the medial posterior side of the polyethylene liner had a tendency to decrease. Specifically, when the varus angle is between 0° and 3°, the maximum stress on the medial posterior side of the polyethylene liner rises smoothly with the increase of the PTS. When the varus angle is between 4° and 9°, with the increase of the PTS, the maximum stress of the medial posterior side of the polyethylene liner rises and then falls, forming a trough at PTS 5°, and then rises again (Figure 4). Folding diagram of the maximum stress of the polyethylene liner for different varus angle combined with PTS. (a)–(j) represent varus angles 0° to 9°, respectively.
The percentage for surface contact force of the medial and lateral compartmental surfaces of the polyethylene liner
As the PTS increase, the percentage for surface contact force of the medial side of the polyethylene liner increases and then decreases. When PTS 2°, the percentage for surface contact force of the medial side of the polyethylene liner is the highest (79.7%), the percentage for surface contact force of the lateral side of the polyethylene liner is the lowest (20.3%); When PTS 9°, the percentage for surface contact force of the medial side of the polyethylene liner is the lowest (56.9%), the percentage for surface contact force of the lateral side of the polyethylene liner is the highest (43.1%). As the PTS increased, the percentage for surface contact force of the medial and lateral side of the polyethylene liner gradually tended to be the same.
Multiple regression analysis between the osteotomy angle of the tibial plateau and the maximum stress of polyethylene liner fitting of the correlation regression equation
In order to study the effect of the osteotomy angle of the tibial plateau on the maximum stress of the polyethylene liner, Next, a multiple regression analysis was performed using SPSS 25.0 with the dependent variable being the maximum stress, the independent variables being the varus angle, the PTS, and the varus angle combined with PTS, the model form is following.
Y represents maximum stress of polyethylene liner, β0 represents the constant term, x1 represents the tibial varus angle, β1 represents the regression coefficient of tibial varus angle, x2 represents the PTS, β2 represents the regression coefficient of PTS, x1*x2 represents the varus angle combined with PTS, β3 represents the regression coefficient of the varus angle combined with PTS, and ε represents the random error.
As seen in the table above, the R2 of this linear regression equation was 0.703, indicating a moderate correlation between the osteotomy angle of the tibial plateau and the maximum stress of polyethylene liner F = 79.261 (p < .001). A significant positive correlation between the varus angle and the maximum stress of polyethylene liner (B = 0.546, p < .001), indicating that the greater the varus angle, the greater the maximum stress of polyethylene liner; A significant positive correlation between PTS and the maximum stress of polyethylene liner (B = 0.295, p < .001), indicating that the greater the PTS, the greater the maximum stress of polyethylene liner. The experiment showed that the varus angle had the greatest effect on maximum stress of the polyethylene liner (β = 0.691>β = 0.374).
Discussion
In this study, the effect of the varus angle combined with PTS on the load distribution of the polyethylene liner in TKA was explored by FEA. We found that the stress concentration of the polyethylene liner is mainly distributed in the medial posterior corners, and with the increase of the varus angle, the stress concentration moves to the medial side, and with the increase of the PTS, the stress concentration moves to the posterior side. When the varus angle is not changed, the stress on the surface of the polyethylene liner is more balanced with the increase of PTS; however, when the varus angle and PTS are considered together, it is recommended that the PTS 0° when the varus angle is 0° to 3°.
As we know, most authors agree that the tibial component should be placed along the mechanical axis of the lower extremity in the coronal plane, and that either varus or valgus will affect the longevity of the prosthesis.
6
However, osteotomy errors can occur even with the most skilled surgeons, and anatomic variations in the proximal tibia can lead to deviations from the expected tibial alignment. Observation of the Von Mises cloud map from this experiment shows as the increase of varus angle, the location of stress concentration gradually moves to the medial polyethylene liner surface (Figure 3). This phenomenon is similar to previous findings by Stan et al. that when the tibial varus 3°, the stress concentration shifted towards the medial region slightly, and when the tibial varus 8°, the stress was distributed in a narrower region.
18
Notably, the location of the maximum stress is not only at the medial posterior corner of the polyethylene liner surface, but sometimes shifts around the polyethylene liner post with the angle, they shift to the polyethylene liner post as the angle changes, which may be related to the impingement of the anterior aspect of the tibial post with the femoral cam.
19
This phenomenon is also an important cause of limited knee motion and excessive wear and loosening of the prosthesis after TKA. As the varus angle increases, both the maximum stress in the polyethylene liner and surface contact force on the medial and lateral intercompartmental surfaces of the polyethylene liner increase (Figures 4 and 5). In this experiment, multiple regression analysis showed that the effect of varus angle (0° to 9°) (B = 0.546, p < .001) on the peak contact stress on the polyethylene liner surface was greater than PTS (0° to 9°) (B = 0.295, p < .001) (Table 2). In TKA, it is usually recommended that the tibial prosthesis be placed in a neutral position to avoid the presence of varus alignment or even valgus, which allows for a more balanced stress on the polyethylene spacer. However, some surgeons have used kinematic alignment in order to restore the original force line to the lower extremity and have achieved good short and medium term follow-up results.
20
Histogram of the surface contact force on the medial and lateral compartmental surfaces of the polyethylene liner for different varus angle combined with PTS. Results of multiple regression analysis between the osteotomy angle of the tibial plateau and the maximum stress of polyethylene liner. B represents the regression coefficient and intercept of the multiple linear regression equation (coefficient and intercept of the equation); β represents the regression coefficient; t represents the result of the t test of the regression coefficient; p is the result obtained during the calculation of the paired t test (used to assess “significance”); F represents the variance test of the regression model as a whole; R2 represents the model correlation coefficient; *** represents p < .001.

In TKA, a PTS of about 5° is usually required. The human tibia naturally exists a certain posterior inclination angle, the posterior inclination angle can maintain the tension of the anterior and posterior cruciate ligaments of the knee, so that the femoral condyles in the knee flexion and extension movements can be normal sliding and rolling, which is conducive to the flexion of the knee. By observing the results of the experiment (Figure 5), we can find that there was a tendency for the maximum stress of medial posterior polyethylene liner to decrease when the PTS exceeded 2°, which indicates that the increase in PTS equalizes the forces on the medial and lateral compartments surface of the polyethylene liner. This means that the presence of some degree of PTS in the tibial osteotomy will not only reduce maximum stress of medial posterior polyethylene liner, but also facilitate the stress distribution on the polyethylene liner. However, the PTS should not be too large in actual clinical procedures. Excessive PTS should be avoided because studies have shown that oversized PTS may lead to anterior-posterior instability, resulting in a more anteriorly shifted tibia. 21 In addition, the increase in PTS leads to the impingement of the anterior aspect of the tibial post with the femoral cam, resulting in increased contact stress and anterior post wear and deformation. Excessive increases in PTS may also lead to progressive tibiofemoral joint loosening due to decreased collateral ligament tension. 22 When considering the effect of tibial osteotomy varus angle combined with PTS on the stress distribution of the polyethylene liner in TKA, we can observe that the maximum stress of medial posterior polyethylene liner increases smoothly with increasing PTS when the varus angle is between 0° and 3°. When the varus angle is between 4° and 9°, the maximum stress of medial posterior polyethylene liner rises and then falls as PTS increases, forming a trough at PTS 5° and then rising again (Figure 4).
There are some limitations in this study. Firstly, we used axial stress as the load, which generated normal stress on the polyethylene liner in equilibrium. In fact, when the tibial osteotomy angle changes, some of the normal stress become shear stress. And this experiment did not study the shear stress. Secondly, the patellar ligament and the lateral collateral ligament were omitted in this FEM. The presence of ligaments in the FEM is important to obtain realistic contact stresses. Finally, we used a healthy human knee joint for modeling and did not consider anatomical variations. The proximal tibial anatomical variation will directly affect the tibial osteotomy, to obtain the most realistic osteotomy angle parameters, controlled experiments can be conducted by including tibial anatomical variant bones in coronal or sagittal plane. These issues provide new ideas for further research. FEA including soft tissue, and even dynamic FEA can better and accurately simulate the mechanical state after TKA, and thus is expected to provide better guidance for clinicians.
Conclusion
We successfully established FEMs of TKA with different tibial osteotomy angles. By analyzing the relationship between the surface stress of the polyethylene liner and the osteotomy angle, we found that the varus angle combined with posterior tibial slope of the tibial plateau osteotomy should be considered together during clinical surgery.
Footnotes
Declaration of conflicting interests
The author(s) declared no potential conflicts of interest with respect to the research, authorship, and/or publication of this article.
Funding
The author(s) disclosed receipt of the following financial support for the research, authorship, and/or publication of this article: This work was supported by the Jilin Province Development and Reform Commission (2023C039-4).