
Abstract
Background
It is unclear whether muscle atrophy (MA) and fatty degeneration (FD) have improved after arthroscopic rotator cuff repair (ARCR). Therefore, the objective of this study was to perform quantitative magnetic resonance imaging (MRI) measurement to evaluate MA and FD before and after surgery. Correlations of clinical outcome with changes in MA and FD were also analyzed.
Materials and Methods
From March 2013 to March 2017, 40 patients who had no re-tear up to 1 year after ARCR were enrolled. MA and FD of supraspinatus muscle before surgery, at 3 days after surgery, and at 1 year after surgery were measured quantitatively in conventional Y-view and supraspinatus origin-view (SOV). Measurement items were muscle area (mm2), occupation ratio (%), fatty infiltration (FI, %), and fatty degenerative area (mm2). Postoperative clinical outcomes were measured at 1 year after ARCR. Correlation between measure values and outcome scores were analyzed.
Results
Inter-measurement reliability was high (ICC = 0.933, Cronbach-α = 0.963). There was no significant change in MA in conventional Y-view at 1 year after surgery (Occupation ratio, p = 0.2770; MA, p = 0.3049) or in SOV (MA, p = 0.5953). FI and fat area measured with the conventional method on Y-view and showed significant differences (p = 0.0001). However, FI and fat area measured with the modified method on Y-view and SOV showed no significant difference (all p > 0.05). Postoperative clinical outcomes showed significant improvement compared to preoperative ones (p = 0.0001). However, there was no significant correlation between FD and FA (p = 0.653).
Conclusion
Quantitative MRI measurement was shown to be a reliable and valid method. MA and FD do not improve after ARCR considering postoperative anatomical changes of supraspinatus at 1-year follow-up. FD of the supraspinatus in conventional Y-view, but not in SOV, showed a significant change at 1 year postoperatively. MA showed no significant improvement. There was no correlation between improvement in clinical scores and changes in FD and MA.
Keywords
Introduction
Rotator cuff tear is the most common diseases in shoulder. It has a high incidence in individuals aged over 60 years. Arthroscopic rotator cuff repair (ARCR) leads to good midterm to long-term results in most cases.1,2 It is becoming more and more popular. However, re-tear is the most common complication of ARCR with poor outcomes.3,4
Several predictive factors are known to influence the structural and clinical results of ARCR. Muscle atrophy (MA) means a decrease in the cross-sectional area of the muscle that can results in reduced ability to generate force. Fatty degeneration (FD) means the replacement of muscle fibers by the fat within and around the muscle. MA and FD are important prognostic factors to predict surgical and clinical results of rotator cuff repair.5–8 Therefore, evaluation of MA and FD is essential for clinical decision-making in patients who suffer from rotator cuff tear. Accurate methods of measuring MA and FD are crucial.
There are qualitative and quantitative parameters in the method of evaluating and classifying MA and FD. Quantitative parameters of MA mainly include muscle area (mm2) and occupation ratio (%). Tangent sign and Thomazeau classification are used as qualitative parameters of MA.9,10 Quantitative parameters of FD include degree of fatty infiltration (FI, %) and degenerative fat area (mm2). Goutallier classification is the most well-known qualitative parameter of FD. 11 MA and FD are mainly measured in T1-weighted oblique sagittal MRI sequences through conventional Y-view and supraspinatus origin view (SOV).12,13
It is clear that MA and FD progress in patients who experience a re-tear after ARCR. However, whether they would improve after a successful repair remain unclear. Some studies have demonstrated that atrophy and fatty infiltration of the rotator cuff muscle are halted or reversed with a successful rotator cuff repair.14,15 However, other researchers have showed them irreversible.16,17 Although many studies have measured and compared serial MRI, recovery after a successful repair remains controversial.
In previous studies, parameters evaluated in the oblique sagittal MRI before and after the surgery were not measured at the exact same position. Thus, they could not accurately reflect tendon traction during the surgery.
Therefore, qualitative parameters measured in conventional Y-view and SOV were used with conventional and modified methods for the evaluation of MA and FD before and after ARCR. The purpose of this study was to investigate changes in MA and FD after ARCR. Correlation of clinical outcomes with changes in MA and FD were also analyzed.
Materials and methods
Ethics approval and consent to participate
All methods were performed in accordance with relevant guidelines and regulations. All experimental protocols were approved by the Institution Review Board (IRB) of Hallym University Kangnam Sacred Heart Hospital (IRB approval No. HKS 2018-06-025). Informed consent was exempted by the IRB due to its retrospective nature.
Patient selection
Subjects were 88 patients diagnosed as rotator cuff tears from March 2013 to March 2017. Inclusion criteria were: (1) duration from March 2013 to March 2017, (2) age from 50 to 79 years old, (3) medium to large (2–4 cm) rotator cuff tear diagnosed by preoperative MRI, (4) those who had had pain for more than 6 months and had received ARCR, and (5) those who had undergone MRI one time preoperatively and two times postoperatively (3 days and 1 year after ARCR). Exclusion criteria were: (1) acute traumatic tear, (2) coexisting pathology (malignancy, systemic disease, and infection), (3) previous ipsilateral shoulder operation, (4) tear size less than 2 cm or more than 4 cm, and (5) re-tear after surgery (Sugaya classification IV and V).
During the research, an additional 33 patients were excluded because of inaccurate shadowing or inaccurate imaging in the MR image (the absence of medial sagittal view), leaving a total of 40 patients (Figure 1). Patient flow chart. A total of 88 patients were diagnosed with rotator cuff tear by MRI. Fifteen patients were excluded based on the exclusion criteria. The remaining patients underwent ARCR. Follow-up MRI was taken. Thirty-three patients were also excluded due to inadequate MRI or absent of medial sagittal view. Finally, a total of 40 patients were analyzed.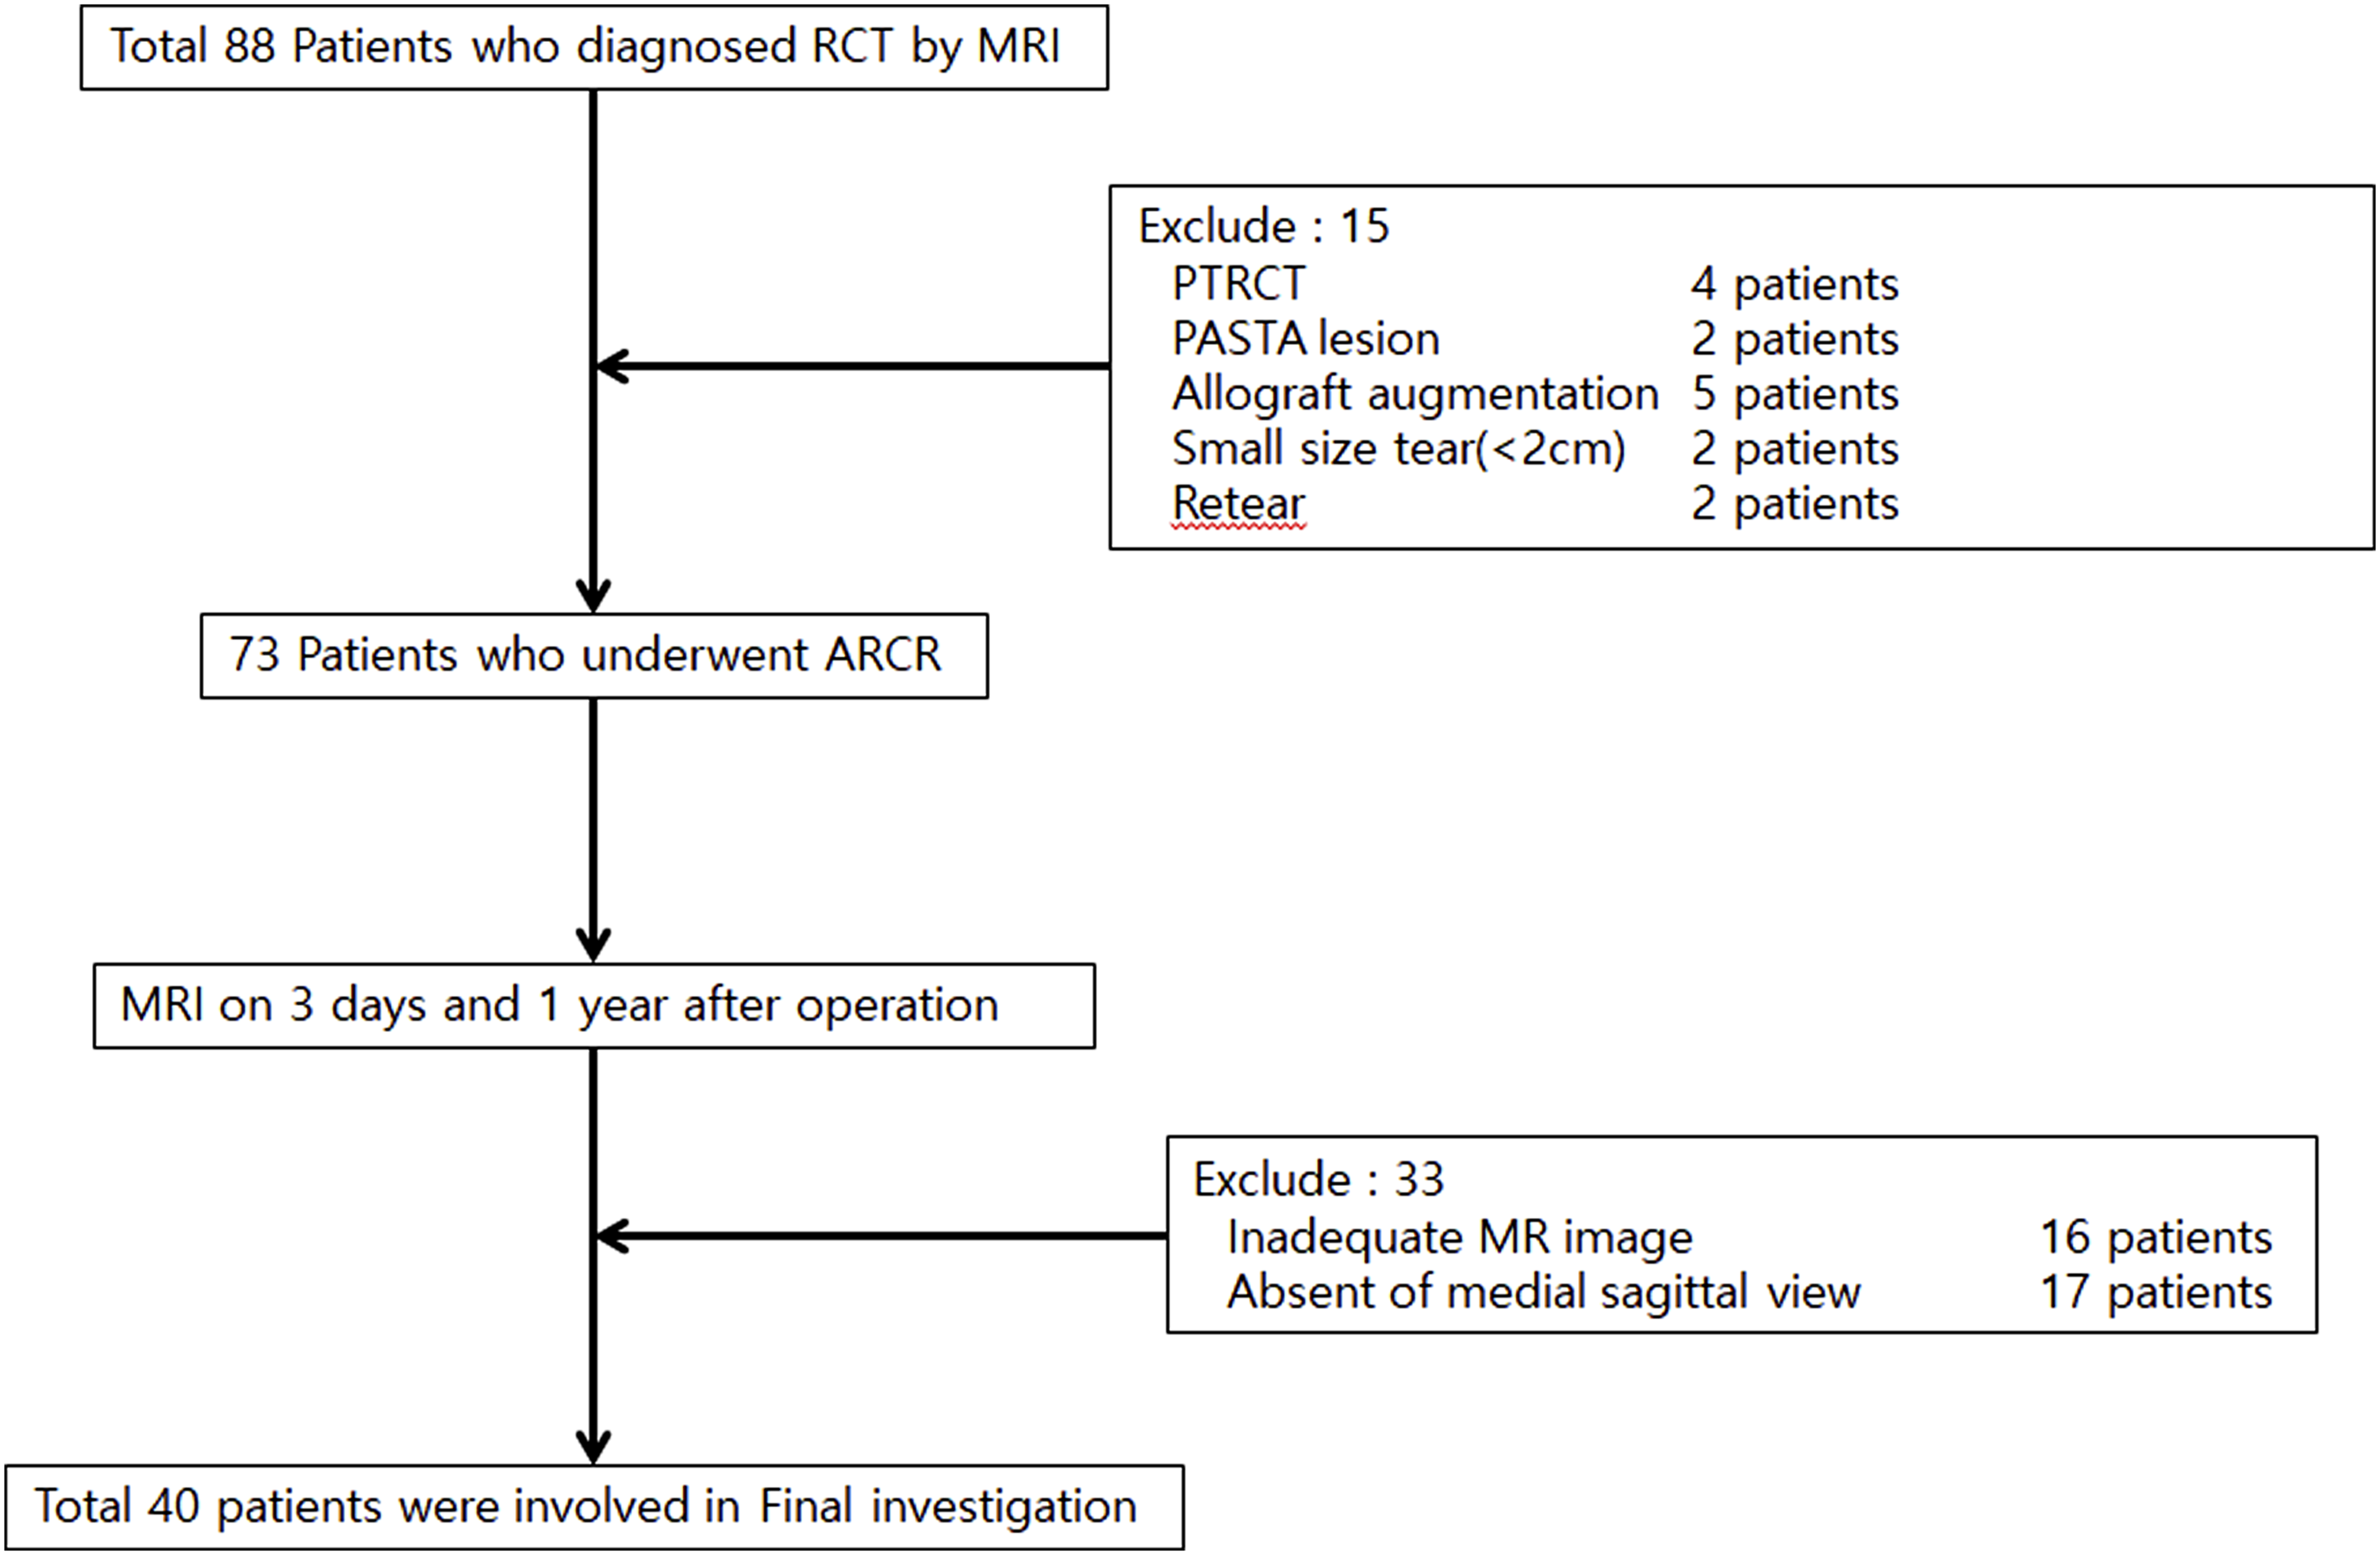
MRI segmental measurements are often performed in the most lateral sagittal scapular Y-view (Figure 2), where the coracoid base and scapula body show a Y shape.
12
Most studies have evaluated MRI at this location (conventional Y-view). However, this method is relatively inaccurate because tendon retraction due to tear of the rotator cuff with the resulting muscle thickening in the sagittal view of the same position and the medialization of the muscle at that position are not reflected. The results of one measurement are not yet clear. Therefore, measurements are performed in SOV, where the retraction effect is expected to be the least (Figure 3).
13
This is the oblique sagittal view of the most lateral part of the osseous origin of the supraspinatus muscle. The conventional Y-view, in which the coracoid base and the spine and body of the scapula form a Y shape in oblique sagittal MRI sequences. The most lateral portion of the osseous origin of supraspinatus muscle is defined as the supraspinatus origin view (SOV).

MRI assessment
MRI examination was performed in all patients in a neutral to external rotation position using a 3.0T magnet (Siemens Healthcare, Erlangen, Germany) with an interval of 4 mm for each sagittal slice. The total scan time was approximately 15 min (3.0T). Measurements were performed using a picture archiving and communication system (PACS) program (Infinitt Healthcare, Seoul, Korea) available in the medical center. Standard T2-weighted images were used for measurements according to the following method. 18
All patients underwent MRI examination three times (one preoperatively and two postoperatively at 3 days and 1 year after ARCR). MA and FD were evaluated in the conventional Y-view and SOV. To quantify FD, FI (%), and fat area(mm2), borders of muscles were outlined manually. Signal intensities within boundaries were manipulated with PACS system. First, we drew an outline of the base muscle area, and used pseudo-color mapping function which turns the fat integrity into red. Value of FI and fat area were then obtained directly (Figure 4).
19
Because of the uncertain boundary between muscle portion and fat portion, two different methods were used to obtain more accurate and precise measurements. The percentage of fatty infiltration was calculated based on the estimated anatomical muscle occupying area (Method I) or the actual muscle occupying area (Method II) (Figure 5). To quantify FI (%) and fat area (mm2), borders of target area are outlined manually. Signal intensities within boundaries are manipulated with the PACS system. Areas with high signal intensity represent fat turning into red using the pseudo-color mapping function in the PACS system. Value of FI (%) and fat area (mm2) are then obtained directly. For more accurate and precise measurement, two different methods are used. The percentage of fatty infiltration is calculated based on estimated anatomical muscle occupying area (Method I) or actual muscle occupying area (Method II).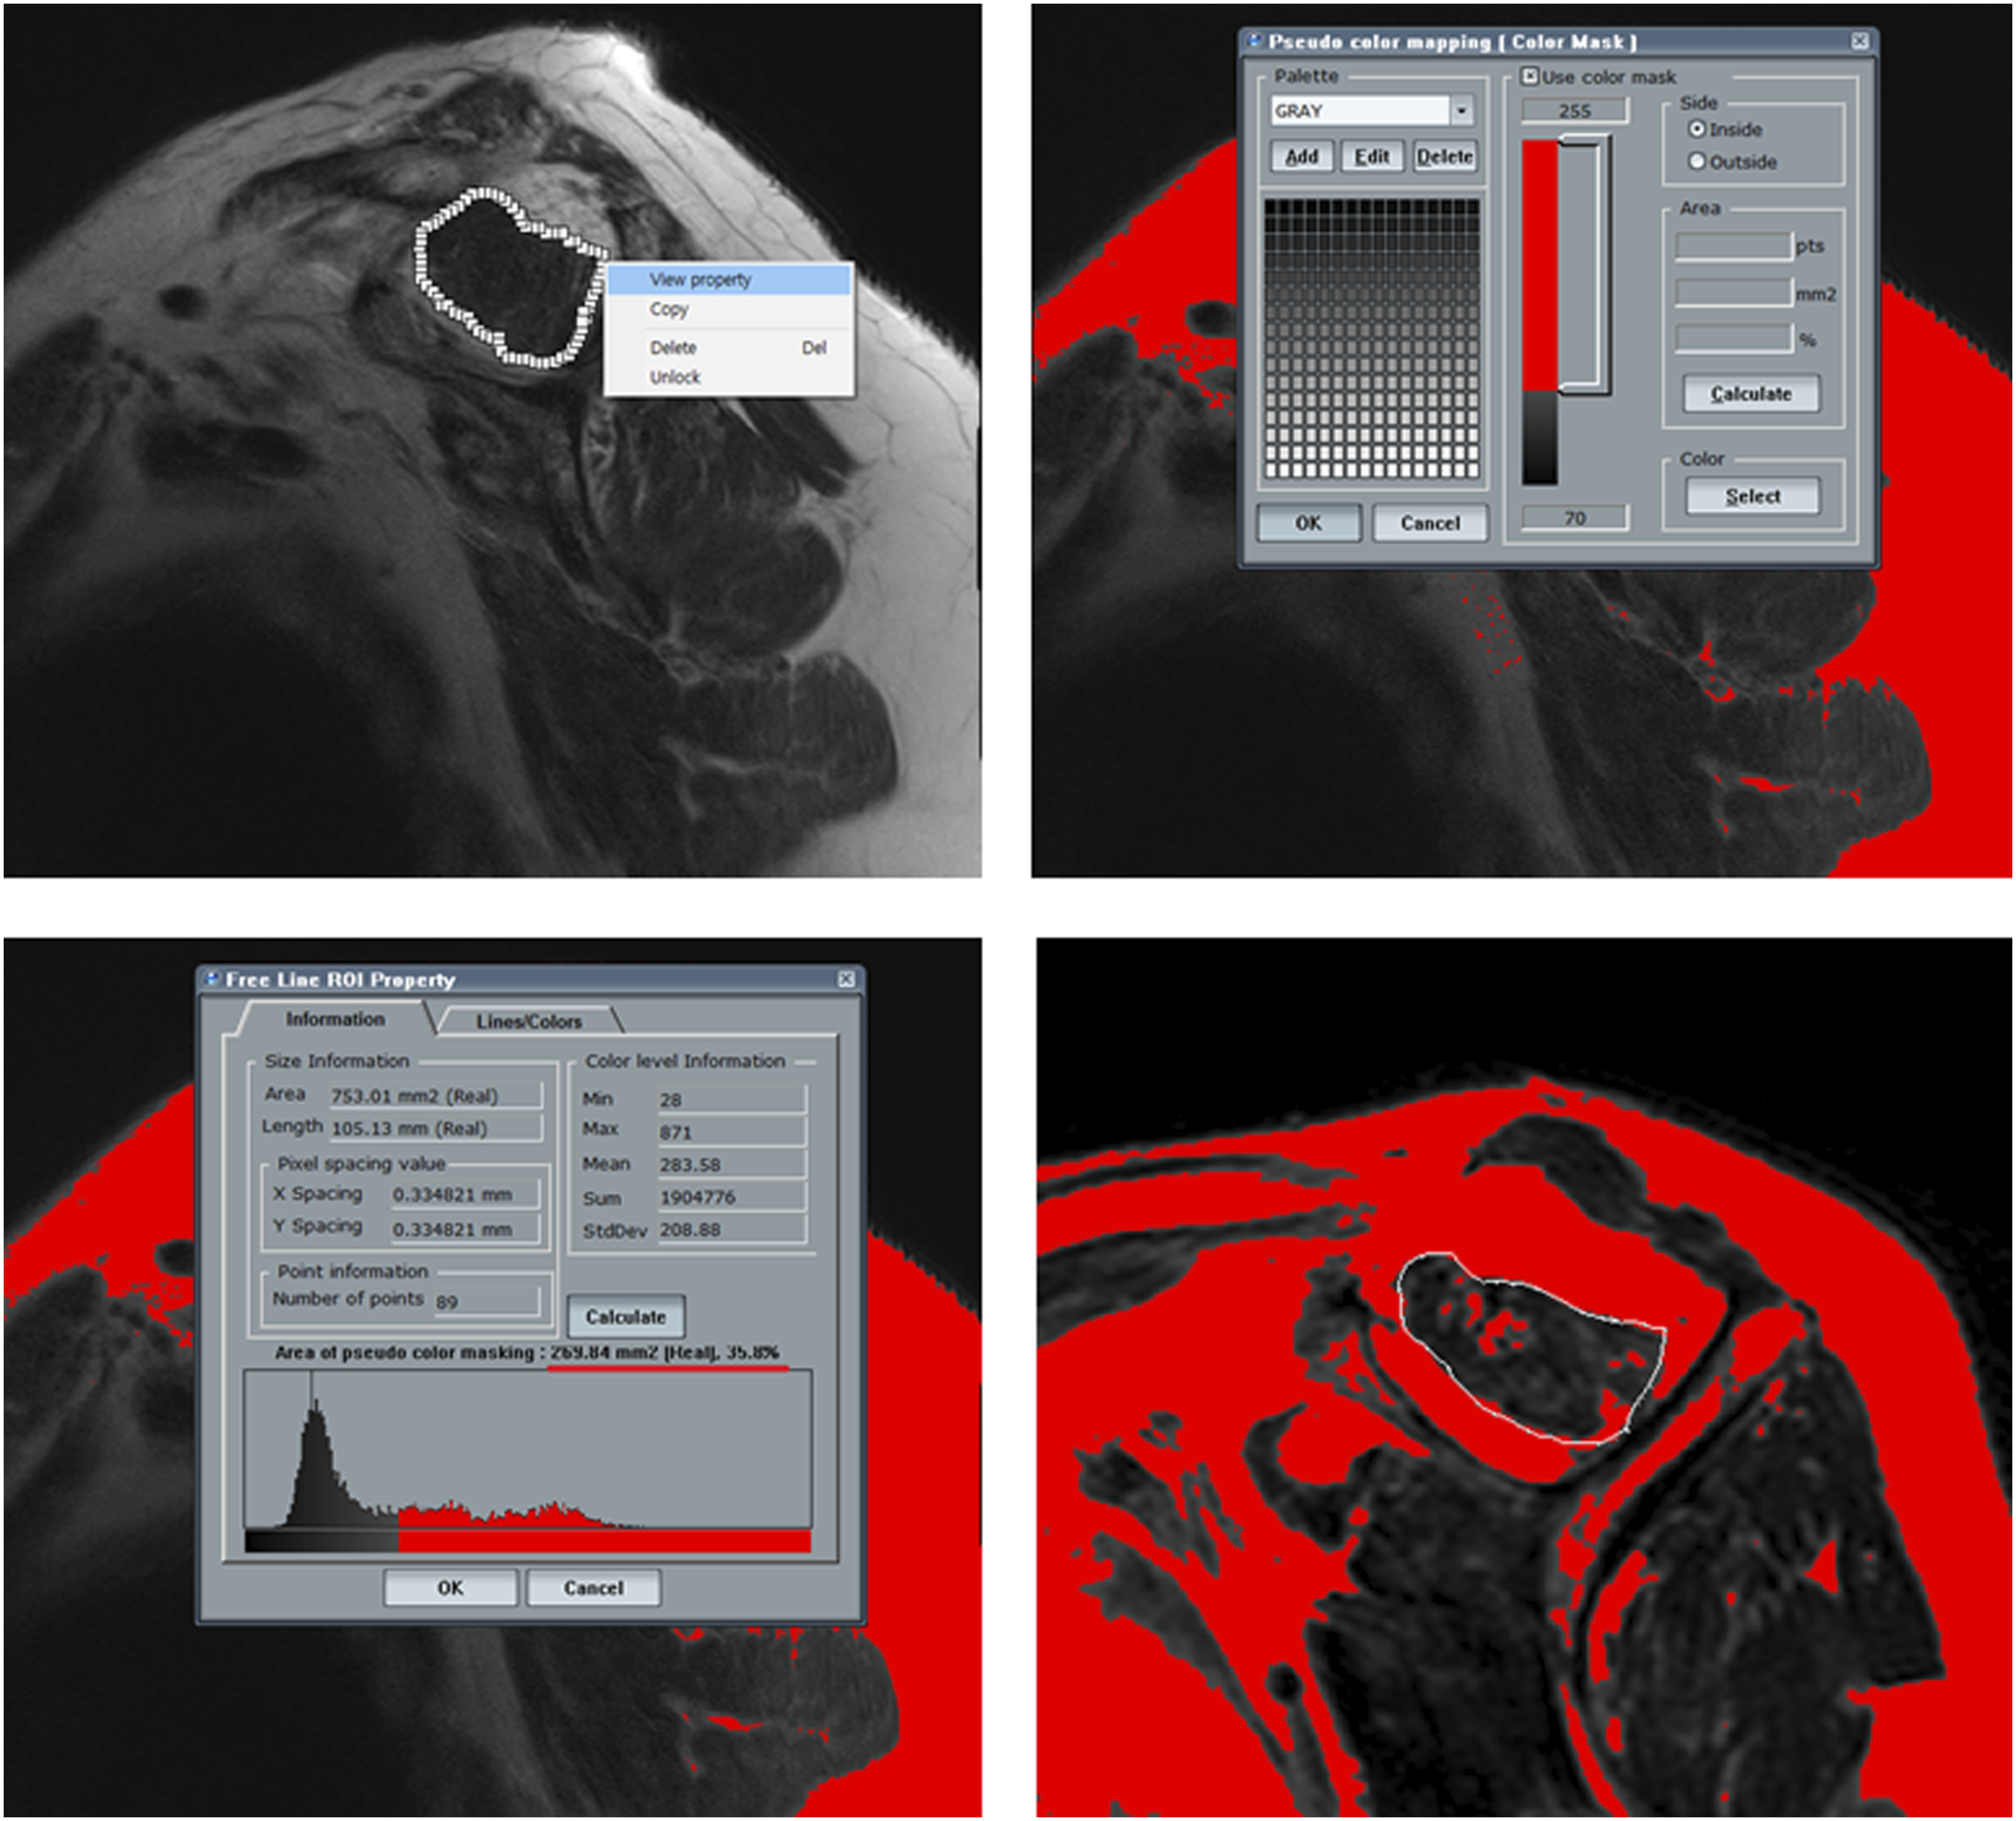

To quantify MA, occupation ratio (%) and muscle area (mm2) were measured. The occupation ratio was the ratio between the cross-sectional area of the muscle belly and its fossa on oblique sagittal Y-view of MRI. We drew an outline of the estimated anatomical muscle occupying area and the actual occupied area. We then obtained the value of each area and ratio (Figure 6). To quantify occupation ratio (%) and muscle area (mm2), we draw an outline of the estimated anatomical muscle occupying area and the actual occupied area to obtain values of each area (mm2) and ratio (%).
Because the boundary of supraspinatus was unclear in SOV, factors of FD were measured only with Method II. The occupation ratio in MA could not be measured either. All measurements are performed by two observers (Professor KC Noh and Professor JY Kim) blindly to increase the reliability of measurements.
Surgical technique: Arthroscopic rotator cuff repair
All procedures were performed with patients in the lateral decubitus position with sand bag under general anesthesia. Using posterior, anterior, lateral, posterolateral portal, systemic glenohumeral joint and subacromial exploration was performed and the rotator cuff tear was carefully evaluated. Tear sizes from anterior to posterior and from medial to lateral were measured using a probe, and numbers of involved tendons were documented. The footprint of the greater tuberosity was then debrided. Only a minimal layer (1∼2 mm) of the cortical bone was removed. Rotator cuff repair was performed to cover the original footprint using a suture bridge technique as allowed by tension. Suture anchors were inserted through the accessory portal. Number of anchors used depended on tear size. Usually, 2 to 4 anchors were used. First medial-row anchors (Iconix, Stryker, Mahwah, NJ, USA) were inserted to the lateral margin of the humeral head. Sutures were then threaded through the rotator cuff. Sutures were tied securely with the non-slide knot. The lateral row was secured using a lateral anchor (Reelx, Stryker, Mahwah, NJ, USA). When tear figure was simple, single-row repair was done using medial-row anchors. Acromioplasty was performed when subacromial bursitis was detected. If there was finding of biceps tendinitis on preoperative MRI, biceps tenotomy was performed. All patients had the same rehabilitation protocol using abduction sling for 6 weeks. Pendulum exercise was started at 1 week after surgery, followed by active assisted range of motion exercise for 6 weeks.
Clinical evaluation
Clinical evaluation was performed at 1 day before surgery and 1 year after surgery using the American Shoulder and Elbow surgeons (ASES) score and Constant score. 20
Statistical analysis
All statistical analyses for the reliability of MA and FD measurements between two observers of two trials were evaluated using interclass correlation coefficient (ICC > 0.8, excellent; ICC = 0.6-0.8, good; ICC = 0.4-0.6, fair; ICC < 0.4, poor) and Cronbach-α (>0.75, excellent; 0.4-0.75, fair to good; < 0.4, poor). Repeated measure analysis of variance (RM ANOVA) was used to compare changes in MA and FD between before surgery and after surgery. RM ANOVA or Friedman’s test (nonparametric method) was performed to analyze changes over time. All data were analyzed using Statistical Package for Social Science (SPSS) version 23.0 (IBM Corporation, Chicago, IL, USA) or SAS 9.4 (SAS Institute, Cary, NC, USA). p-values < 0.05 were considered statistically significant.
Results
Patient demographics.

In this study, the mean ICC value for measured MA and FD was 0.933 (>0.8, excellent) and the average Cronbach-α value was 0.963 (>0.75, excellent) (p < 0.0001).
Occupation ratio (%) at conventional Y-view increased from 0.59 ± 0.12 before surgery to 0.61 ± 0.14 at 3 days after surgery and 0.67 ± 0.14 at 1 year after surgery. However, these increases were not statistically significant (p > 0.05). Muscle area (mm2) showed no significant (p > 0.05) changes (396.03 ± 99.25 preoperatively, 389.77 ± 101.80 at 3 days postoperatively, and 365.54 ± 87.99 at 1 year postoperatively)
Evaluation of muscle atrophy.

By using Method I in conventional Y-view, the FI (%) was decreased significantly (p < 0.05) from 44.22 ± 12.32 preoperatively to 39.45 ± 11.84 at 3 days postoperatively and 35.41 ± 13.10 at 1 year postoperatively. Fat area (mm2) was also significantly (p < 0.05) decreased from 281.39 ± 81.96 preoperatively to 258.47 ± 92.38 at 3 days postoperatively and 202.83 ± 77.36 at 1 year postoperatively.
On the other hand, by using Method II, FI (%) showed no significant (p > 0.05) changes (7.71 ± 4.72 preoperatively, 11.03 ± 7.21 at 3 days after surgery and 10.57 ± 7.11 at 1 year after surgery). Fat area (mm2) showed no significant (p > 0.05) changes either (197.84 ± 66.96 preoperatively, 41.12 ± 27.51 at 3 days postoperatively and 36.48 ± 24.13 at 1 year postoperatively).
Evaluation of fatty degeneration.

Evaluation of the clinical outcome before surgery and at 1 year after surgery.

Correlation between clinical outcome and rotator cuff.

*Spearman’s correlation coefficient.
Discussion
In this study, FD was found to be significantly decreased when it was measured only in the conventional Y-view using Method I. When using Method 2 in both conventional Y-view and SOV, FD (especially the fat area) was decreased, although the decrease showed no significance. The muscle area (mm2) was also decreased, although the decrease showed no significance. MA and FD were not improved after ARCR.
Hamano et al 15 have reported that FI and MA of the supraspinatus can recover after an arthroscopic surgery. In their study, MA and FI of the supraspinatus were significantly improved at 2 years after surgery in compared to those at 2 weeks after surgery. They used occupation ratio for assessing MA and Goutallier classification for assessing FD. However, many studies have suggested that FD and MA are irreversible. Deniz et al 16 have assessed 102 patients after undergoing ARCR with MRI performed postoperatively for at least 2 years and reported that FD and MA do not show improvement even after a successful rotator cuff repair. Another study has reported that after a successful ARCR, there is a slight (11.3%–13.9%) increase in muscle volume from preoperatively to a minimal follow-up of 2 years. 14 These conflicting results might be due to different degrees of retraction depending on the tear size. The degree of retraction also depends on the position of the supraspinatus muscle. In addition, the method that can accurately reflecting this might be ambiguous. Because it is a sequence image rather than a continuous image, a minute error of 1–2 mm in the image may also affect results. It can be assumed that the degree of retraction also depends on the tear and repair technique of other tendons.
Most of previous studies performed MRI measures using various methods and criteria. The conventional Y-view and qualitative measurements prevailed. There are concerns about the measuring FI and MA in the conventional Y-view. Yoo et al 13 have reported that there is a considerable location discrepancy between the osseous origin of the supraspinatus at the suprascapular fossa and the conventional Y-view. The supraspinatus muscle medially retracts when a tear occurs. However, after ARCR, the supraspinatus muscle is laterally repaired. Therefore, FD and MA changes in Y-view are considered to be due to anatomical position changes, not due to the reversibility of fatty degeneration. For similar reasons, Jo et al 12 have suggested that MRI should be evaluated at specific time points after surgery. Therefore, we evaluated FD and MA in conventional Y-view and SOV. In consideration of the anatomical position change of the supraspinatus muscle due to surgery, it is possible to set the measurement value on the 3rd day after surgery, which reflects the anatomical position change due to surgery, as a new baseline. Therefore, MRI comparisons were made before surgery, at 3 days after surgery, and at 1 year after surgery.
In terms of anatomical change, in addition to MA and FD, the pennation angle can also be considered. Gerber et al. conducted a preliminary animal study on chronic rotator cuff tear that could restore normal muscle architecture, reduce MA and prevent progression of FI through prolonged elongation of the muscle. 21 There have been several reports regarding the pennation angle, and there is a report that it can be recovered through rotator cuff correction. 22 The change in pennation angle is considered as one of the consequences of retraction after rotator cuff tear. Further studies on the relationship between MA and FD and pennation angle in relation to muscle anatomical changes will be needed.
In our study, ASES and constant scores were significantly improved after surgery regardless of FD or MA changes. However, there was no correlation between clinical scores and FD/MA. Although many other studies have also shown clinical outcomes measured by ASES and Constant score, there are many opinions about the association of clinical outcomes with changes in FD/MA. Patients with poor preoperative scores tend to be selected mainly. Thus, preoperative and postoperative scores tend to increase as one of the objectives of an operation is functional recovery. In ARCR, procedures such as acromioplasty, synovectomy, and biceps tenotomy are performed. They are considered effective in improving clinical scores. In addition, it is difficult to find a clear correlation because there is a difference between a quantitative standard and the unit of the change of score or the change amount of FD and MA itself. We consider that the correlation between the improvement of the score and the degree of change of FI and MA should be discussed under the assumption that measurements of FD and MA are accurate. In the future, more sophisticated and standardized measurement techniques such as 3D MRI are needed than existing measurement tools.
This study has several limitations. First, patients with a rotator cuff tear size of only 2–4 cm were included, and most patients were grade 2 when classified by goutallier classification. (33 of 40) It would be better if the study was conducted in the future by including patients with a small or massive rotator cuff. Second, the follow-up period is as short as 1 year. Considering that there are comparative studies which have proven that the MA, and FD has some changes both qualitatively and quantitatively. Different results can be obtained if the mid- to long-term follow-up is carried out.
Conclusion
Quantitative MRI measurement of FD and MA was shown to be a reliable and valid method. MA and FD do not improve after ARCR considering postoperative anatomical change of supraspinatus at 1-year follow-up. MA showed no significant improvement. FD of supraspinatus in conventional Y-view showed a significant change at 1 year postoperatively. However, it showed no significant improvement in SOV. Muscle area (mm2) was decreased after surgery. However, the decrease showed no significance. Occupational ratio showed no significance. Clinical scores (ASES and Constant score) were significantly improved after surgery regardless of the FD and MA changes, but there was no correlation between improvement in clinical scores and changes in FD and MA.
Footnotes
Declaration of conflicting interests
The author(s) declared no potential conflicts of interest with respect to the research, authorship, and/or publication of this article.
Funding
The author(s) disclosed receipt of the following financial support for the research, authorship, and/or publication of this article: This study was supported by Hallym University research fund 2018 (HURF-2018-52).
Retrospectively registered study
This study was retrospective in nature, and final approval of informed consent exemption by the institutional review board was obtained (HKS 2018-06-025; Hallym University Kangnam Sacred Heart Hospital Institution Review Board)