
Abstract
Background
Infrapatellar fat pad (IPFP) is regarded as an essential knee tissue involved in osteoarthritis (OA) for its potential structural-related or metabolism-related function. This cross-sectional study aims to identify which part is more related to OA.
Methods
Patients with knee OA (n = 53) and healthy controls (n = 54) were prospectively recruited. Based on high-resolution magnetic resonance imaging with a slice thickness of only 0.35 mm, IPFP structural-related parameters (volume and maximal area), metabolism-related parameter (signal), degeneration indicators, and patellar maltracking indicators (patellar translation, patellofemoral angle, and Insall-Salvati ratio) were measured. IPFP volume (maximal area, and signal) was compared between healthy controls and OA patients. The level of significance for all comparisons was set as .05.
Results
OA patients had higher IPFP signal (672.9 ± 136.9 vs 567.3 ± 63.6, p = .009), but no significant difference in IPFP volume or maximal area compared with healthy controls. In healthy controls, IPFP signal was positively associated with age (β = 1.481; 95% CI: 0.286–2.676; p = .018); IPFP maximal area was positively related to Insall-Salvati ratio (β = 0.001; 95% CI: 0.0003–0.0017; p = .039), but not associated with patellar translation and patellofemoral angle. In OA patients, IPFP signal was positively associated with cartilage loss (β = 0.005; 95% CI: 0.003–0.007; p = .013); no correlation between knee pain and IPFP volume or maximal area was observed.
Conclusions
The metabolism-related function of IPFP, which can be reflected by the IPFP signal, might play a more critical role in OA progression than its structural function.
Background
Osteoarthritis (OA) is the most common joint disorder, affecting a large population and leading to poor life quality. 1 Some mechanics-related factors and metabolism-related factors are considered essential risks involved in OA pathogenesis. For example, being overweight is a known risk factor for OA. According to the American Academy of Orthopaedic Surgeons guideline, 2 weight loss is recommended for symptomatic knee OA patients with a body mass index (BMI) of more than 25 kg/m2. Besides, knee cartilage loss is positively associated with body fat but negatively related to lean mass, 3 indicating that fat tissues are involved in cartilage loss to induce OA progression subsequently. Moreover, overweight patients have a higher incidence of OA in weight-bearing joints such as knees and non-weight-bearing joints such as hands, 4 which further implies fat tissues play not only a mechanics-related role but also a metabolism-related role in OA. 5
As a local fat tissue, the infrapatellar fat pad (IPFP) lies underneath the patellar tendon, in the space between the femoral condyle and tibial plateau, in proximity to the articular cartilage surfaces and synovial layers. Recently, the function of IPFP in OA is known as structural-related and metabolism-related.6–10 The main structural-related functions of the IPFP include the distribution of mechanical load, 11 filling the extra space of joints, limiting overactivity of knees, 12 stabling the patella, 13 and promoting synovial fluid distribution. 14 Meanwhile, metabolism-related functions of IPFP include the releasing of paracrine inflammatory mediators, which reach the articular cartilage and aggravate cartilage degeneration,15,16 and secretion of proteins by mesenchymal stem cells from IPFP to lubricate and protect knees. 17
However, it remains controversial whether IPFP is OA protective or OA promotion, and whether it is more structural-related or more metabolism-related in the progression of OA. As a non-invasive technology, magnetic resonance imaging (MRI) was applied to investigate the function of IPFP in knee OA. Previous studies found that the increase of IPFP maximal area and volume had a protective effect on knee joints, and could delay the progression of OA; 6,8,9 In contrast, other studies found that the increase of IPFP volume could raise the risk of OA.18,19 Those studies’ contribution is limited due to a small number of subjects and non-excluding multiple confounding factors. To the best of the authors’ knowledge, a paucity of studies considered the IPFP signal intensity in OA,7,20 in which the non-quantitated signal was defined as discrete areas of increased signal within IPFP. Moreover, most of the MRI studies concerning the role of IPFP in OA only analyze IPFP in one aspect and use outdated MRI scanning with 1–3 mm slice thickness.6,21–25 In our study, we applied a high-resolution technique (with as little as a slice thickness of 0.35 mm and without inter-slice gap), calculated the IPFP maximal sagittal area and IPFP volume (relate to structural factors) and the quantitated signal intensity (relates to metabolism factors), compared the differences between healthy controls and OA patients, and analyze the relationship between IPFP and knee degeneration (or patellar maltracking) indicators to reveal which factor is more related to OA.
Materials and methods
Subjects
This study was registered at ClinicalTrials.gov as a cross-sectional study (Registration ID: NCT02829463) to compare the MRI differences between OA patients and healthy controls without specific interventions to the subjects. Patients with clinical knee OA, diagnosed using criteria of the American College of Rheumatology (pain in the knee, and three of the following: over 50 years of age, less than 30 min of morning stiffness, crepitus on active motion, bony tenderness, bony enlargement, no palpable warmth of synovium) 26 were consecutively recruited from the Third Xiangya Hospital of Central South University (diagnosed by authors JH and HB).
Subjects with contraindications to MRI were excluded. Candidates, as follows, were also excluded: those who had taken non-steroidal anti-inflammatory drugs or lipid-lowering agents (might influence IPFP metabolism), those who were with knee trauma or operation history, those who were with a musculoskeletal tumor near the knee, those who were with rheumatoid arthritis or other inflammatory diseases, or anyone with gout or hemophilic arthritis, or those who were with joint loose bodies.
Fifty-three patients with knee OA (53 knees) and 54 healthy controls (54 knees) were prospectively recruited. The study was approved by the Institutional Review Board of Third Xiangya Hospital, Central South University (Approval ID: 2016-S158), and written informed consents were obtained from all participants.
Anthropometrics
Demographic data, including sex, age, height, weight, and BMI of every participant, were recorded. According to the identity card information, sex was recorded as dichotomous data (female as 0, male as 1), and age was approximated to the nearest 1 year-old and then recorded. Height was measured to the nearest 0.1 cm (without shoes, socks, and headgear) using a stadiometer. Weight was measured to the nearest 0.1 kg (without shoes, socks, and bulky clothing) with a single pair of electronic scales (RGZ-120, Jiangsu Suhong Co, Ltd, Shanghai, China).
Magnetic resonance imaging assessments
Magnetic resonance imaging sequences
Scans of the 107 knees with flexion 15° were imaged using 3.0 Tesla MRI (PHILIPS Ingenia) with an 8-Channel dedicated knee coil. The following sequences were used: (1) 3D T1-weighted fast spin-echo, flip angle 90°, repetition time 400 ms, echo time 112 ms, a field of view 161 mm, 212 × 237 pixel matrix, a slice thickness of 0.68 mm to obtain 200 layers without inter-slice gap; acquisition time 4 min 58 s. (2) 3D Proton density-weighted fat-suppressed fast spin-echo images, flip angle 90°, repetition time 1,300 ms, echo time 36 ms, a field of view 160 mm, 280 × 267 pixel matrix, a slice thickness of 0.35 mm to obtain 350 layers without inter-slice gap; acquisition time 5 min 38 s.
Infrapatellar fat pad parameters
IPFP signal intensity, volume, and maximal sagittal area were measured independently. Intraobserver and interobserver reliabilities (conducted by senior orthopedic surgeons JH and HB trained by radiologist YL and LL) were assessed in 15 OA subjects and 15 healthy controls with the intraclass correlation coefficient of 0.937–0.994 and an interclass correlation coefficient within the range of 0.905–0.991, respectively (Supplementary Table 1).
IPFP volume and maximal sagittal area were measured by semiautomatic drawing contours (Figure 1(a)) around fat pad boundaries on section-by-section sagittal T1-weighted MR images, using the software MIMICS 16.0 (Materialism, Belgium). Reconstructed volume (mm3) was obtained as IPFP volume (Figure 1(b)); IPFP maximal sagittal area (mm2) could also be obtained through sections. IPFP parameters: maximal area and volume (a) maximal area of IPFP marked with yellow; (b) volume of IPFP marked with yellow and different view of the reconstruction IPFP. IPFP: infrapatellar fat pad.
IPFP signal intensity was assessed by 3D proton density-weighted MR images using Philips Dicom 3.0 (Philips, Holland), which could identify the average signal of a specific area. Mean signal intensity of sagittal layers was used.
Patellar maltracking indicators
Patellar maltracking indicators (patellar translation, patellofemoral angle, and Insall-Salvati ratio) were measured in 3D proton density-weighted MRI as previously described. 27 As OA patients with cartilage defects or osteophytes would influence patellar maltracking parameters, only healthy controls were noted with these parameters.
Patellar translation (PT) was measured at axial images and defined as the distance between the line at the anterior point of the medial femoral condyle and the level of the medial tip of the patella. PT of more than 2 mm laterally was considered an indicator of lateral patellar displacement (LPD). 27 Patellofemoral angle (PFA) was measured at axial images and defined as the angle formed by a line drawn along the bony lateral patellar facet and another line drawn tangential to the anterior aspect of the femoral condyles. PFA no more than zero (opens medially) was defined as a laterally tilted patella. 27 Insall-Salvati ratio (ISR) was measured at sagittal images and defined as the patellar tendon length at its inner side to the greatest diagonal length of the patella. ISR<0.8 was considered patella BaJa; meanwhile, ISR>1.3 was considered patella Alta. 27 The subjects were divided into PT normal/abnormal group, PFA normal/abnormal group, and ISR normal/abnormal group.
Knee whole-organ magnetic resonance imaging scoring
According to the Whole-Organ MRI Score (WORMS)
28
of the knee, cartilage loss, osteophytes, and subarticular marrow abnormality were evaluated in 15 different regions subdivided by anatomical landmarks (Figure 2). The patella was divided into the lateral facet (LP) and medial facet (MP). The femoral was divided into medial (MF) and lateral (LF) condyles, and each divided into three sub-regions: (1) anterior (a); (2) central (c); (3) posterior (p). The tibial plateau of the medial (MT) and lateral side (LT) were also each divided into three sub-regions. Based on these subdivisions, the patellar comprised regions MP and LP; the femoral included regions MFa, MFc, MFp, LFa, LFc, and LFp; the tibial comprised regions MTa, MTc, MTp, LTa, LTc, and LTp. The non-articulating portion of the tibial plateau beneath the tibial spines was designated region “S.” Different regions were subdivided by anatomical landmarks in MRI. (a) The lateral and medial facet of the patella based on the transverse plane; (b) coronal plane of the knee to mark the medial, lateral, and spinal regions; (c) sagittal plane of the knee to mark the anterior, central, and posterior regions.
Cartilage loss was scored in each of the 14 articular-surface regions (excluding region S) using 3D proton density-weighted fat-suppressed images. 0 = normal thickness and signal; 1 = normal thickness but increased signal; 2.0 = partial-thickness focal defect <1 cm in greatest width; 2.5 = full-thickness focal defect <1 cm in greatest width; 3.0 = multiple areas of partial-thickness (grade 2.0) defects intermixed with areas of normal thickness, or a grade 2.0 defect wider than 1 cm but <75% of the region; 4.0 = diffuse (no less than 75% of the region) partial-thickness loss; 5.0 = multiple areas of full-thickness loss (grade 2.5) or a grade 2.5 lesion wider than 1 cm but <75% of the region; 6.0 = diffuse (no less than 75% of the region) full-thickness loss. Subarticular bone marrow abnormality was graded from 0 to 3 based on the high signal regional involvement: 0 = none; 1 = less than 25%; 2 = 25–50%; 3 = more than 50%.
Osteophytes were graded from 0 to 7 using the following scale: 0 = none; 1 = equivocal; 2 = small; 3 = small-moderate; 4 = moderate; 5 = moderate-large; 6 = large; 7 = very large.
Joint effusion
Joint effusion was graded based on horizontal images from 0 to 3: 0 = normal; 1 = small distention in the synovial cavity; 2 = middle distention in the synovial cavity; 3 = large distention in the synovial cavity (Figure 3). Joint effusion. (a) normal; (b) small distention in the synovial cavity; (c) middle distention in the synovial cavity; (d) large distention in the synovial cavity.
Knee pain assessments
Knee pain (walking on a flat surface, going up/down stairs, at night in the bed, sitting/lying, and standing upright) was assessed by a self-administered questionnaire using the Western Ontario McMaster osteoarthritis index (WOMAC) with an 11-point scale from 0 (no pain) to 10 (most severe pain). Each component was summed to create a total pain (0-50) score. OA subjects were divided into no/mild pain group (any component no more than 3) and moderate/severe pain group. 29
Data analysis
Statistical analyses were evaluated using the IBM SPSS Statistics R23.0 (Chicago, IL). Values were expressed as Mean ± SD except for special notes. Participant characteristics were compared using chi-square analyses in categorical variables or unpaired t-test in continuous variables. IPFP volume (or maximal area, or signal intensity) was compared between healthy control and OA patients using independent sample t-test and multivariable linear regression analyses adjusted for age, sex, height, and weight. To minimize the effect of potential confounding on the participants’ direct comparison, a greedy nearest-neighbor algorithm 30 was employed to set a new cohort with no statistically significant differences in baseline characteristics (age, sex, weight, and height).
To estimate the number of samples, an a priori power analysis was performed using G*power v3.1 based on linear multiple regression t-tests, with a hypothesized effect size of 0.3, an α error of 0.05, and a power of 0.9, which resulted in a total sample size more than 38.
Spearman correlation analysis and multivariable linear regression analysis were applied to compare the association between IPFP volume (or maximal area, or signal) and participant characteristics in healthy controls or OA patients.
The association between IPFP maximal area (or volume, or signal) and patellar maltracking indicators were assessed by multivariable linear regression analyses adjusted for age, sex, height, and weight. Multivariable linear regression adjusted for age, sex, height, and weight were also used to compare IPFP maximal area (or volume, or signal) in PT normal/abnormal group, PFA normal/abnormal group, and ISR normal/abnormal group.
Ordinal Logistic regression analysis (adjusted for age, sex, height, and weight) and Spearman correlation analysis were applied to compare the association between IPFP volume (or maximal area, or signal) and pain (or cartilage loss, or subarticular bone marrow abnormality, or osteophytes, or joint effusion) in OA patients. IPFP volume (or maximal area, or signal intensity) was compared between no/mild pain and moderate/severe pain groups using independent sample t-test and multivariable linear regression analyses adjusted for age, sex, height, and weight. Multivariable linear regression results were described with coefficient β (95% Confidence Intervals (CI)) and accurate p-values. The level of significance for all comparisons was set as .05.
Results
Infrapatellar fat pad parameters and anthropometrics
In healthy controls, IPFP maximal area was positively associated with height, weight, and BMI; IPFP volume was positively associated with height and sex (larger IPFP in the male); IPFP signal was positively associated with age (β = 1.481; 95% CI: 0.286–2.676; p = .018). In OA patients, Both IPFP maximal area and volume were positively associated with height and sex (larger IPFP in the male); IPFP signal was significant associated with sex (higher signal in the male) (Supplementary Table 2). Overall, age, sex, height, and weight were considered as independent confounders for IPFP parameters; and would be adjusted when applying multivariable linear regressions later.
Infrapatellar fat pad parameters between osteoarthritis patients and healthy controls
IPFP parameters between OA patients and healthy controls.

Notes: #Independent sample t-test. ##Multivariable linear regression adjusted for age, sex, height, weight; IPFP volume (or maximal area, signal) as the dependent variable, with or without diagnosis of OA as the independent variable. Significant associations were marked in bold.
After matching, 21 OA patients and 21 healthy controls were selected as a new cohort. No age, sex, height, weight differences were found between the new groups. A higher signal was also found in the new OA group (642.2 ± 89.4 vs 589.7 ± 76.4, p = .040), but no differences were found in IPFP maximal area (621.1 ± 80.9 mm2 vs. 663.5 ± 90.7 mm2, n.s.), and volume (25409.2 ± 3920.0 mm3 vs 26808.2 ± 5930.0 mm3, n.s.) (Table 1). A post hoc power analysis was performed, which elucidated that an observed power of .93 was achieved with the current sample size of 42 after matching and an observed power of .99 before matching with a total sample size of 107.
Infrapatellar fat pad parameters and patellar maltracking indicators
Correlation between IPFP parameters and patellar maltracking indicators.
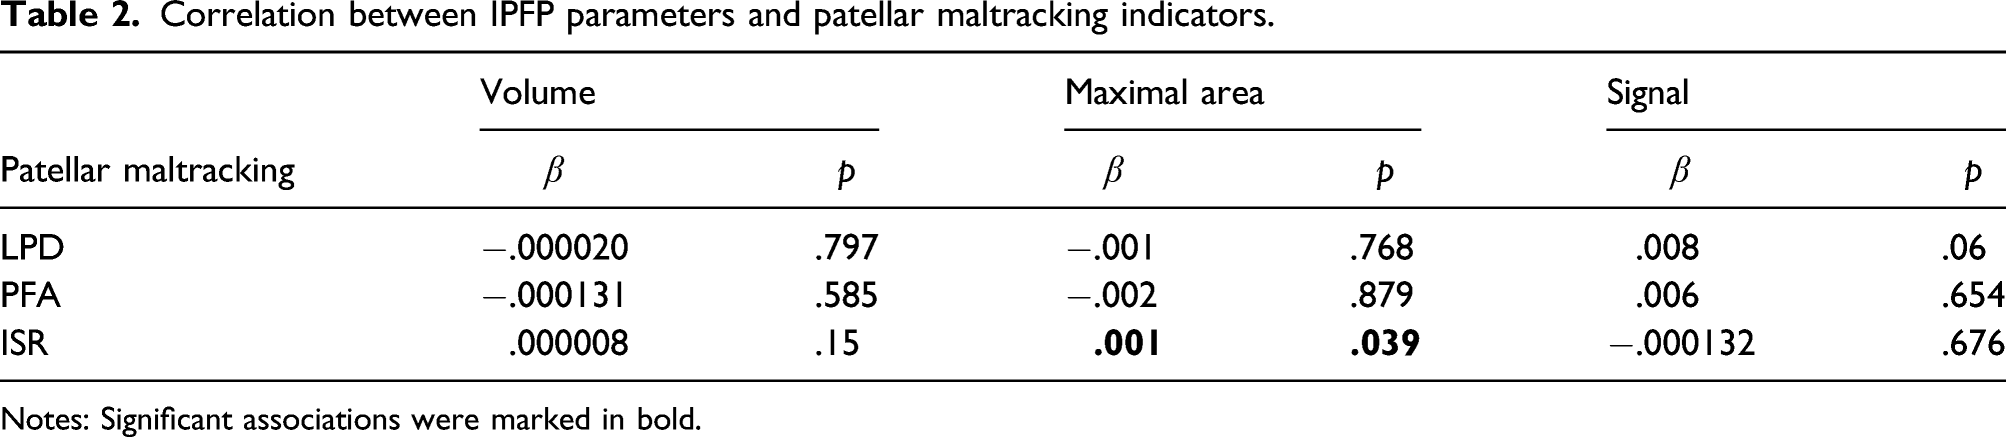
Notes: Significant associations were marked in bold.
Infrapatellar fat pad parameters and knee whole-organ scoring
Correlation between IPFP parameters and knee whole-organ scoring.

Notes: Significant associations were marked in bold.
Infrapatellar fat pad parameters and knee pain
Correlation between IPFP parameters and knee pain.

Notes: Significant associations were marked in bold.
Discussion
MRI parameters of different studies.

IPFP can be preserved even under extreme starvation conditions, 31 where the subcutaneous adipose tissue is burned off, and the volume of IPFP is positively associated with the fat-free mass of bodyweight, 25 but with no association to fat mass of body weight. 9 And IPFP volume was not increased after weight gain. 32 The present study found that OA patients did not have significant changes in IPFP maximal area and volume compared to healthy controls. It indicates that IPFP tissue is trying to maintain its position with stable volume and maximal sagittal area. In another concept, there were no significant differences between OA patients and healthy controls in IPFP structural-related parameters in MRI, indicating the structural influence of IPFP might not be necessary for the progression of OA.
However, IPFP’s structural role is still unclear and partially resected during total knee arthroplasty or arthroscopic surgery for a better surgical field. 33 A significant increase in IPFP pressure and less volume in the anterior knee compartment was found at knee flexion angles of <20° and >100°. 13 IPFP resection will lead to decreased tibial external rotation, an increase of patellar flexion, and a medialization of the patella. 34 Meanwhile, IPFP edema will influence the patellar maltracking,27,35–37 indicating the knee malalignment after the change of IPFP volume. In this study, IPFP maximal area showed a significantly positive association with ISR (Table 3). ISR is an index to reflect the vertical position of the patella, 38 and positively associated with patella Alta and reduced patellofemoral contact areas. In summary, IPFP maximal area might influence the patellar maltracking and knee alignment. Normal anatomy allows weight transfer to be balanced in a manner tolerated by biological tissue. A decision to rearrange a patient’s natural anatomy must be considered seriously, and IPFP precision should always be considered when total knee arthroplasty or arthroscopic surgery is being done.39,40 The previous study has shown that IPFP maximal area appeared to have a protective role for knee cartilage damage in older female adults; 6 and IPFP volume change was associated with cartilage degeneration. 41 In this study, IPFP maximal area and volume were negatively associated with cartilage loss, osteophytes, subarticular bone marrow abnormality, and joint effusion, which also indicated IPFP was OA protective.
Most studies on IPFP signal are based on proton density fat-suppressed spin-echo or T2-weighted imaging.27,42,43 Signal intensity in IPFP on unenhanced images does not always represent synovitis but is a nonspecific albeit sensitive finding. 44 However, IPFP of OA patients are found to present vascular neoformations, inflammatory infiltration, and severe fibrosis. 45 Meanwhile, Han et al. 7 found IPFP signal intensity alteration was associated with knee structural abnormalities and clinical symptoms cross-sectional and longitudinally in older adults, suggesting that IPFP signal may be an essential imaging biomarker. 46 In this study, quantitative higher IPFP signal intensity with high-resolution MRI in OA patients compared to healthy controls was found, also indicating signal as an imaging biomarker in knee OA. IPFP could interact with synovium, cartilage, and subchondral bone through IL-6, leptin, Wnt signaling pathway, et al. 47 The inflammation or fibrosis results of the interaction would be shown in MRI with a signal variation. IPFP signal was also positively associated with cartilage loss in our study. A previous study by Wang et al. revealed that IPFP signal intensity alteration predicted knee arthroplasty within 5 years. 48 However, in our research, the IPFP signal was negatively associated with subarticular bone marrow abnormality. This controversial result might be the reason for the relatively low prevalence of subarticular bone marrow abnormality compared to cartilage loss (98 vs 47%) 28 in OA imaging, and IPFP edema and subarticular bone marrow edema would appear in different OA phase, 49 and this study only captured a one-time point.
Pain is the chief complaint for OA patients to see doctors. No association was observed between IPFP maximal area (or volume) and knee pain, either by our current study or the study of Steidle-Kloc et al. 50 This work provides no evidence of that the amount of IPFP tissue is related to patient-reported pain. The findings do not encourage surgical or dietary attempts to reduce IPFP volume for beneficially modifying knee symptoms, whereas the IPFP signal change might be effective in OA treatment. In this study, IPFP signal was negatively associated with total knee pain, sitting pain, and standing upright pain. However, pain assessment is complex and painful, and inherent to each patient with different sex, social background, and psychological factors, among others. 39 Hence, the negative association between IPFP signal and patient-reported pain in the present study should be interpreted carefully. IPFP contains rich nerve fibers with substance-P, 51 from the tibial nerve’s posterior branch. However, several other joint tissues 52 are involved in developing OA pain, including the synovium, capsule, meniscus, even the degenerated cartilage. 53 Han et al. 54 reported that hypointense signals in the IPFP were associated with knee pain, suggesting the abnormality signal in IPFP had a potentially important role in OA pain.
The main strength of this cross-sectional study is that we compared healthy controls and OA patients with structural-related index and metabolism-related index through a high-resolution 3.0 T MRI technique. Most studies applied 1.5 T MRI and 1–3 mm thickness scanning slice, which might reconstruct a rough IPFP, whereas we applied with as little as a slice thickness of 0.35 mm and without an inter-slice gap. However, this study has its potential limitations. First, a cross-sectional study could not speculate on causal relationships, and the modest sample size, which might hinder the ability to rule out the actual association between parameters. Second, the characteristics of groups are significantly different in age and height, which might reduce the comparability and produce bias as confounders. Thus, multivariable linear regression was applied to minimize the confounding in this study; and a greedy nearest-neighbor algorithm 30 was employed to set a new cohort with no statistically significant differences in baseline characteristics (age, sex, weight, and height). However, some other potential confounders, such as activity levels or forgotten history of IPFP trauma, could also influence the outcomes; more accurate randomized controlled trials should be processed in the future.
In conclusion, the IPFP maximal area was significantly positively associated with ISR, which might influence the patellofemoral joint alignment. Meanwhile, more significantly different was found between OA patients and healthy controls in IPFP metabolism-related role (signal in MRI), than structural-related role (IPFP maximal area and volume have no difference). More studies should be carried out to further study the signal intensity alteration (vascular neoformations, inflammatory infiltration, and fibrosis) in IPFP during OA progression.
Supplemental Material
Supplemental Material - Increased signal intensity, not volume variation of infrapatellar fat pad in knee osteoarthritis: A cross-sectional study based on high-resolution magnetic resonance imaging
Supplemental material for Increased signal intensity, not volume variation of infrapatellar fat pad in knee osteoarthritis: A cross-sectional study based on high-resolution magnetic resonance imaging by Jinshen He, Hongliang Ba, Jing Feng, Cheng Peng, Yunjie Liao, Lifeng Li, Xu Cao, Zili Wang, Minren Shen and Song Wu in Journal of Orthopaedic Surgery
Footnotes
Author contributions
JH, HB, and JF: study design, data acquisition, data analysis and interpretation, manuscript preparation and approval
ZW, XC, CP, YL, and LL: data acquisition, manuscript preparation, and approval
MS and SW: funding acquisition, study design, data analysis and interpretation, manuscript preparation, and approval.
Declaration of conflicting interests
The author(s) declared no potential conflicts of interest with respect to the research, authorship, and/or publication of this article.
Funding
The author(s) disclosed receipt of the following financial support for the research, authorship, and/or publication of this article: This work was supported by the National Natural Science Foundation of China (No. 81802208) funds this study.
Availability of data and materials
All data generated or analyzed during this study are included in this published article.
Supplemental Material
Supplemental material for this article is available online.
References
Supplementary Material
Please find the following supplemental material available below.
For Open Access articles published under a Creative Commons License, all supplemental material carries the same license as the article it is associated with.
For non-Open Access articles published, all supplemental material carries a non-exclusive license, and permission requests for re-use of supplemental material or any part of supplemental material shall be sent directly to the copyright owner as specified in the copyright notice associated with the article.