
Abstract
This study utilises data from the Agriculture Census for 1990–1991, 2005–2006 and 2015–2016, employing the Herfindahl-Hirschman Index (HHI) to assess crop diversification in Indian states. The overall HHI declined from 1990–1991 to 2015–2016, indicating increased crop diversification nationally. However, the proportion of states exceeding the overall average HHI significantly decreased, indicating a shift towards specialisation or monoculture in some states. The analysis notes a decrease in the gross cropped area (GCA) under total food crops (TFC) and an increase in total non-food crops (TNFC). Despite the overall decline in TFC, high-value crops like horticultural produce, sugar crops, spices, and condiments have seen improvement. Focusing on the Eastern region (ER) and the Northeastern region (NER), the study reveals diversification in NER due to higher allocation of land to high-value crops, while economically disadvantaged states in the ER, such as Bihar and Odisha, show a trend towards crop specialisation, potentially affecting overall food security in the region. The study emphasises the need for government support to address persistent vulnerabilities in poverty, unemployment, and low yields in cereals, pulses, and oilseeds in these regions, recommending inputs, infrastructure development, insurance, and market linkages for perishable items to enhance food security.
Introduction
Crop diversification in developing countries, particularly in India, is a practice with immense potential. It is a key strategy that can significantly impact economic and social development. This shift from traditional staple crops to high-value crops is driven by the increasing demand for nutritious food and the implementation of policy reforms. The changing preference for nutritious foods such as fruits, vegetables, milk, meat, and fish is rapidly increasing in domestic and international markets, necessitating agricultural diversification. The Green Revolution’s focus on primary staple crops for food security overlooked the potential of high-value crops, hindering farmers’ income, employment prospects, and environmental sustainability. However, post-reform agricultural policies emphasise crop diversification to counter economic, social, and ecological degradation caused by the dominance of paddy-wheat cultivation. High-value crops, with their better financial returns, play a crucial role in this and can help address these challenges, providing a ray of hope for the economic and social development of Indian agriculture. The potential benefits of crop diversification are significant, as it meets the changing food demand and enhances farmers’ income, employment prospects, and environmental sustainability. Although the demand for cereals seems manageable in India, economic growth, per capita income, and rapid urbanisation hasten the need for high-value crops and pose significant challenges.
Crop diversification, the cultivation of a broader range of crops within a specific area, is a crucial strategy in Indian agriculture. It signifies a shift from cultivating traditionally grown, less economically remunerative crops to high-value crops offering better financial returns. This strategic shift aims to enhance agricultural productivity and economic sustainability. Therefore, a comprehensive understanding of current agricultural trends, particularly in crop diversification, is not just important but essential for ensuring food and nutrition security, poverty alleviation, and effective policy formulation. This understanding is even more critical in agrarian countries like India, where a significant proportion of the population resides in rural areas and relies on agriculture and allied activities for livelihoods. In particular, the Eastern region (ER) and the Northeastern region (NER), which are dominated by smallholder farmers, lag behind the rest of India regarding economic and social development. Diversification through high-value crops could be one of the several ways of agricultural and economic development in this region. However, cultivating high-value crops is often labour-intensive, requiring substantial capital, advanced technology, high-quality inputs, and proper management and farm services. The lack of agricultural public support poses significant challenges to smallholders’ access to farm services (Birthal et al., 2007; Jha et al., 2009). Furthermore, agriculture in India is regionally imbalanced due to agroecological conditions and policy support. Therefore, a thorough understanding of current agricultural trends, particularly in crop diversification, is crucial for ensuring food and nutrition security, poverty alleviation, and effective policy formulation, especially in economically disadvantaged regions like ER and NER India.
Eastern and Northeastern States
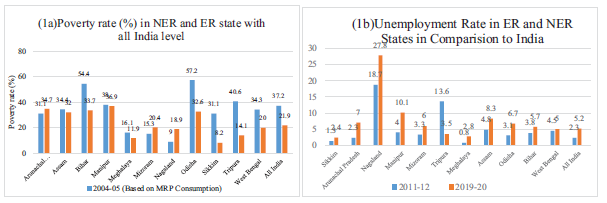
The transformative impact of the Green Revolution on Indian agriculture has been regionally imbalanced, with ER and NER states significantly trailing behind. A substantial proportion of these states in both regions continue to grapple with elevated poverty rates, surpassing the national average (Figure 1a). Unemployment is another pressing concern for these regions. Rise in unemployment rates have been registered across selected NER and ER states (Figure 1b). Most of the NER and ER states exhibited higher unemployment rates than the national average during 2011–2012 and 2019–2020. In addition, agricultural development in the ER and NER regions, particularly yield rates, lags significantly behind the national average. The most recent data (as shown in Table 1) for the 2017–2018 season illustrates the dismal state of cereals, pulses, and oilseeds yield rates in this region. Compared to the national average, the yield rates for cereals, pulses, and oilseeds are consistently lower. Among the 11 selected states in this region, eight states fail to meet the national average yield, indicating a widespread agricultural deficiency. The situation is particularly dire for oilseeds, where all states in the region fall below the national average yield.
The State-wise Yield of Cereals, Pulses, and Oilseeds (Kg/ha.) for 2017–2018.
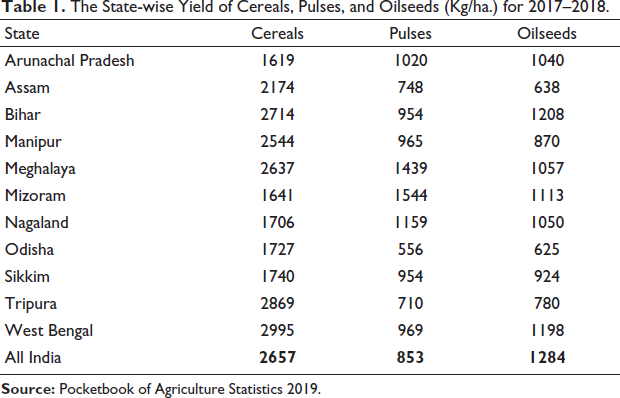
While pulses’ performance is relatively better, with only three states having a lower yield rate than the national average, overall agricultural productivity in NER and ER states remains poor. This study underscores the need for special attention and intervention when considering the region’s poor performance in poverty alleviation, unemployment, and agricultural yield. These factors encourage us to give special attention to this region in the article.
Agriculture Diversification in India
Indian agriculture has witnessed several phases of short-run growth and long periods of stagnation since independence. The Green Revolution of the 1960s transformed India into a self-sufficient country from a position of growth stagnation and food deficiency (Pingali et al., 2019; Ramakumar, 2022). Agriculture in India has passed through four major phases. The first is the pre-Green Revolution, which emphasised expanding areas under agriculture using traditional methods. The Green Revolution era changed agriculture by adapting new technology, high-yielding seeds, and the use of inputs. The post-green revolution phase focused on infrastructural and management issues and linkages in markets, trade, and institution building. The final stage involves liberalisation and withdrawal of public expenditure from agriculture and encouraging the private sector.
Over the past decades, agriculture area, production, and cropping patterns have changed remarkably in India. Although the success of agriculture growth during the Green Revolution has been regionally imbalanced, the overall cropping pattern is significantly shifting towards high-value crops and commodities, transitioning from traditional subsistence cropping to commercial agriculture. Several studies have highlighted this shift, demonstrating a move from food to non-food crops over the years (Banu & Sheereen, 2015).
While some states like Bihar, Jharkhand, Odisha and West Bengal have witnessed a gradual shift towards high-value crops (Kumar et al., 2012), others such as Himachal Pradesh have seen a transition from cereals to high-value crops, particularly vegetables, although with a decline in oilseeds and pulses (Devi & Prasher, 2018). The trend of diversification has been driven by various factors, including market liberalisation, post-WTO dynamics, and increased agricultural output following economic reforms (Bhalla & Singh, 2009; De Roy, 2017; Thamarajakshi, 1999). In some states like Punjab, the government has encouraged private sector participation through contract farming to promote diversification (Sharma & Singh, 2013; Singh, 2000, 2004, 2005). Diversification has also been influenced by the availability of family labour, with labour-intensive crops like fruits and vegetables becoming prevalent (Birthal et al., 2006). Additionally, studies have indicated that diversification has led to cultivating livestock and fishery alongside high-value crops (Chand et al., 2016).
At the state level, the growth and transformation in agriculture have been highly inequitable (Pingali et al., 2019). Moreover, smallholder farmers, who comprise most of the farming community, face challenges in this transformation. Issues such as limited access to infrastructure, including roads and cold storage facilities, and a lack of functionalised markets for perishable or semi-perishable crops hinder their ability to shift towards high-value crops (Chhatre et al., 2016). Despite government emphasis on agriculture diversification to enhance nutrition security, farmers’ income, and environmental sustainability, there is a need for improved infrastructure development and increased public support for farm services, especially for smallholders. Closed observation of recent agriculture policy and market reforms suggests that the government has focused on centralising policies (Farm Bills 2020, e-NAM, Contract farming) designed to liberalise and deregulate the agriculture markets, which has received criticism from different stakeholders. Agriculture diversification has also been emphasised through specific initiatives 1 primarily for high-value crops such as fruits and vegetables.
Previous studies have primarily examined crop patterns at the national or state level, lacking detailed information on emerging crop groups or crops responsible for diversification at the state level. Recognising this gap, the current article aims to calculate the crop diversification of India at the state level after reforms. By considering regional patterns and identifying emerging crops, the article emphasises the importance of making crop-specific implications in policy measures to promote further and sustain agricultural diversification. This article aims to understand the trends and recent patterns of crop diversification, considering it a potential means to improve food and nutrition security, income, and employment opportunities, especially for smallholders in India. The focus is on identifying specific crop groups and leading crops in diversification or specialisation at the state level. Particular emphasis is placed on India’s eastern and northeastern states.
Data and Methods
The data utilised in this study regarding the gross cropped area (GCA) of various crops were sourced from the Agriculture Census Report spanning 1990–1991, 2005–2006 and 2015–2016. The Agriculture Census is the principal reservoir of information encompassing various agricultural parameters, meticulously detailing the number and extent of operational holdings, their dimensions, distribution according to size, land usage, tenancy patterns, and cropping preferences, among other vital metrics. Substantial agricultural data is obtained through a nationwide agricultural census every five years, supplemented by a corresponding survey focused on agricultural holdings. The agricultural census data proved to be the most suitable and rigorous data source for the current study, endeavouring to explore crop diversification at state and union territory (UT) levels. We have applied this dataset to measure the extent of diversification within the agricultural landscape.
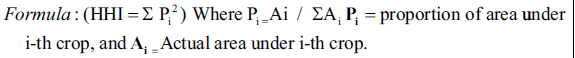
The Herfindahl-Hirschman Index (HHI) is one of the most cited methods that measure the extent of crop diversification applied by many scholars (see, e.g., Auffhammer & Carleton, 2018; Bharati et al., 2015; Chen et al., 2018; Dakpo et al., 2019; Devi & Prasher, 2018; Gebeltová et al., 2020; Kumar et al., 2012; Kurdyś-Kujawska et al., 2021; Madhumitha et al., 2021; Mulwa & Visser, 2020; Singh et al., 2020; Tisdell et al., 2019). We use the same method to extract crop diversification for the present article. This index solely quantifies the extent of diversification without delving into its specifics or trends. The HHI index ranges from zero (indicating complete diversification) to 1 (representing complete specialisation). A value nearing ‘1’ signifies a highly specialised agricultural focus, while a value nearing ‘0’ indicates significant diversification. States falling within the diversified category possess a balanced distribution of GCA among various crops. Conversely, states falling under specialisation denote a predominant practice of mono-crop cultivation.
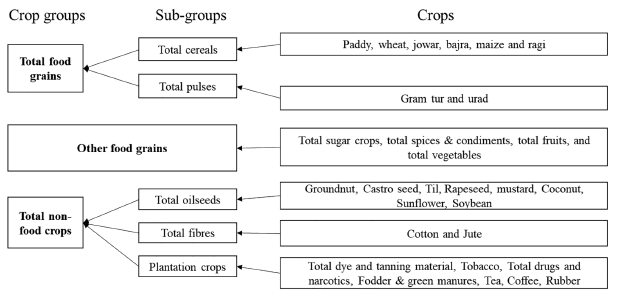
Traditionally, studies exploring the relationship between crop diversification and nutrition primarily focus on food crops. However, our analysis incorporates both food and non-food crops. This approach is essential because nutrition is directly linked to the quality of food consumption. However, income also significantly influences access and affordability of food. Non-food crops, often called cash crops, provide farmers with better financial returns. Hence, we comprehensively considered both food and non-food crops in our estimation. We categorised crops into three groups: total food grains (TFG), other food grains (OFG), and total non-food crops (TNFC) to measure crop diversification (See Figure 2).
Types of Crops Categories and Crops.
Results and Discussion
Level of Crop Diversification and Pattern 1990–2016
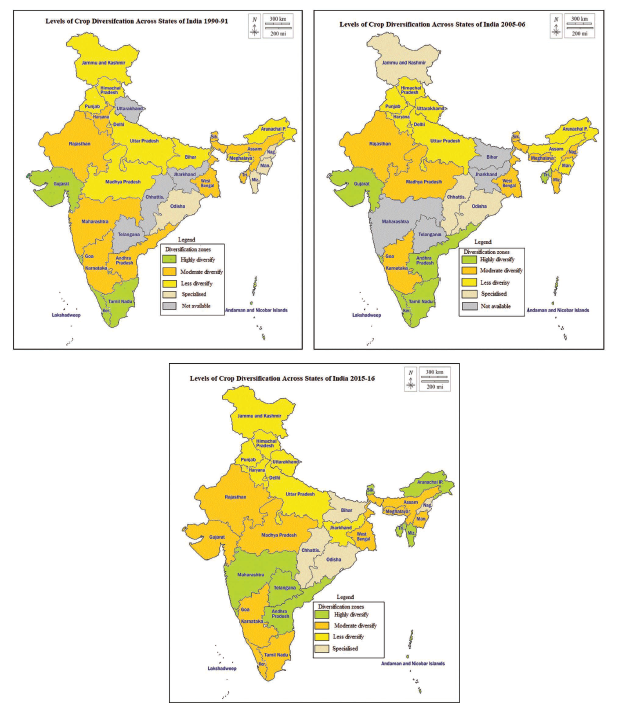
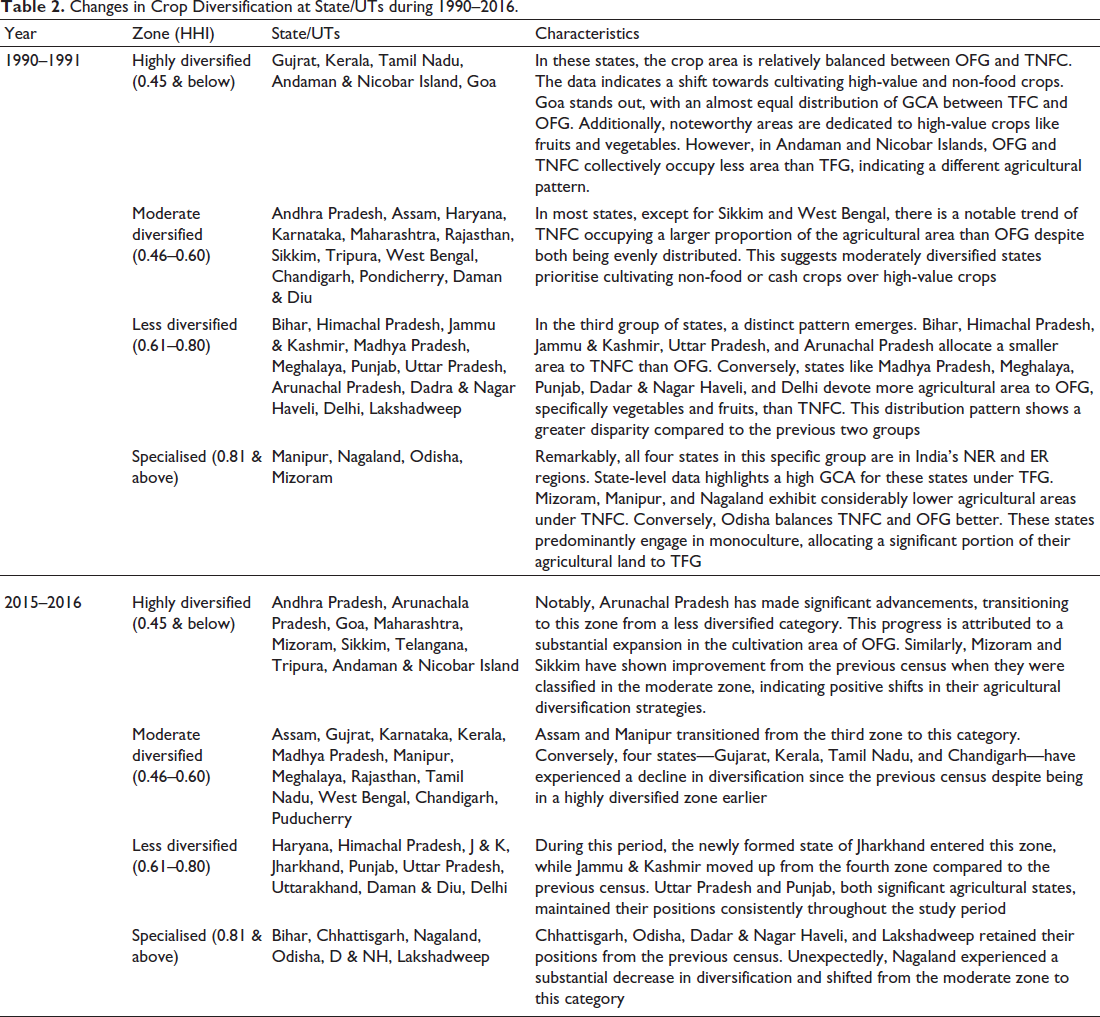
We divide the diversification value into four groups based on the equal interval (Table A1). The result shows a state-level diversification transformation during the study period (Figure 3). The regional pattern shows considerable changes across states, where some states shifted towards diversification and specialisation (Table 2).
Changes in Crop Diversification at State/UTs during 1990–2016.
The HHI value presents the concentration of crops in a state or country. A high HHI value indicates either a concentrated crop production or a more evenly distributed share of different crop groups. States in the specialisation zone predominantly practice monocropping or have larger areas dedicated to specific crops. Figure 3 visually depicts the spatial shifts in crop diversification across India from 1990 to 2016. The data reveals a polarisation among states concerning crop diversification: some states are moving towards diversification, while others are transitioning into specialisation zones (Figure 4). Table 2 elaborates on state diversification values and the nature of GCA for various crop groups. The national average HHI decreased from 0.63 in 1990–1991 to 0.52 in 2015–2016 (as shown in Table A1), indicating enhanced diversification and shifting from monocropping or uneven distribution to multi-cropping or equal distribution. This improvement does not guarantee a shift from food to high-value crops (OFG or NFC). The prevalence of food crops in Indian agriculture and the declining HHI values at the national level collectively suggest a shift from food grain cultivation.
Share of State/UTs Under each Diversification Zone (%).
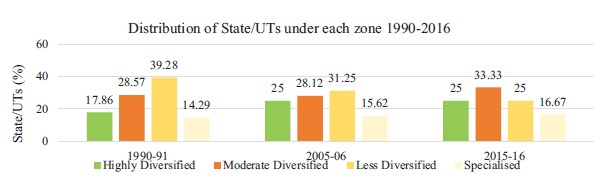
Figure 4 illustrates the percentage of states in different diversification zones over three periods, indicating a national trend towards increased diversification from 1990 to 2016. The proportion of states categorised as highly diversified, moderately diversified, and specialised increased. In contrast, the percentage of states in the less diversified zone decreased, signifying a shift towards diversification at the national level. However, at the state level, there were both movements towards diversification and specialisation. Notably, states in the NER and Eastern ER regions outperformed the rest of the nation in diversification, with the number of highly and moderately diversified states increasing from four to eight between the 1990–1991 and 2015–2016 census periods (refer to Table A1). This observation raised two vital questions. First, which specific crops drive specialisation and diversification trends? Second, what key crops contribute to the significant diversification changes in NER and ER states? So, in the impending discussion, we focus on identifying crop groups and leading crops in states responsible for the diversification, followed by a particular focus on the NER and ER region states.
Emerging Crop Groups and Crops in Diversification
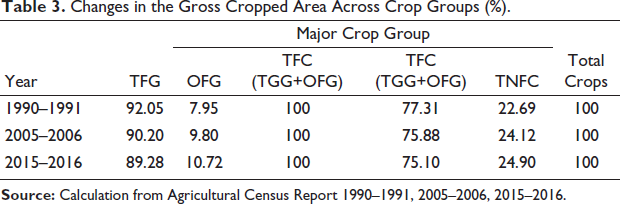
In the context of agricultural practices in India, there has been a notable shift towards crop diversification; however, certain states have either exhibited minimal changes or transitioned towards specialisation. This section examines specific crop groups and individual crops that have experienced more share gain in the GCA during the study period. As illustrated in Table 3, at the national level, the GCA percentage for total food crops (TFC) has decreased from 77.31% to 75.10% throughout the study period. Despite this decline in the GCA share dedicated to TFC, there is a concurrent increase in the GCA under OFG. Concurrently, there is a growing GCA for TNFC from 22.69% to 24.90% during the same timeframe. These alterations indicate a nationwide agricultural shift towards high-value and commercial crops, signifying crop diversification trends.
Changes in the Gross Cropped Area Across Crop Groups (%).
Due to the unavailability of GCA data for individual crops at the state level for all states in the 1990–1991 period, we analyse the changes between 2005–06 and 2015–2016 instead. Considering the changes at the national level in OFG and TNFC, as shown in Table 3, our focus has narrowed to these specific crop groups, indicating diversification or specialisation trends. Consequently, we identify the top five states that experienced the most significant gains or losses in the area dedicated to OFG and TNFC, as detailed in Table 4.
Changes in Gross Cropped Area Under State (2005–2006 to 2015–2016).
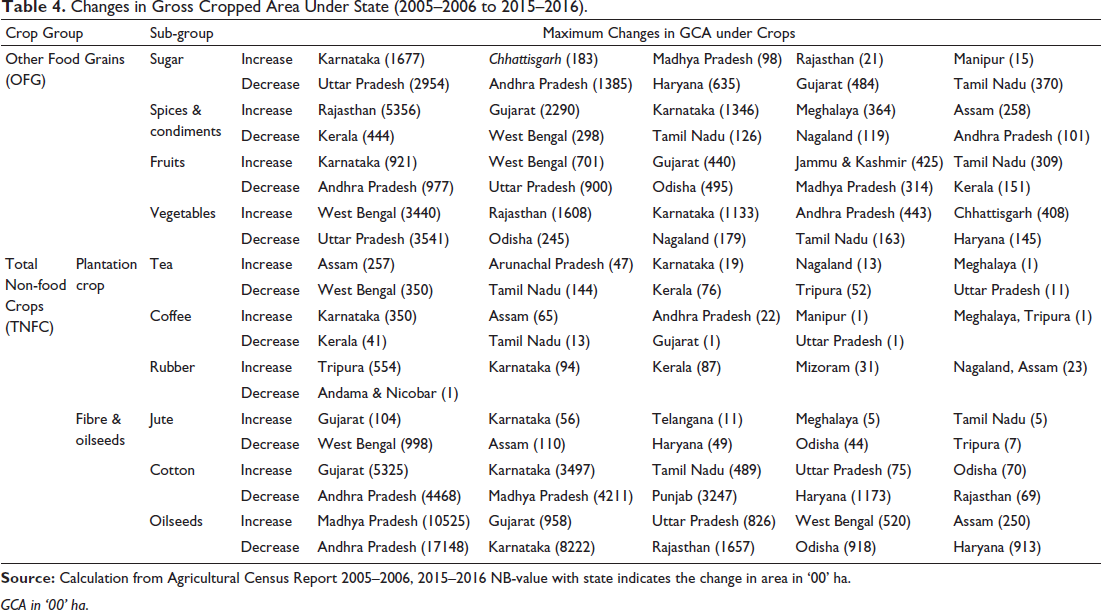
GCA in ‘00’ ha.
Other Food Grains
Four distinct sub-crop groups, namely total sugar, total spices and condiments, total fruits, and total vegetables fall under the category of OFG. While the national GCA for OFG has experienced a noticeable increase, this trend is not uniform across all four sub-groups. At the national level, the GCA for total sugar has decreased among these sub-groups. In contrast, the other three categories have shown an increase. Despite the overall rise in GCA under OFG at the national level, this phenomenon is inconsistent across all states. Furthermore, if a particular crop witnesses a reduction in its GCA share, this change is not uniformly observed across all states.
The decline in GCA for total sugar shows notable reductions in states such as Uttar Pradesh, Andhra Pradesh, Haryana, Gujarat, and Tamil Nadu. Conversely, despite the national decline in GCA for total sugar, states like Karnataka, Chhattisgarh, Madhya Pradesh, Rajasthan, and Manipur have experienced an increase. Regarding spices and condiments, which saw an increase nationally, significant contributions come from states like Rajasthan, Gujarat, Karnataka, Meghalaya, and Assam. Conversely, GCA for spices & condiments has notably decreased in Kerala, West Bengal, Tamil Nadu, Nagaland, and Andhra Pradesh.
The GCA for fruits has increased nationally, reflecting diversification efforts, with prominent contributions from states like Karnataka, West Bengal, Gujarat, Jammu & Kashmir, and Tamil Nadu. However, despite the national increase, states such as Andhra Pradesh, Uttar Pradesh, Odisha, and Kerala have declined. Similarly, the sub-crop group of vegetables has seen a national increase, leading to diversification. West Bengal, Rajasthan, Karnataka, Andhra Pradesh, and Chhattisgarh have gained the most in GCA. In contrast, GCA for vegetables has decreased in Uttar Pradesh, Odisha, Nagaland, Tamil Nadu, and Haryana during the same period.
Total Non-food Crops
The TNFC category comprises two sub-groups, namely plantation crops and fibres and oilseeds, each consisting of specific crops. The GCA for plantation crops has shown an increase. The GCA for fibres has also risen nationally, with a decline noted specifically in jute cultivation while cotton cultivation has increased. Similarly, the GCA for oilseeds has experienced a slight national rise. Consequently, at the national level, diversification within TNFC has been primarily influenced by the growth in plantation crops (excluding tea), oilseeds, and fibres (excluding jute).
Plantation Crops
In the case of plantation crops, a nationwide increase has been observed. While the GCA for plantation crops, including rubber and coffee, has risen, it has declined for tea cultivation. Assam, Arunachal Pradesh, Karnataka, Nagaland, and Meghalaya have experienced gains in tea cultivation. In contrast, West Bengal, Tamil Nadu, Kerala, Tripura, and Uttar Pradesh have witnessed declines. Coffee cultivation has flourished in states like Karnataka, Assam, Andhra Pradesh, Manipur, Meghalaya, and Tripura. At the same time, Kerala, Tamil Nadu, Gujarat, and Uttar Pradesh have seen reductions. Rubber cultivation has increased nationally, with declines noted only in Andaman and Nicobar Island. Tripura, Karnataka, Kerala, Mizoram, Nagaland, and Assam have significantly contributed to the national increase in rubber cultivation.
Fibres and Oilseeds
In the fibres group, jute cultivation has declined, while cotton cultivation has expanded nationally. Despite the decline in jute cultivation, states like Gujarat, Karnataka, Telangana, Meghalaya, and Tamil Nadu have managed to maintain their cultivation. On the other hand, West Bengal, Assam, Haryana, Odisha, and Tripura have witnessed substantial declines in jute cultivation. Cotton cultivation has notably increased in Gujarat, Karnataka, Tamil Nadu, Uttar Pradesh, and Odisha, while Andhra Pradesh, Madhya Pradesh, Punjab, Haryana, and Rajasthan have experienced reductions.
The OFG and TNFC have significantly contributed to diversification at the national level. This section outlines the five leading states that have experienced the most substantial diversification and the highest declines under these two crop groups. This evidence sheds light on India’s evolving crop preferences and choices between 2005 and 2016, offering insights into the nature of cropping patterns and performance in diversification or specialisation among leading states. Table 4 illustrates West Bengal’s shift in cultivation areas, with significant gains in vegetables, the most substantial increase at the national level. Conversely, cultivation areas for spices, condiments, tea, and jute have experienced the most significant declines. This transformation highlights West Bengal’s focus on high-value crops like vegetables and fruits, underscoring the need for enhanced infrastructure due to the perishable nature of these items. Policymakers should consider these evolving crop patterns while formulating crop-specific policy frameworks at the state level.
Implication of Crop Diversification for NER and ER States
Our analysis reveals three significant trends during the study period. Notably, all NER states, except Assam, have undergone substantial shifts towards diversification in their agricultural practices. Conversely, Assam and West Bengal have exhibited relatively minor movements towards diversification over the same period. In contrast, other ER states, namely Bihar and Odisha, have experienced a shift towards specialisation. The changes directly influence the movement to diversify levels in the GCA of various crops. Most NER and ER states have transitioned their cropping patterns from TFG to OFG and TNFG, except for Nagaland, Odisha, and Bihar. Nagaland has significantly expanded GCA under TFG, followed by Bihar and Odisha. Notably, OFG has been pivotal in driving this shift in cultivation patterns across these states from 2005–2006 to 2015–2016. This transformation underscores the substantial diversification witnessed in the NER and ER regions, primarily attributed to the cultivation of OFG. We have identified specific crops responsible for specialisation and diversification in each state within this region (detailed in Table A2). The following discussion highlights the major crops for each state.
Arunachal Pradesh: The state has shifted its cropping pattern towards OFG. The decrease in the share of TFG and increase in OFG have resulted in a significant increase in vegetable cultivation, followed by spices & condiments, and fruits. From 2005–2006 to 2015–2016, GCA under TFG declined from 81.13% to 53.13%. Assam: The state predominantly cultivates TFG with limited diversification. Growth in vegetable, spices & condiments, and fruit cultivation contributes to diversification. We observed that GCA for vegetables (32000 ha.), total spices & condiments (25800 ha.), and fruits (24300 ha.) had the most significant gain. Manipur: The state transitioned from TFG dominance to OFG and TNFG. During this period, OFG has increased by more than 50%, owing primarily to the increased share of vegetables (17900 ha.) and total spices & condiments (3800 ha.), followed by total sugar (1500 ha.) and fruits (1200 ha.). Meghalaya: OFG Surpassing TFG, we observed a shift from TFG to OFG, particularly spices & condiments, fruits, and vegetables. Pulses, other cereals under TFG, and oilseeds in TNFG contribute to diversification. It is fair to say that total spices & condiments and fruit cultivation have significantly contributed to steady diversification. Mizoram: The state scored the best in crop diversification (HHI 0.36) in 2015–2016. Its transition from a highly mono-crop TFG cultivate state to dominance in OFG and TNFC has resulted in its diversification parameter. Significant cultivation of spices and condiments, fruits, and vegetables drives diversification. Nagaland: Nagaland continues to be dominated by TFG with limited diversification. The state dominated under the area of TFG (89.33%) is the third-highest among the selected NER and ER states after Bihar (95.60%) and Odisha (94.30%). Increase in other cereals and paddy cultivation, decline in pulses and oilseeds. Between 2005–2006 and 2015–2016, the GCA of spices & condiments (11900 ha.) and vegetables decreased (17900 ha.). Tripura: The state maintains balanced diversification with significant TFG, OFG, and TNFG shares. The share of OFG shows a slight decline, but GCA for fruits (252), vegetables (71), and total spices and condiments (1300) have expanded. With the most significant share by TNFG, GCA further improved most by rubber (55400 ha.) and oilseeds (8700 ha.) and declined in tea (5200 ha.) and jute (700 ha.). Sikkim: The state witnessed the transition from TFG to OFG, focusing on fruits and vegetables. This state has the second-largest share of OFG (44.05%) after Meghalaya (48.56%). The state has significantly changed its cropping pattern from TFG toward OFG. Fruits and vegetables contribute significantly to diversification. Odisha: Odisha is heavily dominated by TFG with limited diversification. Decreased cultivation of fruits, vegetables, sugar crops, and spices & condiments led to limited diversification. Odisha is one of the states that has not only lagged the national average in HHI over the study period, but the gap has widened. The second-largest state in this region, with a large share of the TFG area (94.30%) after Bihar (95.60%). During the study period, the state gained the GCA for TFG by 2.39%. The state has lost its cultivable area due to extreme weather and climatic conditions. Bihar: Since the 2005–2006 census information is unavailable for Bihar, we could not measure the changes in the cropping pattern. The largest share of TFG impacts the state diversification value and remains specialised. From 2005–2006 to 2015–2016, the share of TFG increased from 88.26% to 95.60%. West Bengal: There has been a significant increase in OFG cultivation, especially vegetables and fruits. Other cereals have grown, paddy has declined, and oilseeds have increased significantly. There has been a shift towards vegetable cultivation on a large scale. West Bengal has shifted a large area under the cultivation of vegetables (334000 ha.), the maximum in the country.
The story of NER and ER states shows diverse cropping patterns and trends. Meghalaya and Mizoram have shifted crop area most towards cultivating spices & condiments compared to fruits and vegetables. Arunachal Pradesh, Manipur, Assam, Sikkim, and West Bengal experienced extensive diversification towards cultivating vegetables and fruits rather than other high-value and commercial crops. In Nagaland, the area has declined mostly under spices & condiments, and vegetables. In Odisha and Bihar, crop cultivation shifted towards monocrop, which was dominated mainly by TFG. These two states lost most of GCA under most OFG crops, leading to specialisation.
Conclusion
This article identifies specific crop groups leading to crop diversification or specialisation that are important for crop-specific policy support. We emphasise crop diversification and identify crops leading to diversification or specialisation for NER and ER states. The demand for high-value crops is rapidly growing more than staple crops. Crop diversification towards high-value crops can potentially increase farm income, especially in India, where smallholders dominate the farming community. There is a long-standing debate on the ability of smallholders’ dominant subsistence agriculture economy to shift toward high-value crops, which reveals a pro-smallholder bias (Birthal et al., 2007). The high-value primary fruits and vegetables are perishable and need urgent management and farm support. So, the performance of smallholders in changing high-value crops would depend on the availability of farm services, including high-yield seeds, fertilisers, irrigation, transport, cold storage, market, and capital support.
The NER and ER states rapidly shifted crop patterns towards cultivating high-value crops. With the changing cropping pattern and demand-driven agriculture practice, smallholders’ participation in high-value crops will be crucial for agriculture development in India, where smallholders are expected to grow with fragmentation. The NER and ER states are already facing acute agriculture disadvantages, where the land allocation for high-value crops, predominantly fruits and vegetables, is rapidly growing, raising concerns about smallholders’ performance. Smallholders are resource-poor in cultivating high-value crops, and this region lacks advanced farm services. Public investment in supply chain and farm service development will be crucial for future agriculture development. Recently, the government of India (GoI) has launched an initiative, namely the ‘One District One Product (ODOP)’ approach, to acquire the advantages of economies of scale to access inputs, common services, and marketing of produce (MoFPI). This policy has focused on the NER region, which may keep the cropping pattern in mind. This scheme includes crops, primarily fruits and vegetables; however, more investment in the value chain development is needed as the production of fruits and vegetables is projected to be grown rapidly in India and the NER region.
Although the country has improved in nutrition indicators, it still has a large percentage of the population deprived of nutrition (Gopalan, 2013; Gulati & Roy, 2021). While nutrition outcomes depend not only on the availability of diverse food or crop diversification, other factors like income, education, health facilities, etc., also matter. We further explored crop diversification and found positive relations between income (value of crop output) and traditional nutrition indicators (stunting, wasting, and underweight). States with a better position in crop diversification have better conditions in crop income and nutrition indicators (see Table A3 and Figure A1). Considering rural and agricultural households that primarily depend on crop production, diversification can improve their economic and nutrition conditions. Policy focuses on improving nutrition and must also consider this situation of agricultural diversification. Considering the dominance of smallholder farmers in the NER and ER regions, with the changing cropping patterns towards high-value crops, policy needs to be designed to support through infrastructural development and farm services, giving regional priorities in cropping patterns rather than designing a centralised framework. Moreover, the movement of cropping patterns towards specialisation in Odisha and Bihar raises concerns about the ER region’s nutrition security and economic development.
Since West Bengal has shifted most GCA under vegetables led by potatoes, we were eager to see how smallholders gain under contract farming as the recent government is promoting corporate-friendly policies in the name of agricultural development. A recent article (Barik & Bedamatta, 2023) highlights that contract farming fails to provide better returns to potato farmers at production loss and price movements. So, policy focus must be given regional priorities, and smallholders’ interests must be protected. Nowadays, the government promotes those practices and is expected to encourage private sector participation in agriculture to boost smallholders’ income and production, particularly in ER and NER states where smallholders dominate. The benefits and performance of smallholders under contract farming and FPOs need to be examined for this region.
Appendix
Diversification (HHI) at State/UTs During 1990–1991 to 2015–2016.
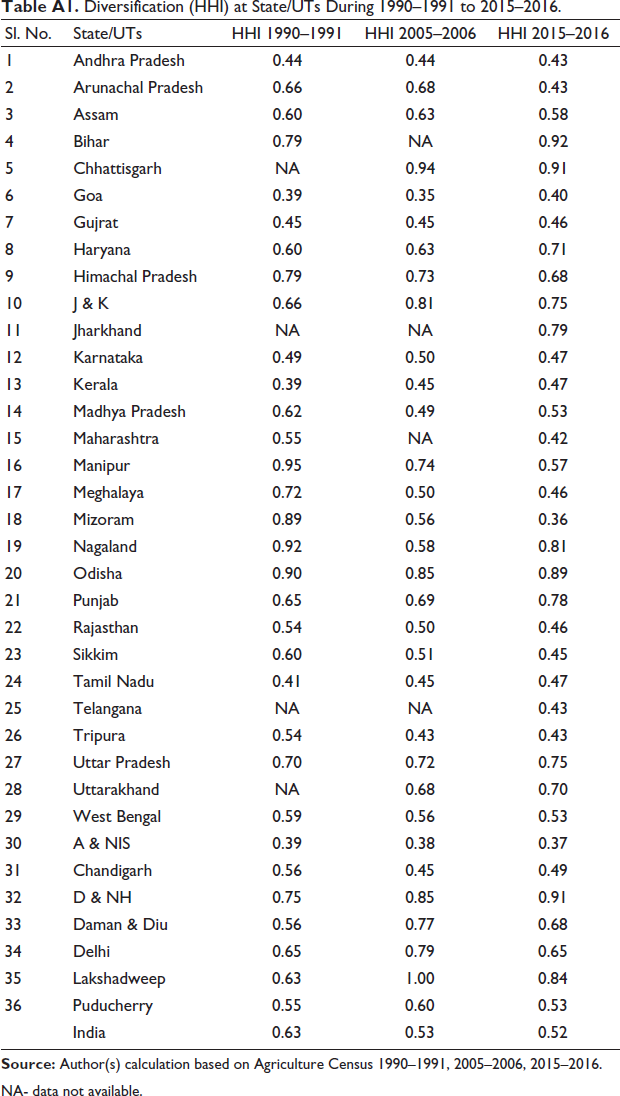
NA- data not available.
Changes in the Gross Cropped Area of Different Crops in NER and ER States (2005–2006 to 2015–2016).

GCA in ‘00’ ha.
Distribution of Diversification, Value of Output and Nutrition Indicators (2015–2016).
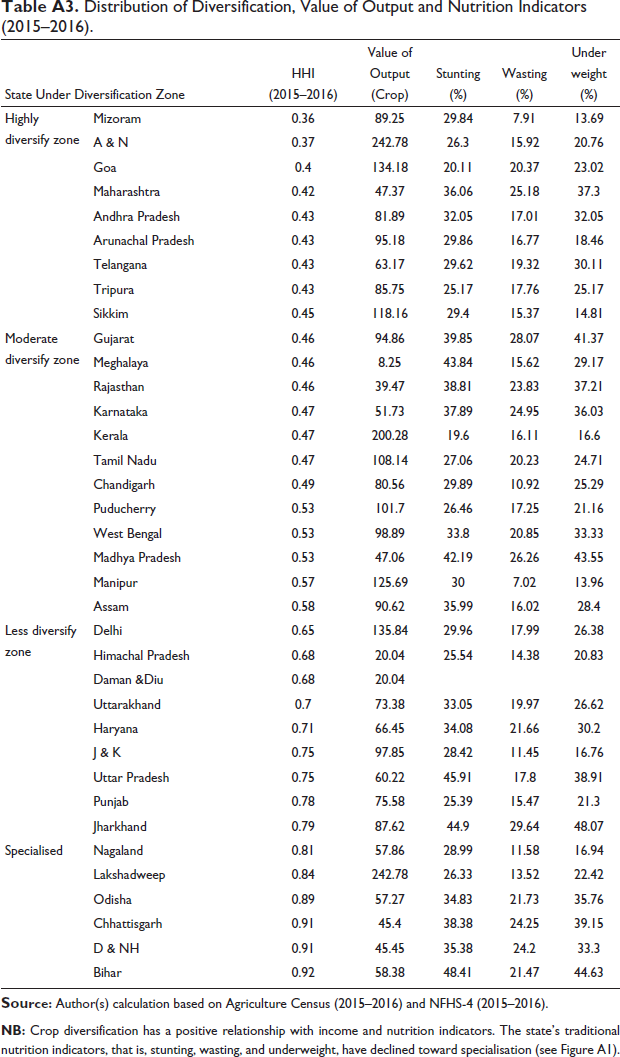
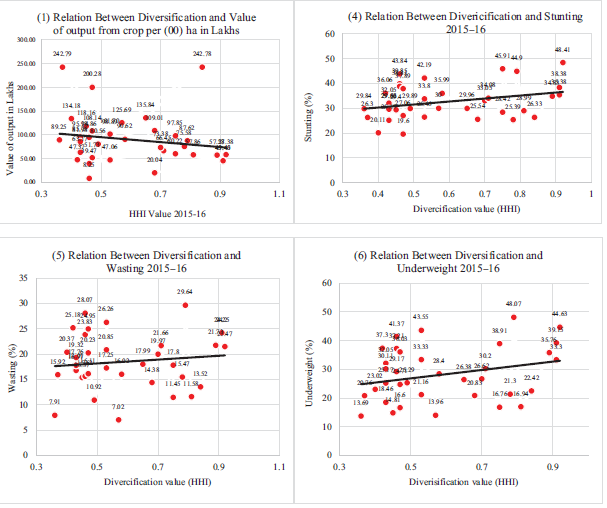
Figure 1 shows the relationship between diversification and the value of output from crops. States geared towards specialisation show that the value of crop output, the major income source for agricultural households, has declined. The second graph shows that the percentage of the population in stunting is increasing towards specialisation. Similarly, wasting and underweight percentage of the population at the state level has increased where states are in specialisation or closed to it.
Footnotes
Declaration of Conflicting Interests
The authors declared no potential conflicts of interest with respect to the research, authorship and/or publication of this article.
Funding
The authors received no financial support for the research, authorship and/or publication of this article.