
Abstract
Japan launched a municipal financial incentive program in 2018 to promote higher-quality long-term care (LTC). We quantified the association between municipal incentive performance and subsequent incident LTC certification and all-cause mortality among community-dwelling older people. Baseline 2016 data from the Japan Gerontological Evaluation Study (N = 90 896 adults aged ≥65 years in 23 municipalities) were linked to 2018-2020 administrative records. Each municipality received a composite incentive score (0-612). Using multivariable logistic regression with fixed effects, we estimated odds ratios (ORs) per 1 SD score increase, adjusting for demographics, socioeconomic status, and health. Over three years, 10.7% newly required LTC certification and 5.1% died. A 1 SD higher incentive score was associated with lower odds of incident LTC (OR: 0.91) and all-cause mortality (OR: 0.66). These benefits were driven by the “Support Functional Independence/Prevent Progression” domain in less-urban areas, while plan-do-check-act–style activities predominated in cities. Overall, better municipal performance under Japan’s financial incentive policy correlated with short-term reductions in LTC utilization and mortality among older residents, supporting continued monitoring and policy refinement.
What We Already Know
Japan’s aging has strained the long-term care insurance (LTCI) system and prompting municipalities to seek cost-effective strategies.
In 2018, a financial incentive program began rewarding municipalities for Plan-Do-Check-Act (PDCA) management, functional-independence support, and fiscal balance.
Empirical evidence linking such incentives to health outcomes has been scarce.
What This Article Adds
Each 1 SD higher incentive score correlated with 9% fewer new LTC certifications and 34% lower mortality over three years.
Functional-independence support was most influential in rural areas, whereas PDCA-cycle quality improvement dominated in urban areas.
Findings suggest municipal incentives may relate to resident health, underscoring the need for causal and cost-effectiveness analyses.
Introduction
Japan’s long-term care insurance (LTCI), launched in 2000, aims to maintain functional independence in older adults and ease family burden. It is a social-insurance scheme that provides services—not cash benefits—regardless of income or family composition, allowing recipients to choose providers. 1
Twenty years since its launch, the Japanese LTCI system is in need of reform. Uptake has increased rapidly: in 2023, LTCI benefits (excluding user copayments) totaled JPY 10.8263 trillion (USD 72.2 billion at 150 JPY/USD), and total LTC service costs reached JPY 11.7168 trillion (USD 78.1 billion), surpassing the JPY 10 trillion mark in 2017. 2 The Japanese Government, faced with new issues of economic viability and sustainability, has introduced policies, such as mobilizing healthy older adults to support more vulnerable peers. 3
In 2018, an incentive grant system was introduced by the Japanese Ministry of Health, Labour and Welfare (MHLW) with an annual budget of 20 billion JPY 133.3 million USD, rewarding municipalities for LTCI performance. 4 Municipalities are annually scored item-by-item across three domains (max 82/460/70; total 0-612), and the unweighted sum informs block-grant allocations (see Methods and Table S1).
The JPY 20 billion incentive budget is distributed to municipalities (19 billion JPY) and to prefectures (one billion JPY) in the form of block grants. In Japan, local municipalities are responsible for administering the LTCI system, which includes maintaining a long-term care (LTC) registry, screening applicants for LTC needs, and provision of tiered LTC services. Moreover, each municipality is responsible for operating the LTCI from its own budget, allocated by the prefecture. In the present study, we focus on grants awarded to municipalities, with amounts determined by a national scoring system developed by the Japanese MHLW. The scheme does not impose a single national numerical coverage target; municipalities are assessed by a composite, item-by-item score, with some indicators awarding points based on relative ranks or threshold criteria (see Table S1). 5
The incentive score is updated annually. In 2018, municipalities were awarded, on average, 411.0 (67.2%) of 612 points in total. 6 The 612-point score covers plan-do-check-act (PDCA)-based management (category I = 82 pts), functional-independence support (category II = 460 pts), and fiscal balance (category III = 70 pts). Points were awarded item-by-item according to the MHLW rubric 5 ; each indicator contributed a fixed number of points when the criterion was met, and the total incentive score was the unweighted sum across all items (range 0-612). A compact item-points mapping is provided in Table S1. The scheme is intended to spur local initiatives; for example, category II rewards programs that bolster community LTC support.7,8 For clarity, we briefly summarize the item-by-item, unweighted summation procedure in the Methods and provide an item-points mapping in Table S1. The scheme applies to all municipalities nationwide in Japan. 4
In the current study, we sought to examine the association between incentive score values and health outcomes, namely, the incidence of LTC needs and mortality, that are hypothetically linked to local authorities’ efforts to support functional independence and preventing the progression of LTC needs in the local population. 8
Methods
Study Participants
This study used longitudinal data from the Japan Gerontological Evaluation Study (JAGES), an ongoing nationwide cohort of older adults in Japan. Details have been described elsewhere. 9 At baseline, self-reported questionnaires were mailed in 2016 to a total of 132 906 community-dwelling physically and cognitively independent adults aged ≥65 years selected from 23 municipalities in 11 prefectures of 1741 in 47 in Japan. These 23 municipalities were selected based on the willingness of municipal authorities to participate in the nationwide JAGES cohort. Random sampling was used in larger municipalities (ie, more than 5000 inhabitants), whereas a complete census of all eligible residents was conducted in smaller municipalities. This cutoff value was determined based on the study design of the JAGES project, where larger municipalities with more than 5000 inhabitants were sampled using a random sampling method to ensure representativeness. 9
Ethical approval was obtained from the Ethics Committee of Chiba University Faculty of Medicine (no. 2493) and the National Center for Geriatrics and Gerontology (no. 992). Informed consent was obtained from all participants. Questionnaires were mailed to participants containing a code encrypted to prevent personal identification and an explanation of the study objectives and procedures. Then, participants read the explanation and responded. We considered informed consent was obtained from participants when they returned the questionnaire. This study was conducted according to the recommendations of the Declaration of Helsinki and was reported in accordance with the STROBE statement.
Of 92 291 respondents to the baseline survey (response rate = 69.4%), 90 896 were successfully linked with administrative records for 2016-2020, forming the final study sample from 23 municipalities (1.32% of Japan’s 1741 municipalities; sFig. 1). Because the JAGES baseline intentionally targeted physically and cognitively independent community-dwelling older adults, individuals with substantial cognitive impairment at baseline were largely excluded, which may bias associations toward the null.
LTC Insurance System and LTC Needs
The LTC insurance system in Japan, universal health care, was established in 2000.1,10 Long-term care needs are assessed according to a nationally standardized methodology.1,10 First, provisional LTC needs are proposed by a computerized algorithm based on a home visit assessment by trained local authority staff and a report by the family physician; LTC needs are defined according to seven levels of care (ie, two support levels and five care levels). 10 The provision of LTC services is then discussed and finalized by an expert committee appointed by the local government. In Japan, LTC certification is the legal gateway to services and follows this nationally standardized process; accordingly, we use incident certification as our primary outcome. 10
In this study, LTC needs are defined based on the presence or absence of LTC certification rather than specific levels of care. Specifically, individuals who receive LTC certification are classified as having “LTC needs,” while those without certification are classified as having no “LTC needs.” National context: among adults aged ≥65 years, the certified share is 18.9% in 2022 and 19.1% in 2023, and it rises sharply with age (31% for those ≥75 years and 57.7% for those ≥85 years). 11 Statistics on the proportion of applicants found ineligible are not centrally aggregated in national statistical series and are reported only sporadically by municipalities. 11
We examined the association between LTC needs and policy outcomes under two conditions. First, we included all certified individuals (total certifications). Second, we limited the analysis to individuals certified at care level 2 or higher because it indicates the onset of hands-on basic activities of daily living (ADL) assistance (i.e., moderate-or-higher need).10,12 This approach enabled us to assess potential differences in policy outcomes depending on the level of LTC certification. Mortality was ascertained at the individual level from cohort linkage; in our regression, the mortality outcome is a participant-level indicator of death during 2018-2020. As contextual covariates, we additionally adjust for the municipal all-age mortality rate in 2015.
Covariates
We controlled for age (five-year age groups), sex, years of schooling (five years or fewer, six to nine years, 10-12 years, or 13 years or more), equivalized income, number of teeth (0, 1-4, 5-9, 10-19, 20, or more), living alone (yes/no), higher functional ability based on the Tokyo Metropolitan Institute of Gerontology Index of Competence (TMIG-IC), a 13-point scale (see Table S2 for detailed items) and divided into two groups with 7/8 points, 13 baseline ADL surveyed in the JAGES study, and municipality code as covariates. Covariates were selected based on previous studies.14-16
Equivalized income was calculated as the household income (JPY) divided by the square root of the number of people in the household, being categorized into quartiles; 1st quartile: 1.299 million JPY per year and lower; 2nd quartile: 1.300 to 1.945 million JPY per year; 3rd quartile: 1.946 to 3.175 million JPY per year; and 4th quartile: 3.176 million JPY per year and higher.
Also, we adopted the concept of multimorbidity to adjust for diseases affecting older people’s LTC needs and mortality risk in this observational study. We adopted the concept of “complex multimorbidity” (CMM) in the present study, which focuses on the range of human body systems impaired by diseases. 17 Complex multimorbidity is defined as three or more different body system disorders caused by diseases. The JAGES project surveyed 17 diseases in 2016 that participants were suffering from at the time of the survey by self-report. The 17 diseases were grouped into 11 disease categories (such as “Endocrine, nutritional and metabolic diseases” and “Diseases of the blood and blood-forming organs and certain disorders involving the immune mechanism”) based on International Classification of Diseases, Tenth Revision (ICD-10), according to the body systems they impair, and CMM was defined when a participant had diseases affecting three or more body systems (i.e., three or more body system disorders).17-19 Table S3 summarizes the correspondence between body system disorders and the 17 diseases investigated.
Statistical Analysis
This study hypothesizes that higher municipal incentive scores in 2018 are associated with lower incidences of LTC needs and mortality over the subsequent three fiscal years. We defined a three-fiscal-year observation window (2018-2020) because (1) the incentive score is updated annually and municipal initiatives typically require one to two years to mature, and (2) national administrative outcomes are released on a fiscal-year cadence. A longer window would increase confounding from concurrent shocks—most notably COVID-19—whereas a shorter window might miss implementation lag. In addition, we adjusted for pre-policy municipal health conditions (2015 mortality and incident LTC rates) to mitigate bias. 11 This association reflects the efforts of municipalities in implementing measures to support functional independence and mitigate the progression of LTC needs. The association between municipal incentive scores and the incidence of LTC needs/mortality was examined using logistic regression analysis with municipal fixed effects. To confirm the appropriateness of including municipal fixed effects, a likelihood ratio test was conducted to compare models with and without these fixed effects. The exposure (incentive score) is at the municipality level, whereas outcomes (LTC certification and mortality) are observed at the individual level; we link municipal scores to individual outcomes using municipality fixed effects and cluster-robust standard errors.
The logistic regression model used in this study estimates the log-odds of experiencing LTC needs or mortality for individuals within municipalities. The equation is expressed as:
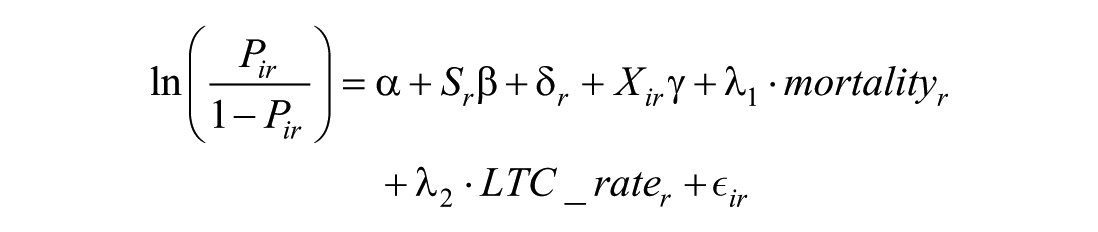
We estimate the model at the individual level using a three-fiscal-year window (2018-2020). For each person
In addition, we include two time-invariant municipal contextual covariates—mortality (2015) and incident LTC needs rate (2015)—to account for regional health conditions. Thus, the model links individual outcomes
To account for the clustering of individuals within municipalities, we employ cluster-robust standard errors. This adjustment corrects for the potential correlation of residuals within clusters (municipalities), ensuring that our standard errors are robust to intra-cluster correlation. This method provides more reliable estimates for hypothesis testing, particularly when municipalities may have shared unobserved characteristics that affect individual-level outcomes.
In addition, it is known that the inter-prefectural gap in LTC certification rates narrowed at the end of the first year of the policy has already been reported (from 1.50x in 2017 to 1.46x in 2018).2,20 Therefore, we should elucidate the mechanisms and local factors involved in the certification rate. For example, in urban areas, initiatives on a larger scale such as the use of the Plan-Do-Check-Act (PDCA) cycle, and in rural areas, community-specific initiatives to prevent LTC needs may have contributed to health outcomes. To verify this theoretical hypothesis, as stratified analysis, we also investigated whether the effects of incentive score differed according to the category as well as urbanicity (of the municipality) using the population density per habitable area. 21 Urbanicity was calculated using population density per inhabitable land area based on the 2015 Census of Japan.
Because the incentive-score categories were highly correlated (ranging from 0.7 to 0.9), we analyzed them in separate models to avoid multicollinearity.
Last, the data analyzed in this study were from 23 of the 1741 total municipalities in Japan. To assess the representativeness of the surveyed municipalities, we compared the incentive scores between the surveyed and all municipalities using a t-test. The results, presented in Table S4, indicate no statistically significant differences between the two groups, suggesting that the surveyed municipalities are broadly similar in terms of incentive scores.
Regarding the missing covariates, we adopted a missing at random assumption. We performed multiple imputation methods using a bootstrapping expectation-maximization algorithm. We generated 20 sets of imputed data, analyzed each dataset, and integrated the results obtained with Rubin’s rule.22,23
As a sensitivity analysis, we re-estimated the primary models on a complete-case dataset using the same specification.
All analysis was conducted by R (v4.1.1; R Core Team 2021) 24 with a significance level of 5%.
Results
Baseline Population Characteristics
Of all participants, 60% were aged 65 to 74 years, and 46% were male. Regarding educational attainment, 33% had less than nine years. A total of 89% had lower functional independence according to the TMIG-IC score, 14% had CMM, 8% had 20 or more teeth and 9% lived alone. Then, based on the 2015 census, the municipalities were divided into two quintiles by urbanicity, with 12 municipalities (25 602 people) classified as “low urbanicity” (population density per habitable area: 32.67-1108.76 /km2) and 11 municipalities (65 294 people) classified as “high urbanicity” (1197.08-7264.68 /km). The variables used in the analysis, that is, age, sex, educational attainment, equivalized income, multimorbidity, functional ability (TMIG-IC score), number of teeth, and living alone, did not show large differences by urbanicity (see Table 1).
Characteristics of participants at baseline in 2016, incentive score, and health outcomes in 2018-2020.
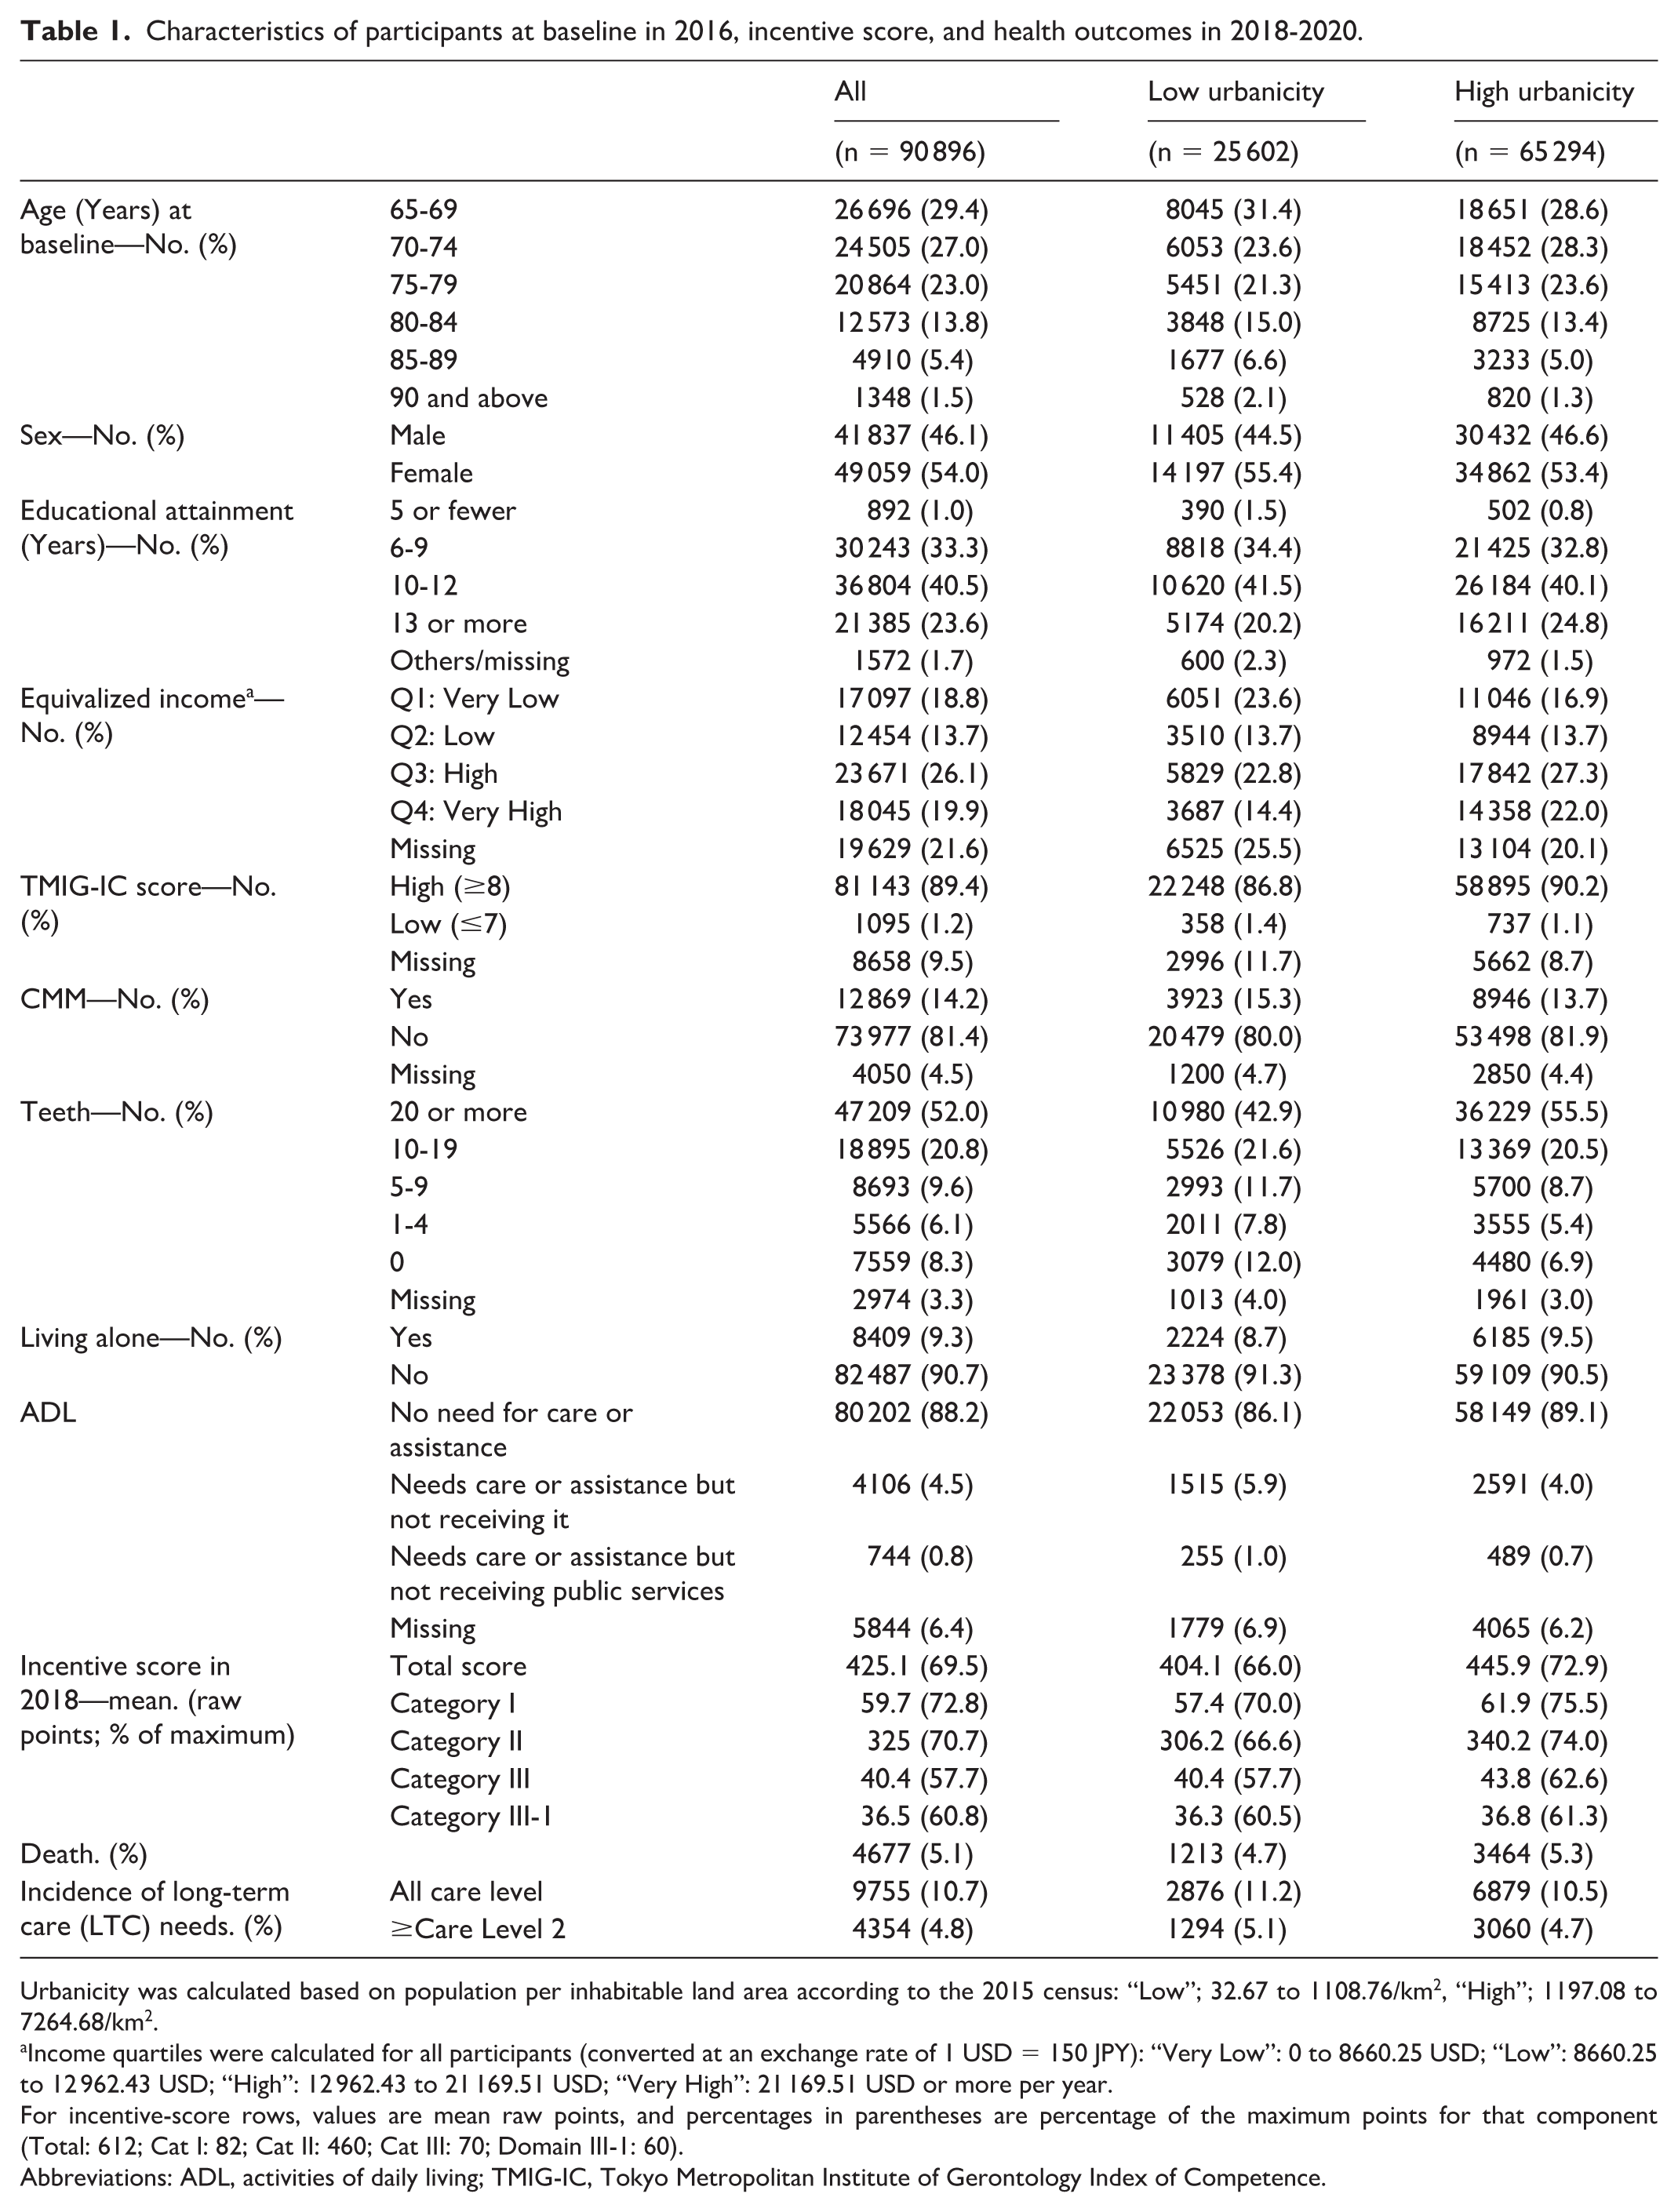
Urbanicity was calculated based on population per inhabitable land area according to the 2015 census: “Low”; 32.67 to 1108.76/km2, “High”; 1197.08 to 7264.68/km2.
Income quartiles were calculated for all participants (converted at an exchange rate of 1 USD = 150 JPY): “Very Low”: 0 to 8660.25 USD; “Low”: 8660.25 to 12 962.43 USD; “High”: 12 962.43 to 21 169.51 USD; “Very High”: 21 169.51 USD or more per year.
For incentive-score rows, values are mean raw points, and percentages in parentheses are percentage of the maximum points for that component (Total: 612; Cat I: 82; Cat II: 460; Cat III: 70; Domain III-1: 60).
Abbreviations: ADL, activities of daily living; TMIG-IC, Tokyo Metropolitan Institute of Gerontology Index of Competence.
Outcome
Table 2 presents the associations between incentive score and LTC needs/mortality. Each standard deviation increment in the incentive score was associated with 9% (odds ratio [OR]: 0.91, 95% confidence interval (CI) [0.90, 0.92]) and 34% (OR: 0.66 [0.54, 0.81]) lower risk for incident LTC needs and death, respectively. Sensitivity analysis using a more severe LTC needs cutoff (care level 2+) resulted in similar findings (Table S5). Five-year group age, sex, equivalized income, TMIG-IC, number of teeth, and living alone were all associated with the incident LTC needs and mortality.
The odds ratio of disability and mortality of older people in Japan in 2018-2020.
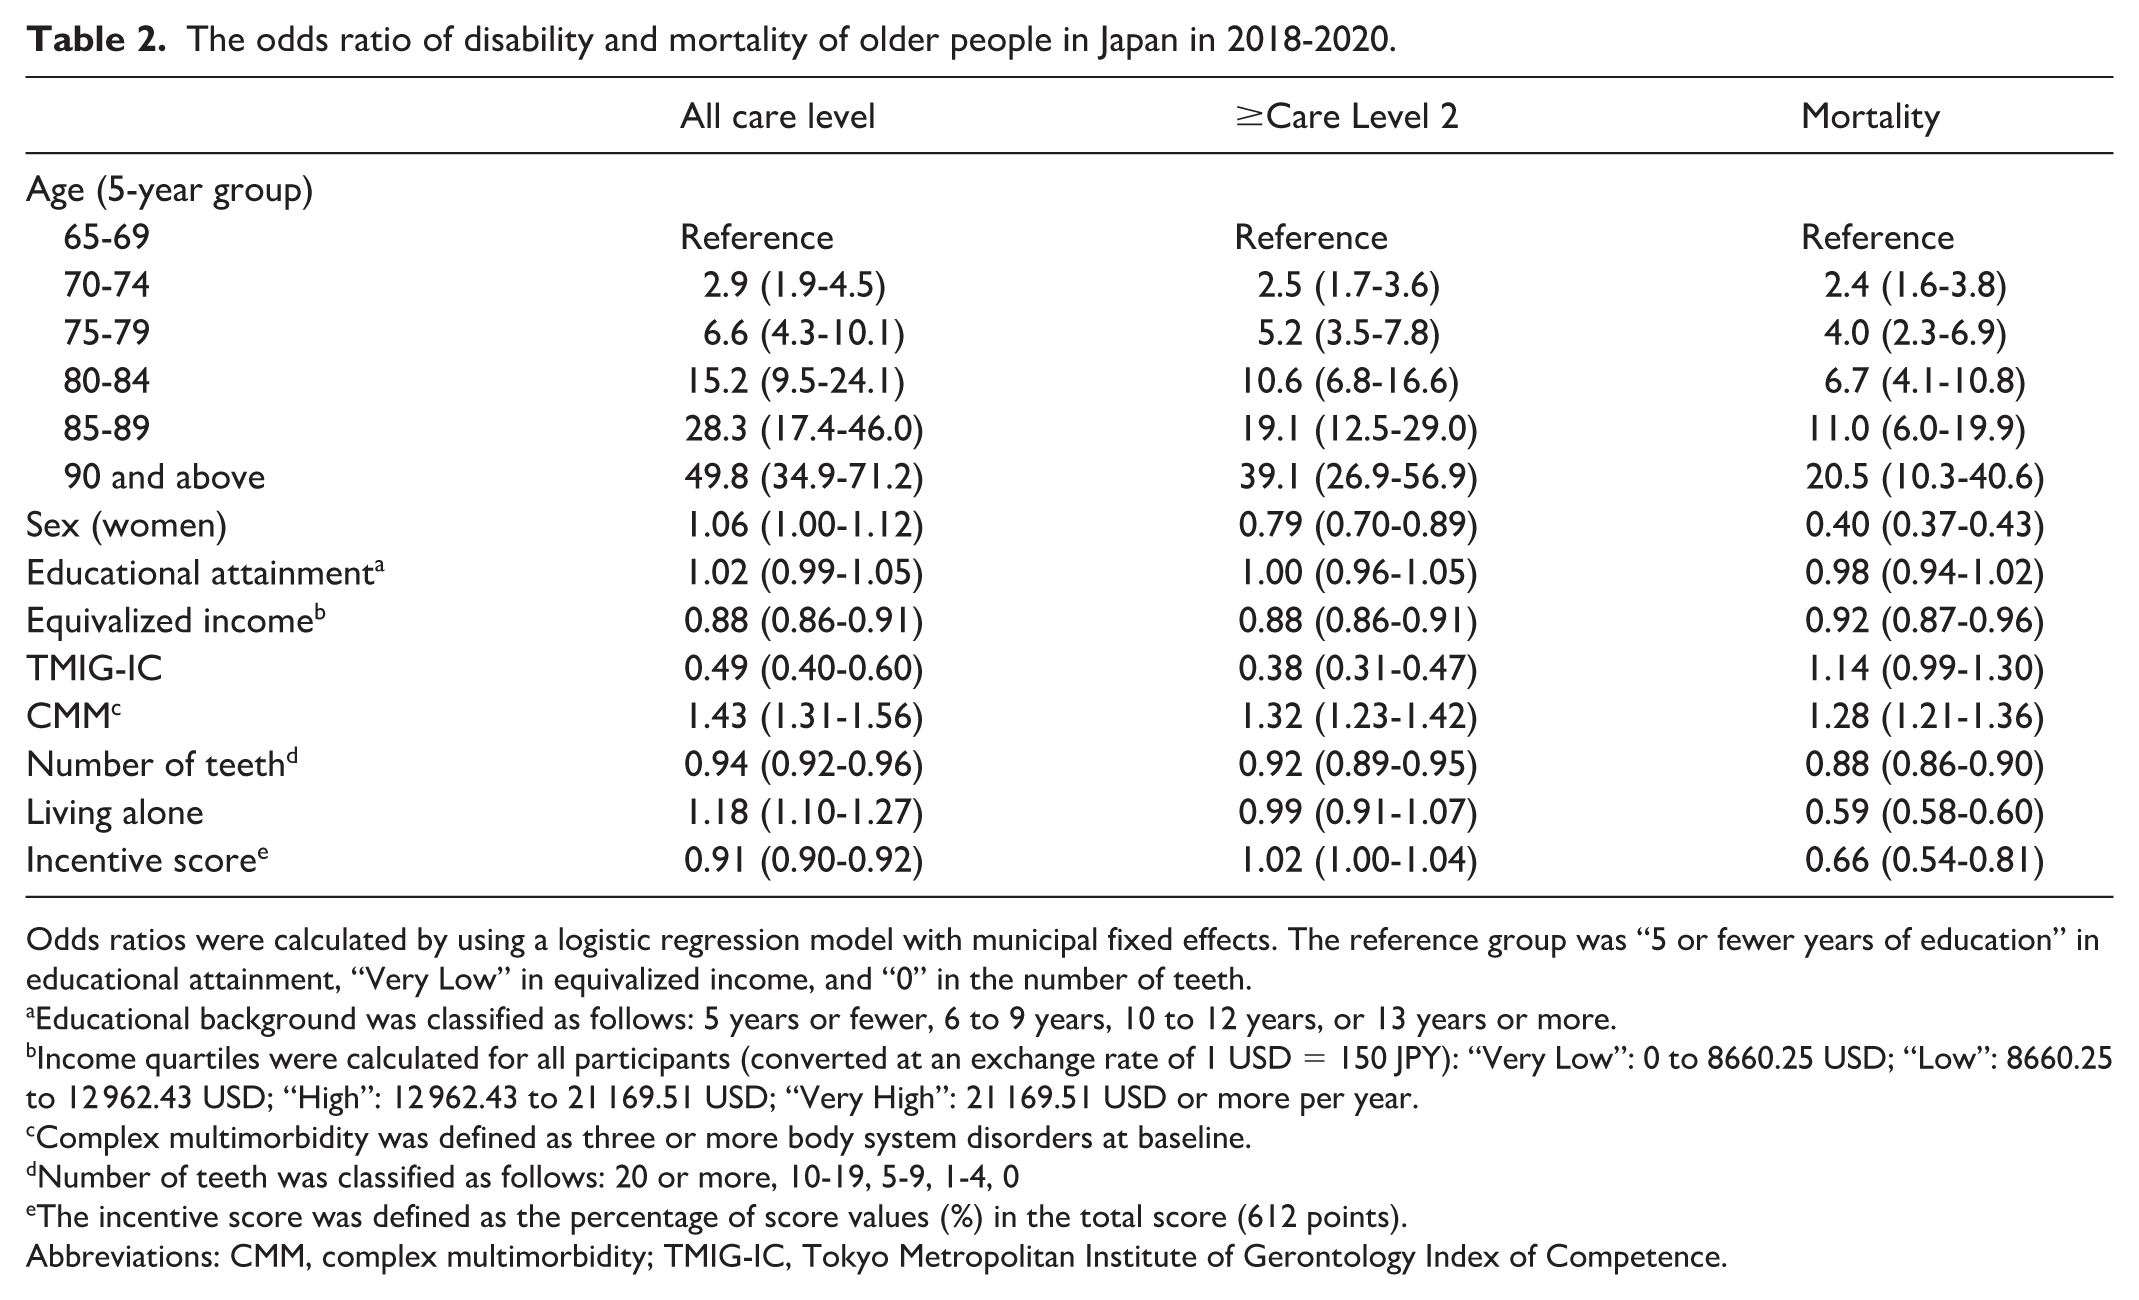
Odds ratios were calculated by using a logistic regression model with municipal fixed effects. The reference group was “5 or fewer years of education” in educational attainment, “Very Low” in equivalized income, and “0” in the number of teeth.
Educational background was classified as follows: 5 years or fewer, 6 to 9 years, 10 to 12 years, or 13 years or more.
Income quartiles were calculated for all participants (converted at an exchange rate of 1 USD = 150 JPY): “Very Low”: 0 to 8660.25 USD; “Low”: 8660.25 to 12 962.43 USD; “High”: 12 962.43 to 21 169.51 USD; “Very High”: 21 169.51 USD or more per year.
Complex multimorbidity was defined as three or more body system disorders at baseline.
Number of teeth was classified as follows: 20 or more, 10-19, 5-9, 1-4, 0
The incentive score was defined as the percentage of score values (%) in the total score (612 points).
Abbreviations: CMM, complex multimorbidity; TMIG-IC, Tokyo Metropolitan Institute of Gerontology Index of Competence.
Table 3 presents the category-wise associations for all LTC certifications. The corresponding estimates for LTC ≥ level 2 and mortality are provided in Tables S5-S6, including urbanicity-stratified results. Out of them, category II “Promotion of measures to support functional independence and prevent the progression of LTC needs” was most strongly associated with LTC needs (OR: 0.91 [0.89, 0.92]). When urbanicity was considered, category I had the largest association on LTC needs in municipalities with higher urbanicity (OR: 0.53 [0.48, 0.59]), whereas category III showed an association regardless of the level of urbanicity; however, the association was stronger in higher urbanicity areas. Finally, category III consists of two domains (III-1 “Optimization of LTC benefits” and III-2 “Securing the LTC personnel”). Because the former accounted for the majority of the scores (50 out of 60 points), we assessed the association of domain III-1, in particular. Domain III-1 was one of the most influential compared with the three categories. Some ORs observed in Table S6 are close to 1, suggesting that the associations between the policy and LTC needs and mortality may depend on regional characteristics or sample size constraints.
Odds ratios of categorical score values on all incident LTC needs in 2018 - 2020.
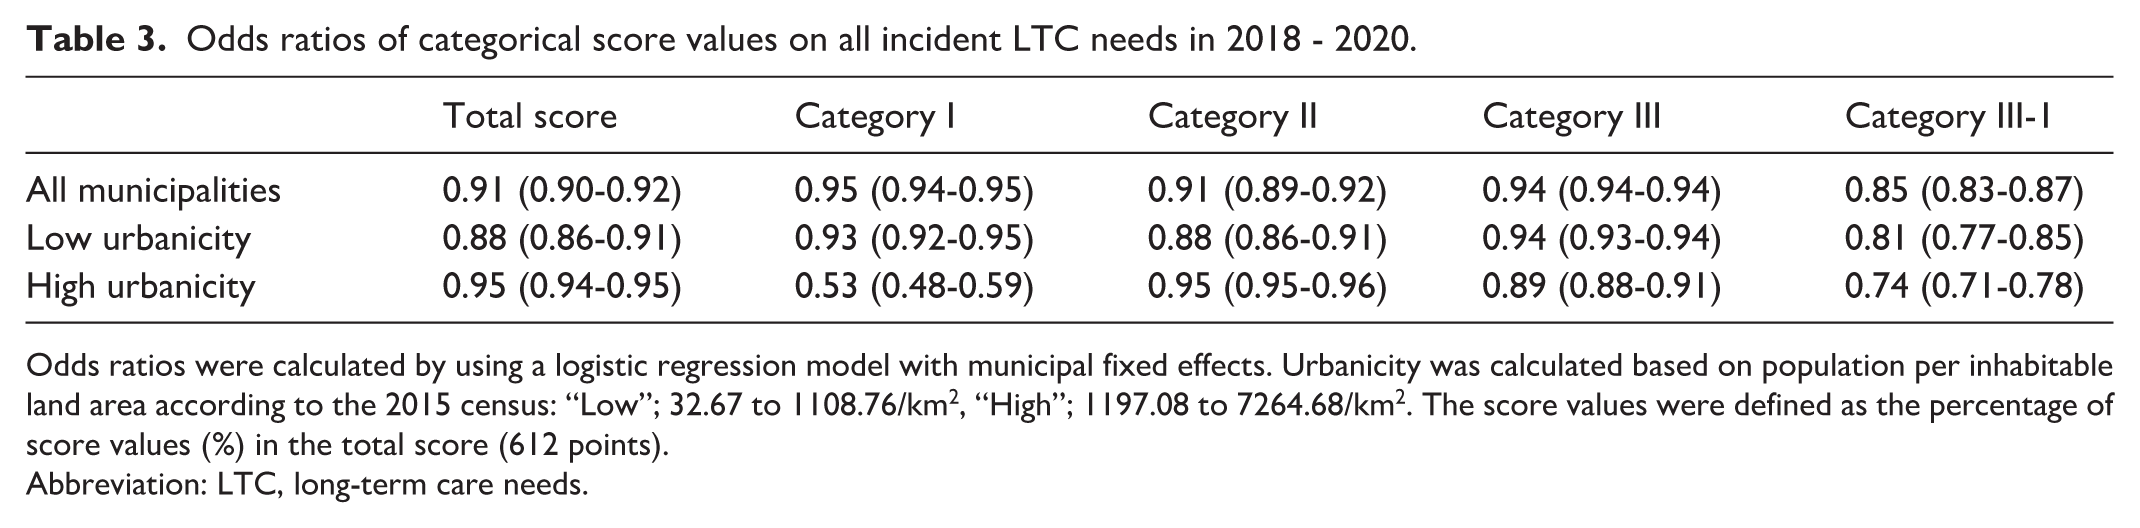
Odds ratios were calculated by using a logistic regression model with municipal fixed effects. Urbanicity was calculated based on population per inhabitable land area according to the 2015 census: “Low”; 32.67 to 1108.76/km2, “High”; 1197.08 to 7264.68/km2. The score values were defined as the percentage of score values (%) in the total score (612 points).
Abbreviation: LTC, long-term care needs.
Discussion
In our three-year cohort with municipal fixed effects, higher incentive scores correlated with fewer LTC certifications and deaths. Associations were stronger in rural than urban municipalities. In cities, PDCA-cycle management (category I) mattered most, whereas functional-independence support (category II) dominated in rural areas. Such contrasts suggest that one-size-fits-all incentives are sub-optimal. Policymakers could bolster urban PDCA capacity while funding community-based programs in rural regions. As our design is observational, causality cannot be claimed. Because certification reflects both application behavior and administrative judgment, our endpoint captures manifest rather than latent need and could shift with gatekeeping or operational changes (e.g., “optimization of LTC benefits,” domain III‑1). 10 We adjust pre‑policy (2015) municipal LTC and mortality rates and include municipal fixed effects to limit bias, though residual confounding may remain.
We considered alternative explanations. While the incidence of LTC needs was reduced in 2018, 16 when the policy was launched, the subsidy amount had just been announced three months before year end (rectified thereafter). In the launch year (2018), operational timelines were still being adjusted, and subsidy notifications to municipalities occurred about three months before year end; schedules were tightened in subsequent years. 25 This underscores the need to account for factors beyond municipal health initiatives when evaluating policy effectiveness. The early benefit observed therefore raises the possibility of reverse causation—high-performing municipalities may have been rewarded rather than improved. We mitigated endogeneity by controlling pre-policy LTC and mortality rates and by using municipal fixed effects, yet residual bias may remain.
Outside Japan, evidence on incentives aimed at long‑term care or older‑adult services suggests that effects depend on metric choice and the strength of financial signals. In the United States, Medicare’s Skilled Nursing Facility Value‑Based Purchasing program ties payment to 30‑day hospital readmissions; evaluations find little or no improvement in outcomes and document that incentives were small and highly variable from year to year, likely too weak to drive investment in quality improvement. 26 In the Netherlands, a 2015 national reform decentralized many home‑ and community‑based services to municipalities to strengthen efficiency incentives; subsequent analyses report a temporary increase in acute hospitalizations among older adults after implementation with later stabilization, underscoring the need to monitor unintended consequences when shifting responsibilities to local governments. 27
Finally, we hypothesize that the program curbed certifications via “optimization of LTC benefits” (domain III-1), echoing MHLW reports of lower certification rates in the first policy year. This would be consistent with the MHLW’s report that as early as the year the policy came into force (ie, only one year), the LTC certification rate decreased. 11
Domain III-1, which assessed the optimization of LTC benefits, showed an association with the incident LTC needs and mortality rates, regardless of the degree of urbanicity. This finding implies that trimming supplier-induced demand can work nationwide. In other words, the incentive for municipalities to “optimize LTC benefits” could have been feasible regardless of the level of urbanicity. Japan’s fee-for-service LTC payment has historically fueled volume-based growth; incentives that reward better outcomes rather than more services may temper costs and enhance sustainability.25,28 Our study did not quantify cost savings. Economic evaluations are needed to weigh incentive outlays against potential reductions in LTC expenditure and mortality. Apart from the caveats already discussed, two selection-related issues should be highlighted. First, by design, the baseline excluded most persons with substantial cognitive impairment; together with typical nonresponse patterns, this selection likely makes our estimates conservative. Second, although response and linkage rates were high, residual selection and nonresponse bias cannot be ruled out; generalizability to municipalities with dissimilar incentive-score profiles remains uncertain. Because several covariates have nontrivial missingness, complete-case analyses may induce selection. We therefore rely on the imputed analyses and present complete-case results as sensitivity (Table S7).
In addition to the previously noted caveats, several points deserve emphasis. Because the data come solely from Japan, the results may not translate to countries with different health care systems or population structures. The observation window also overlaps the COVID-19 pandemic, whose influence could not be fully disentangled from that of the incentive program.29,30 We did not assess cost-effectiveness, so the expense of the incentives was not weighed against any savings from reduced LTC certification or mortality. Finally, although the municipalities in our sample had incentive scores that broadly matched the national distribution (Table S4), unmeasured local factors may still constrain generalizability. These findings should therefore be interpreted within Japan’s specific policy and geographic context.
Regarding limitations, this observational study cannot establish causality. Our endpoint—administrative LTC certification—reflects application behavior and municipal adjudication as well as underlying need, and may shift with gatekeeping or operational changes (eg, the domain III‑1 “optimization of benefits”). We mitigated confounding using municipal fixed effects, and by adjusting for pre‑policy municipal LTC and mortality rates, yet residual bias and potential reverse causation at program launch remain possible. The JAGES baseline purposely enrolled physically and cognitively independent, community‑dwelling older adults; together with non‑response, this may bias associations toward the null and limit generalizability. Although the 23 study municipalities had incentive‑score distributions similar to the national profile, unmeasured local factors may constrain external validity. The observation window (2018-2020) is short and overlaps early COVID‑19. Because incentive‑score categories are highly correlated, we modeled them separately; their independent effects cannot be isolated. We did not evaluate cost‑effectiveness or cause‑specific mortality. These caveats should be considered alongside the alternative explanations and mechanisms discussed in the preceding paragraph.
Conclusion
The financial incentive policy was associated with lower incident LTC needs and mortality at the municipal level, which needs to be evaluated with longer-term data to address the possibility of endogeneity.
Supplemental Material
sj-docx-1-aph-10.1177_10105395251400134 – Supplemental material for Association of the 2018 Japanese Financial Incentive Policy With Long-Term Care Needs and Mortality
Supplemental material, sj-docx-1-aph-10.1177_10105395251400134 for Association of the 2018 Japanese Financial Incentive Policy With Long-Term Care Needs and Mortality by Daisuke Kato, Ichiro Kawachi, Tami Saito, Yuichi Yasufuku and Naoki Kondo in Asia Pacific Journal of Public Health
Footnotes
Acknowledgements
The authors would like to appreciate all staff who conducted the surveys, all survey participants, and JAGES group members.
Funding
The authors disclosed receipt of the following financial support for the research, authorship, and/or publication of this article: This study used data from JAGES (the Japan Gerontological Evaluation Study). This study was supported by Grant-in-Aid for Scientific Research (19K02200, 20H00557, 20H03954, 20K02176, 20K10540, 20K13721, 20K19534, 21H00792, 21H03196, 21K02001, 21K10323, 21K11108, 21K17302, 21K17308, 21K17322, 22H00934, 22H03299, 22J00662, 22J01409, 22K01434, 22K04450, 22K10564, 22K11101, 22K13558, 22K17265, 22K17364, 22K17409, 23K16320, 23H00449, 23H03117, 23K19793, 23K21500, 23K19796) from JSPS (Japan Society for the Promotion of Science), Health Labour Sciences Research Grants (19FA1012, 19FA2001, 21FA1012, 22FA2001, 22FA1010, 22FG2001), the Research Funding for Longevity Sciences from National Center for Geriatrics and Gerontology (21-20), Research Institute of Science and Technology for Society (JPMJOP1831) from the Japan Science and Technology (JST), a grant from Japan Health Promotion & Fitness Foundation, contribution by Department of Active Ageing, Niigata University Graduate School of Medical and Dental Sciences (donated by Tokamachi city, Niigata), TMDU priority research areas grant and National Research Institute for Earth Science and Disaster Resilience. The views and opinions expressed in this article are those of the authors and do not necessarily reflect the official policy or position of the respective funding organizations.
Declaration of Conflicting Interests
The authors declared no potential conflicts of interest with respect to the research, authorship, and/or publication of this article.
Data Availability Statement
The datasets of the Japan Gerontological Evaluation Study, which were used in this research, are available from the corresponding author upon reasonable request. All enquiries should be addressed to the data management committee via e-mail:
Supplemental Material
Supplemental material for this article is available online.
References
Supplementary Material
Please find the following supplemental material available below.
For Open Access articles published under a Creative Commons License, all supplemental material carries the same license as the article it is associated with.
For non-Open Access articles published, all supplemental material carries a non-exclusive license, and permission requests for re-use of supplemental material or any part of supplemental material shall be sent directly to the copyright owner as specified in the copyright notice associated with the article.