
Abstract
The diversity of protein food sources, animal and plant, may be a proxy measure of protein quality and adequate protein nutrition. A population-based sample of 1604 Malaysians aged ≥18 y completed one 24-h dietary recall and a new 29-item protein diversity indicator (PDI). Socio-demographic data were obtained by self-report. Mean total protein intakes were 75.2 g/d from 24-h recalls and 74.9 g/d from PDI. Protein diversity indicator–estimated protein intakes were 36.2% from meat and poultry, 8.8% from fish, 16.0% from eggs and dairy, and 39.0% from plants. Intakes of animal proteins varied with socioeconomic status and ethnicity and were associated with higher protein quality, defined as the adequacy of essential amino acids (EAAs) relative to protein requirements. Protein intakes and protein quality in Malaysia were generally adequate. Protein diversity indicator metrics can complement current methods of dietary assessment and may be useful for monitoring protein diversity and quality in other countries currently undergoing nutrition transition.
Keywords
What We Already Know
Protein intakes and protein quality in Malaysia are generally more than adequate.
The incomes-driven nutrition transition leads to diets with fewer starchy staples and more animal source foods, especially meat.
What This Article Adds
The 29-item protein diversity indicator (PDI) is a short dietary assessment tool that is less resource intensive compared to conventional methods of dietary intake assessment (diet histories, 24-h recalls, and food frequency questionnaires).
The PDI nutrient composition database includes amino acid composition of foods and can be used to provide estimates of essential amino acid (EAA) adequacy across population groups.
Protein diversity indicator protein intakes by group were compared to those obtained from 24-h recalls for the same respondents, providing relative validation.
Introduction
The diversity of protein food sources is one proxy measure of protein quality and adequate amino acid nutrition.1,2 The dominant starchy staples in the traditional South East (SE) Asian diets often contain low amounts of usable protein and can be low or lacking in essential amino acids (EAAs) and in necessary micronutrients. 3 Protein intakes and protein quality have become issues of public health interest in low- and middle-income countries (LMIC) in SE Asia but also elsewhere.4,5
Protein intakes are a component of dietary intake assessment, normally conducted using dietary histories, 24-h dietary recalls, or food frequency questionnaires. 6 Those conventional methods can be both costly and time consuming. Short dietary assessment instruments, focused on a particular nutrient or aimed at vulnerable populations, are the preferred method of rapidly assessing population nutrient needs. 7 For example the Minimum Dietary Diversity of Women (MDD-W) Indicator, 8 developed by the Food and Agriculture Organization of the United Nations (FAO), fills the need for a simple, food-based tool for measuring dietary diversity and micronutrient adequacy for women of reproductive age. The MDD-W asks about the consumption of specific food items from predefined food groups the previous day or night. Dietary diversity is a dimension of diet quality.9,10
Short dietary assessment instruments can also be useful when the assessment of the total diet is not required. 11 Estimates of protein intake from short dietary assessments are not as accurate as those from multiple 24-h dietary recalls but can be useful for estimating population averages and discriminating among population subgroups. 11 The FAO dietary diversity indicators are intended to estimate micronutrient adequacy among population subgroups.8,10 The MDD-W 8 asks about the consumption of starchy staples; vegetables and fruit; meats and poultry; organ meats; and fish, eggs, and dairy. Intended for women 15 to 49 years old, the MDD-W’s focus is on food groups rich in micronutrients, folate, and vitamin A. 8
Protein diversity is a dimension of protein quality and adequate amino acid nutrition.1,2 Following on the FAO instruments, the present protein diversity indicator (PDI) was constructed to assess protein diversity and EAA adequacy. The 29-item PDI asks about the consumption of specific protein food sources from predefined foods the previous day or night. In common with the MDD-W, included were foods from starchy staples; legumes; vegetables; meats and poultry; and fish, eggs, and dairy food groups. Dietary protein was coded by food source and amount, and the PDI nutrient composition database was modified to include amino acid content.
The present goal was to compare protein intakes (in g/day) as estimated by the two instruments: PDI and 24 h dietary recalls across population groups. Protein diversity indicator data were analyzed further to provide estimates of protein diversity from meat and poultry; fish and seafood; eggs and dairy; and plants and to assess EAA adequacy across population subgroups using FAO standards. 12
Methods
Participant selection and recruitment
The Socio-Cultural Research in Protein Transition (SCRiPT) study was based on a nationally representative sample of Malaysian men and women aged >18 years. 13 The sampling methodology was based on the Malaysian Adult Nutrition Survey. 14 The study recruited participants in Peninsular Malaysia, Sabah, and Sarawak, using a stratified random sampling scheme that took the states’ population size and degree of urbanization into account. A quota system based on gender, age, and ethnicity was also applied. A subject sampling table was added to help enumerators select respondents within the household. The final analytical sample was geographically distributed across the states in Peninsular Malaysia: Klang Valley or Greater Kuala Lumpur (N = 387); Johor (N = 188); Malacca (N = 50), Negeri Sembilan (N = 54). Perak (N = 138); Pahang (N = 96); Penang (N = 81); Kedah (N = 122); Kelantan (N = 90); Terengganu (N = 81); Sabah (N = 163); and Sarawak (N = 154). Of these, Kuala Lumpur, Johor, Perak, Penang, Negeri Sembilan, and Malacca are more than 50% urban. Kedah, Kelantan, and Terengganu are more rural, as are Sabah and Sarawak, which are in East Malaysia. The present sample had more women, younger adults, and urban dwellers than the Malaysian population but was otherwise consistent with the ethnic composition of Malaysia as determined in 2010 census. 15
The data were collected using in-person interviews between March and July 2018 using a structured questionnaire. All the questions were translated into Malay and Chinese, with languages reviewed by local experts. Questionnaire and methodology were approved by the Human Ethics Committee of Taylor’s University (reference no. HEC2017/030).
Socio-demographic questionnaires
Gender was coded as male or female. Age cutpoints were 18 to 25; 26 to 35, 36 to 45, and >45 years, roughly corresponding to population quartiles. Self-reported household income was divided by number of persons in the household to obtain mean monthly income per capita in Malaysian Ringgit (1 USD currently equals to 4.65 Ringgit). Income was divided into four categories: <700 RM/mo; 700 to 1333 RM/mo; 1333 to 2000 RM/mo, and >2000 RM/mo. The sum of 2000 RM currently corresponds to 430 US dollars. Education was coded as primary school, lower secondary school, higher secondary school, and college. Ethnicity was coded as Malay Bumiputra, non-Malay Bumiputra, Chinese, and Indian.
Total protein intakes (g/d) from 24-h recall
In the course of an in person interview, SCRiPT participants were first asked to list all the foods and drinks they consumed during the previous 24 h from waking to going to sleep at night. After each food was listed, participants were asked about the amounts of all foods and beverages consumed, including both meals and between meal snacks. The data collection interview followed previously used methods developed for the Malaysia Food Barometer. 13 Questions were asked about food consumption at home and about locations of eating events away from home. Additional questions probed for outside food sources such as restaurants, fast foods, food courts, hawkers, supermarkets, and convenience stores. Each eating event was described, and its time and duration were recorded. Questions were asked about company at meals and any activities that may have accompanied eating. The interviewer guide for the Malaysian 24-h dietary recall is provided in Supplemental Table 1. Dietary intake data from 24-h recalls were then entered in the Nutritionist Pro (Nutritionist Pro 2022) for Windows software, 16 based on the Malaysian Food Composition Tables.17,18
Total protein intakes (g/d) by food source from PDI
Short assessment instruments consist of a short list of relevant foods, portion sizes, and frequency counts. 11 The PDI was based on major dietary sources of protein from animals and plants that were obtained from the Malaysian Adults Nutrition Surveys. 14 The foods are listed in Supplemental Table 2. Fruits, vegetables, sweets, or fats were not included. Standard portions were based on Malaysia eating habits, as ascertained by past literature 19 and the Malaysian Adults Nutrition Surveys. 14 Study participants were asked to report the habitual frequency of consumption of each food item per month, per week, or per day. Proteins were assigned to meat and poultry; fish, eggs, and dairy; and to plant sources. Gram quantities of protein from each of the four food sources were then calculated for each participant. The contribution of animal and plant proteins was calculated by dividing amounts (g/day) from each group by the total estimated protein intake in g/day.
The PDI nutrient composition table in NutritionistPro (Axxya, US) was merged with amino acid data for each food, or the nearest equivalent food as obtained from the U.S. Department of Agriculture datasets. 20 Conventional nutrient composition databases such as NutritionistPro often lack specific data on amino acids. The publicly available USDA National Nutrient Database for Standard Reference Release 28 (SR-28) provided a comprehensive list of values for food components including amino acids. Mean percent adequacy for 11 EAAs was computed for each survey respondent, based on minimum protein requirements as determined by the FAO. 12 The mean percent adequacy measure was computed as the arithmetic mean of the recommended minimum intakes for EAAs (histidine, isoleucine, leucine, lysine, threonine, tryptophan, and valine), methionine + cysteine, and phenylalanine + tyrosine.
Plan of analysis
As part of a validation protocol, estimates of protein intakes (in g/day) from the new PDI were compared to estimates obtained from a single 24-h recall completed by the same study participants. Protein intakes from the two instruments were then compared across diverse socio-demographic groups in Malaysia.
Total protein intakes (in g/d) from 24-h recalls across population subgroups were analyzed using bivariate regression models (one-way analysis of variance [ANOVA]). Protein intakes (in g/day) from PDI, total and by food group, were also analyzed using bivariate regressions. Multiple-adjusted linear regression models with robust standard errors examined sociodemographic drivers of meat and poultry versus plant-source protein consumption. PDI-estimated intakes of protein from meat and poultry versus plant-source protein were the primary dependent variables, expressed as percent of total dietary protein. Income, education, and race/ethnicity were the independent variables of interest. The hypothesis that intakes of high-quality animal protein were associated with higher socioeconomic status (SES) was tested using multivariable regression models adjusting for covariates. Regression models examined the multivariate association of each independent sociodemographic variable with the outcome adjusting for age, gender, and marital status. Analyses were conducted using SPSS (version 27, IBM@SPSS, USA).
Results
Protein intakes (g/d) by socio-demographics and protein food source
Participant demographics are summarized in Table 1. The sample was 54.6% female, mostly of Malay (55.4%) and Chinese ethnicity (24.3%), well distributed by age and with upper secondary school (44.5%) or college education (31.5%). About 53.6% of households had no children.
Contribution of Sources of Protein and Adequacy of Essential Amino Acid Intakes, From PDI by Sociodemographics.
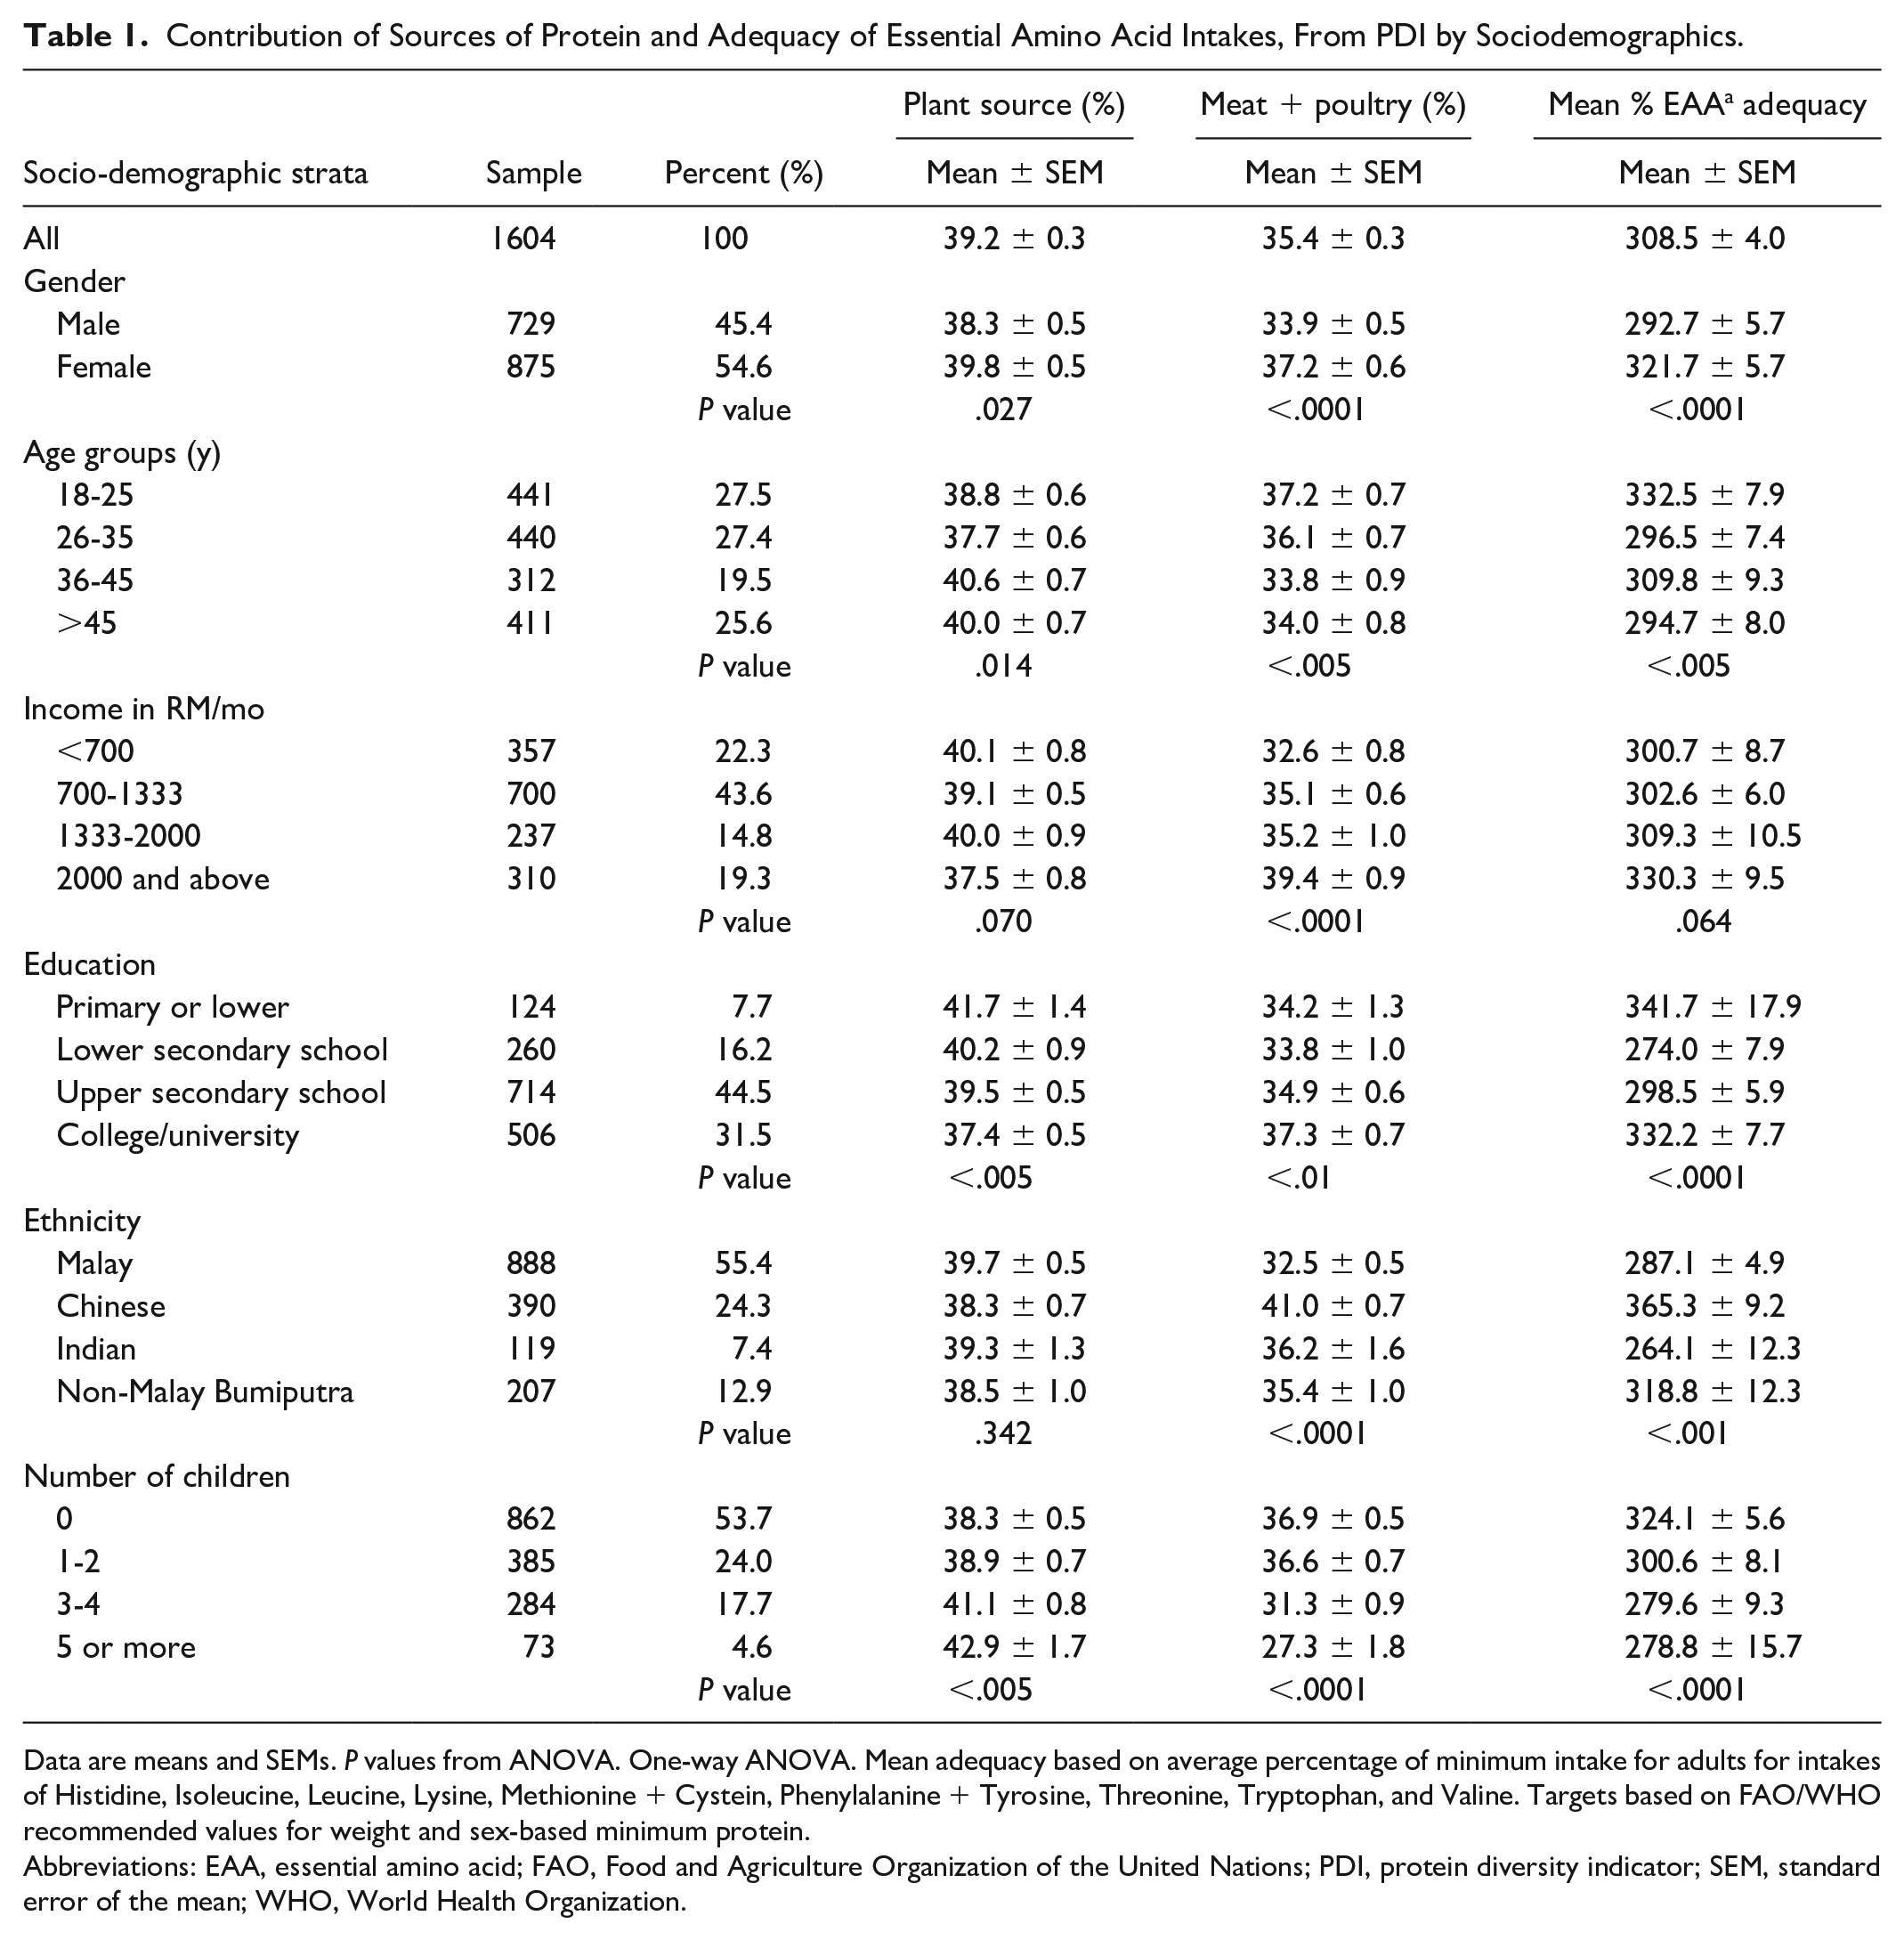
Data are means and SEMs. P values from ANOVA. One-way ANOVA. Mean adequacy based on average percentage of minimum intake for adults for intakes of Histidine, Isoleucine, Leucine, Lysine, Methionine + Cystein, Phenylalanine + Tyrosine, Threonine, Tryptophan, and Valine. Targets based on FAO/WHO recommended values for weight and sex-based minimum protein.
Abbreviations: EAA, essential amino acid; FAO, Food and Agriculture Organization of the United Nations; PDI, protein diversity indicator; SEM, standard error of the mean; WHO, World Health Organization.
Protein intakes in g/day as estimated by 24-h dietary recalls and by PDI are shown in Figure 1a. Mean protein intake from 24-h dietary recall was 75.2 g/day (78.5 g/day for men and 72.5 g/day for women). Mean protein intake from PDI was 74.9 g/day (76.5 g/day for men and 73.6 g/day for women). The differences between the two methods were not statistically significant. Percent energy from protein was 16.9% from 24-h dietary recall and 19.9% from the PDI.
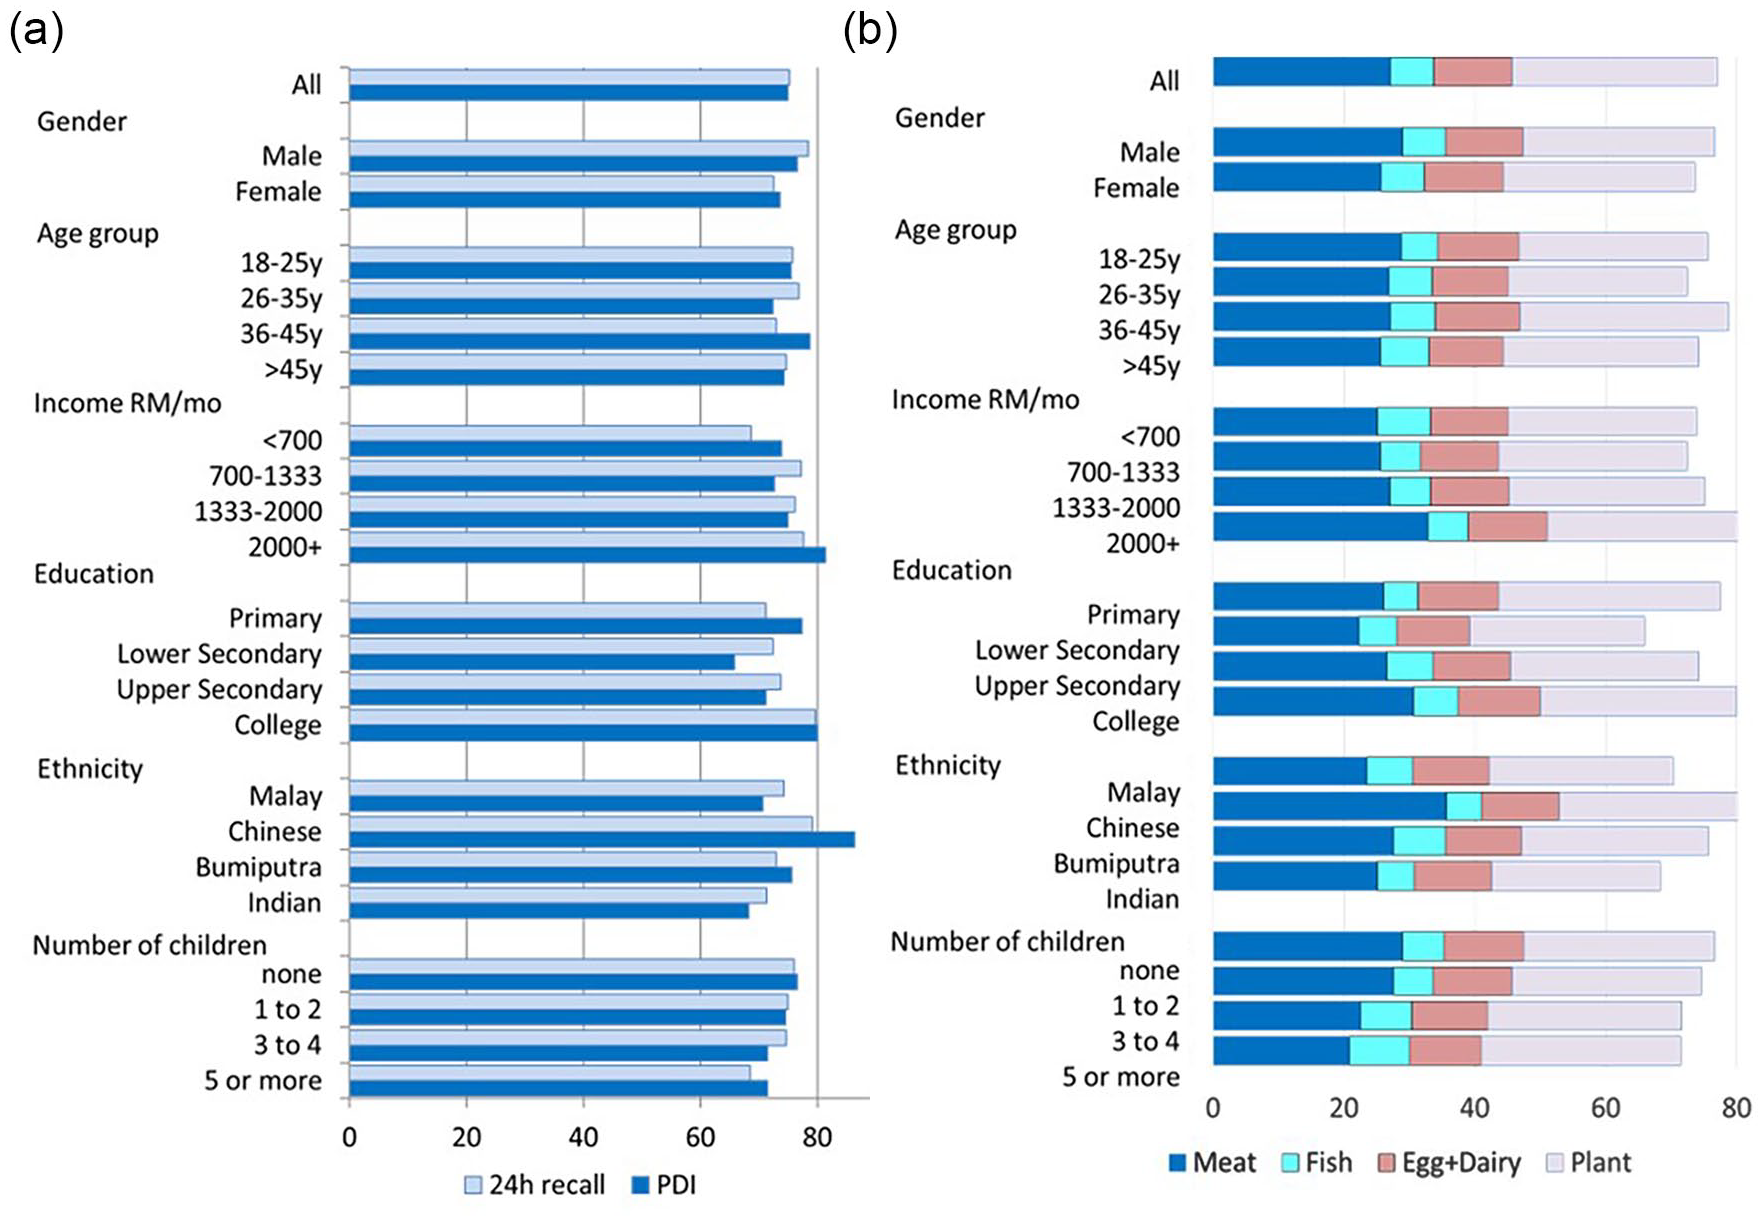
Estimates of total protein intake in g/day from the protein diversity indicator (PDI) (a) and estimates of total protein intake in g/day from PDI by food group (b).
Both instruments showed that protein intakes varied across socio-demographics. For 24-h dietary recalls and for PDI, higher protein intakes were associated with male gender (P < .001), higher incomes (P < .001); higher education (P < .001), and Chinese ethnicity (P < .001). The effect of gender was significant for 24-h recalls but not for PDI.
Protein intakes by food source were only obtained from the PDI and are shown in Figure 1b. An estimated 27.1 g/day (36.2%) came from meat and poultry, 6.6 g/day from fish (8.8%); 12.0 g/day (16.0%) from eggs and dairy, and 31.2 g/day (39.0%) from plants.
In bivariate analyses, PDI-estimated protein intakes from meat and poultry showed significant effects of male gender (P < .002), higher income (P < .001); higher education (P < .001), Chinese ethnicity (P < .001), and being single (P < .001). By contrast, higher PDI protein intakes from fish were associated with older age (P < .003), lower income (P < .001); lower education (P .05), Malay and non-Malay Bumiputra ethnicities (P < .001), and being married (P < .05). The effects of education were bimodal.
In contrast to meat, PDI-estimated protein intakes from plants (mostly rice) were associated with older adults (P < .05) and lower education (P < .005). The effects of ethnicity (P < .001) were significant but the effects of gender, age, and marital status were not.
Subsequent bivariate analyses of PDI-estimated protein intakes by source (Table 1) confirmed that higher education was associated with higher percent protein from meat and poultry, lower percent protein from plant sources, and with higher EAA scores. Higher incomes were associated with higher percent protein from meat and poultry but the negative association with plant protein intake was no longer statistically significant. Respondents with children at home had lower percent of animal protein and had lower mean EAA. Additional data are provided in Supplemental Table 3.
The association between PDI-estimated quintiles of protein intake from meat and poultry in g/day and other characteristics of the population diet is summarized in Table 2. First, higher quintiles of meat and poultry consumption were associated with higher percent protein from all animal sources (including eggs and dairy) and lower percent of protein from plant sources. The ratio of animal protein source foods to plant source foods was also higher. Mean percent adequacy of EAA intake also increased on going from the first to the fifth quintile, although the values were more than adequate for all socio-economic strata.
Dietary Sources of Protein and Adequacy of Protein and Essential Amino Acid Intake, Overall and Stratified by Quintiles of Intake of Meat and Poultry.
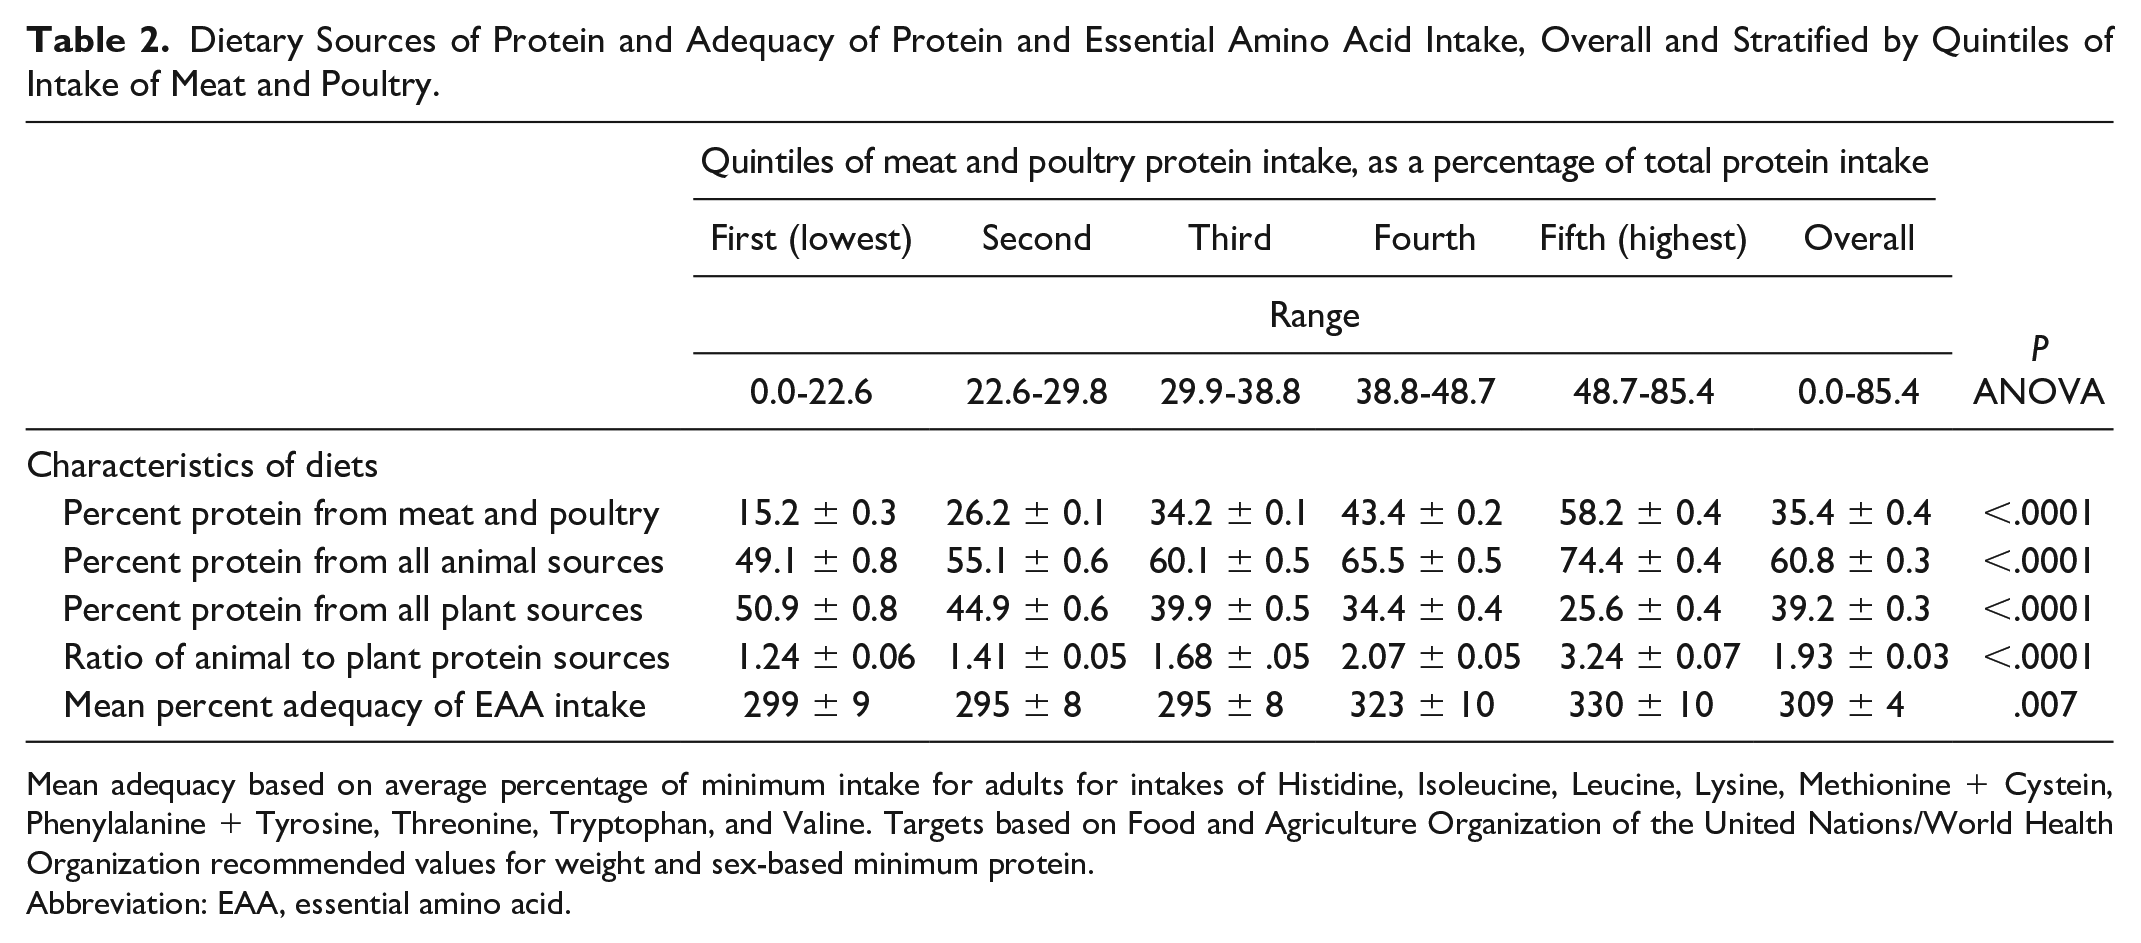
Mean adequacy based on average percentage of minimum intake for adults for intakes of Histidine, Isoleucine, Leucine, Lysine, Methionine + Cystein, Phenylalanine + Tyrosine, Threonine, Tryptophan, and Valine. Targets based on Food and Agriculture Organization of the United Nations/World Health Organization recommended values for weight and sex-based minimum protein.
Abbreviation: EAA, essential amino acid.
Discussion
Short dietary assessment instruments such as the dietary diversity indicators 8 are less accurate than multiple 24-h dietary recalls but can be used to estimate group means. 11 For the present sample, protein intakes from PDI and 24-h recalls showed comparable differences by socio-demographic groups. Both methods estimated mean protein intakes to be in the order of 75 g/day, confirming that total protein intakes in Malaysia were more than adequate overall. These data are consistent with past observations of rapidly increasing protein intakes in Malaysia. Estimates from 1997 21 placed protein intakes at only 59 g/day for men and 49 g/day for women. By 2019, protein intakes in Malaysia were estimated at 73.4 g/day for men and 67.1 g/day for women, 22 values closer to those observed in high-income countries than to the countries in SE Asia. Similarly, the PDI-estimated distributions of animal to plant proteins (61:39 ratio) were comparable to those from high-income countries. In the United States, analyses of the National Health and Nutrition Survey 2007-2010 estimated animal protein at 62% of total and plant protein at 30% of total, with the remainder undetermined. 23 In France, analyses of the INCA 2 database estimated animal protein at 69.5% of total. 24
Some social gradients in the consumption of meat, fish, and plant proteins did emerge. Stratifying the participant sample by quintiles of meat and poultry intake (as a percent of total protein) revealed that higher intakes were associated with significantly higher mean adequacy of EAA intakes, although all groups exceeded minimum levels. Higher intakes of animal protein were observed among younger, more educated, and higher-income groups and among single, urban respondents. Those data contrast with results obtained for France or the United States where the social gradient in meat consumption is no longer observed. 25 To the contrary, higher consumption of plant proteins has been associated with higher education but lower incomes. 26
The demographics of fish protein consumption deserves a special mention. Fish and rice were at one point the traditional staples of Malaysia and the neighboring countries.27,28 In adjusted regression models, fish and plant proteins were now associated with rural setting and lower SES.1,2 The observed decline in fish was countered by an increase in consumption of chicken, eggs, and dairy.27 -29 The shift in eating habits has been attributed in past studies to the “compressed modernization” of SE Asia 30 and may be linked to the growth of fast foods, which has had a decisive and documented impact on Malaysian food consumption patterns.
This study had limitations. Dietary diversity indices are short instruments that are less accurate than are conventional means of dietary intake assessment. The present comparisons of protein intakes were between the PDI and a single 24-h dietary recall. Both methods were based on self-report. Neither method may fully capture habitual eating patterns of individuals.
Conclusion
Short dietary assessment instruments, such as the present PDI, can be used to assess protein nutrition and amino acid adequacy across LMIC population subgroups. While no EAA deficiencies were observed in Malaysia, the present instrument can be adapted for other countries in SE Asia and so serve a global health purpose. Future trials of this instrument will be needed to validated its use in different cultures and in populations with different levels of under- and over-nutrition. Protein quality remains a public health concern.
Supplemental Material
sj-docx-1-aph-10.1177_10105395231219049 – Supplemental material for A Short Dietary Assessment Instrument to Evaluate Protein Quality and the Diversity of Protein Sources in Malaysian Diets
Supplemental material, sj-docx-1-aph-10.1177_10105395231219049 for A Short Dietary Assessment Instrument to Evaluate Protein Quality and the Diversity of Protein Sources in Malaysian Diets by Adam Drewnowski, Pablo Monsivais, Elise Mognard, Mohd Ismail Noor, Norimah Karim, Cyrille Laporte, Yasmine Alem and Jean-Pierre Poulain in Asia Pacific Journal of Public Health
Supplemental Material
sj-docx-2-aph-10.1177_10105395231219049 – Supplemental material for A Short Dietary Assessment Instrument to Evaluate Protein Quality and the Diversity of Protein Sources in Malaysian Diets
Supplemental material, sj-docx-2-aph-10.1177_10105395231219049 for A Short Dietary Assessment Instrument to Evaluate Protein Quality and the Diversity of Protein Sources in Malaysian Diets by Adam Drewnowski, Pablo Monsivais, Elise Mognard, Mohd Ismail Noor, Norimah Karim, Cyrille Laporte, Yasmine Alem and Jean-Pierre Poulain in Asia Pacific Journal of Public Health
Supplemental Material
sj-docx-3-aph-10.1177_10105395231219049 – Supplemental material for A Short Dietary Assessment Instrument to Evaluate Protein Quality and the Diversity of Protein Sources in Malaysian Diets
Supplemental material, sj-docx-3-aph-10.1177_10105395231219049 for A Short Dietary Assessment Instrument to Evaluate Protein Quality and the Diversity of Protein Sources in Malaysian Diets by Adam Drewnowski, Pablo Monsivais, Elise Mognard, Mohd Ismail Noor, Norimah Karim, Cyrille Laporte, Yasmine Alem and Jean-Pierre Poulain in Asia Pacific Journal of Public Health
Footnotes
Declaration of Conflicting Interests
The author(s) declared the following potential conflicts of interest with respect to the research, authorship, and/or publication of this article: AD is a consultant to Ajinomoto Co. and has received grants, contracts, and honoraria from public agencies, nonprofit organizations, and private entities with an interest in nutrient profiling and dietary nutrient density. The other authors have no conflicts of interest to declare.
Funding
The author(s) disclosed receipt of the following financial support for the research, authorship, and/or publication of this article: The study was supported by a grant from Ajinomoto Co. Japan. The funder Ajinomoto Co. was not involved in study design, collection, analysis, interpretation of data, the writing of this article, or the decision to submit it for publication.
Supplemental Material
Supplemental material for this article is available online.
References
Supplementary Material
Please find the following supplemental material available below.
For Open Access articles published under a Creative Commons License, all supplemental material carries the same license as the article it is associated with.
For non-Open Access articles published, all supplemental material carries a non-exclusive license, and permission requests for re-use of supplemental material or any part of supplemental material shall be sent directly to the copyright owner as specified in the copyright notice associated with the article.