
Abstract
Objective:
Several studies indicate that macrophage migration inhibitory factor 1 plays a role for tumor progression in colon cancer. We investigated whether determination of migration inhibitory factor 1 mRNA expression levels in lymph nodes of colon cancer patients could be used as a prognostic marker.
Methods:
Expression levels of migration inhibitory factor 1 and carcinoembryonic antigen mRNAs were assessed in primary tumors and regional lymph nodes of 123 colon cancer patients (stages I–IV), and in colon cancer- and immune cell lines using quantitative reverse transcriptase–polymerase chain reaction. Expression of migration inhibitory factor 1 protein was investigated by two-color immunohistochemistry and immunomorphometry.
Results:
Migration inhibitory factor 1 mRNA was expressed at 60 times higher levels in primary colon cancer tumors compared to normal colonic tissue (medians 8.2 and 0.2 mRNA copies/18S rRNA unit; p < .0001). A highly significant difference in mRNA expression levels was found between hematoxylin-eosin positive lymph nodes and hematoxylin-eosin negative lymph nodes (p < .0001). Migration inhibitory factor 1 and carcinoembryonic antigen proteins were simultaneously expressed in many colon cancer-tumor cells. Kaplan–Meier survival model and hazard ratio analysis, using a cutoff level at 2.19 mRNA copies/18S rRNA unit, revealed that patients with lymph nodes expressing high levels of migration inhibitory factor 1 mRNA had a 3.5-fold (p = .04) higher risk for recurrence, associated with a small, but significant, difference in mean survival time (7 months, p = .03) at 12 years of follow-up.
Conclusion:
Although migration inhibitory factor 1 mRNA expression levels were related to severity of disease and lymph node analysis revealed that colon cancer patients with high levels had a shorter survival time after surgery than those with low levels, the difference was small and probably not useful in clinical practice.
Keywords
Introduction
The macrophage migration inhibitory factor (MIF) family contains two members, MIF-1 and MIF-2 (also known as D-dopachrome tautomerase). The former was cloned and characterized 30 years ago, 1 while the latter was discovered and characterized more recently. 2 Both MIF-1 and MIF-2 signal through the surface receptor CD74. Signaling leads to enrollment of CD44 into a complex which initiates the ERK1/2 MAP kinase pathway. 3 MIF-1 also mediates chemokine-like functions, which are mediated through interaction with the noncognate receptors CXCR2 and CXCR4, leading to recruitment of immune cells. The latter function is mediated by a motif present in MIF-1 but absent in MIF-2. 4 MIF-1 is widely expressed in different cell types of the body, notably in immune cells, including T- and B-lymphocytes, and in various tumor cells. 5 It is a critical mediator of acute and chronic inflammatory diseases and of tumor progression and development. 6 MIF regulates cell proliferation and survival in monocytes, T-lymphocytes, and fibroblasts as well as tumor cell proliferation and angiogenesis.7,8
MIF appears to play an important role in colorectal cancer (CRC). Thus, MIF was reported to induce metastatic behavior of colon cancer (CC) cells through binding to CXCR4, 9 and to recruit pro-tumorigenic immune cells, which upon arrival at the tumor microenvironment promote tumor progression through a broad range of mechanisms.10–12 Furthermore, MIF secreted by hepatic sinusoidal endothelial cells was shown to promote chemotaxis and outgrowth of CRC in liver prometastasis. 13
MIF is also expressed by the CRC tumor cells themselves. Using immunohistochemistry (IHC), both Legendre et al. 14 and He et al. 15 demonstrated that MIF was expressed at clearly higher levels in cancer cells of the primary tumor compared to normal colon epithelial cells. The staining was primarily intracellular. Notably, in both studies, staining intensity in primary tumors was not related to tumor–node–metastasis (TNM) stage or prognosis. Interestingly, in the study by He and coworkers, it was shown that serum levels of MIF were significantly higher in CRC patients than in serum of healthy individuals and of patients with colon adenomas. 15
In this study, we investigated the prognostic value of MIF-1 mRNA analysis of regional lymph nodes of patients with CC using a new highly specific quantitative reverse transcriptase–polymerase chain reaction (qRT-PCR) assay with RNA copy standard for the determination of absolute expression levels. MIF-1 mRNA levels were correlated to the levels of mRNA for the tumor marker carcinoembryonic antigen (CEA) and to disease-free survival and risk of recurrent disease. Despite high expression levels in lymph nodes of stage IV patients and in hematoxylin-eosin (H&E(+)) nodes and a significant difference between patients expressing high or low MIF-1 mRNA levels at a cutoff level of 2.19 copies/18S rRNA, MIF-1 mRNA analysis is probably not useful as a prognostic marker in clinical practice because the difference was small.
Materials and methods
Patients and tissue specimens for mRNA analysis
Primary tumor specimens from 69 CC patients were retrieved after surgery. None of the patients received neoadjuvant therapy. The tumor samples, approximately 0.5 × 0.5 × 0.5 cm in size, were collected immediately after resection, snap-frozen, and stored at −70°C until RNA extraction. Normal colon samples, retrieved from the proximal or distal resection margin of CC tumors, were collected from 30 of the patients and treated the same way. The clinical characteristics of the CC patients donating primary tumor and control colon tissue are shown in Table 1.
Clinical characteristics of CC patients who donated primary tumor tissue, control colon tissue, and lymph nodes for mRNA analysis.
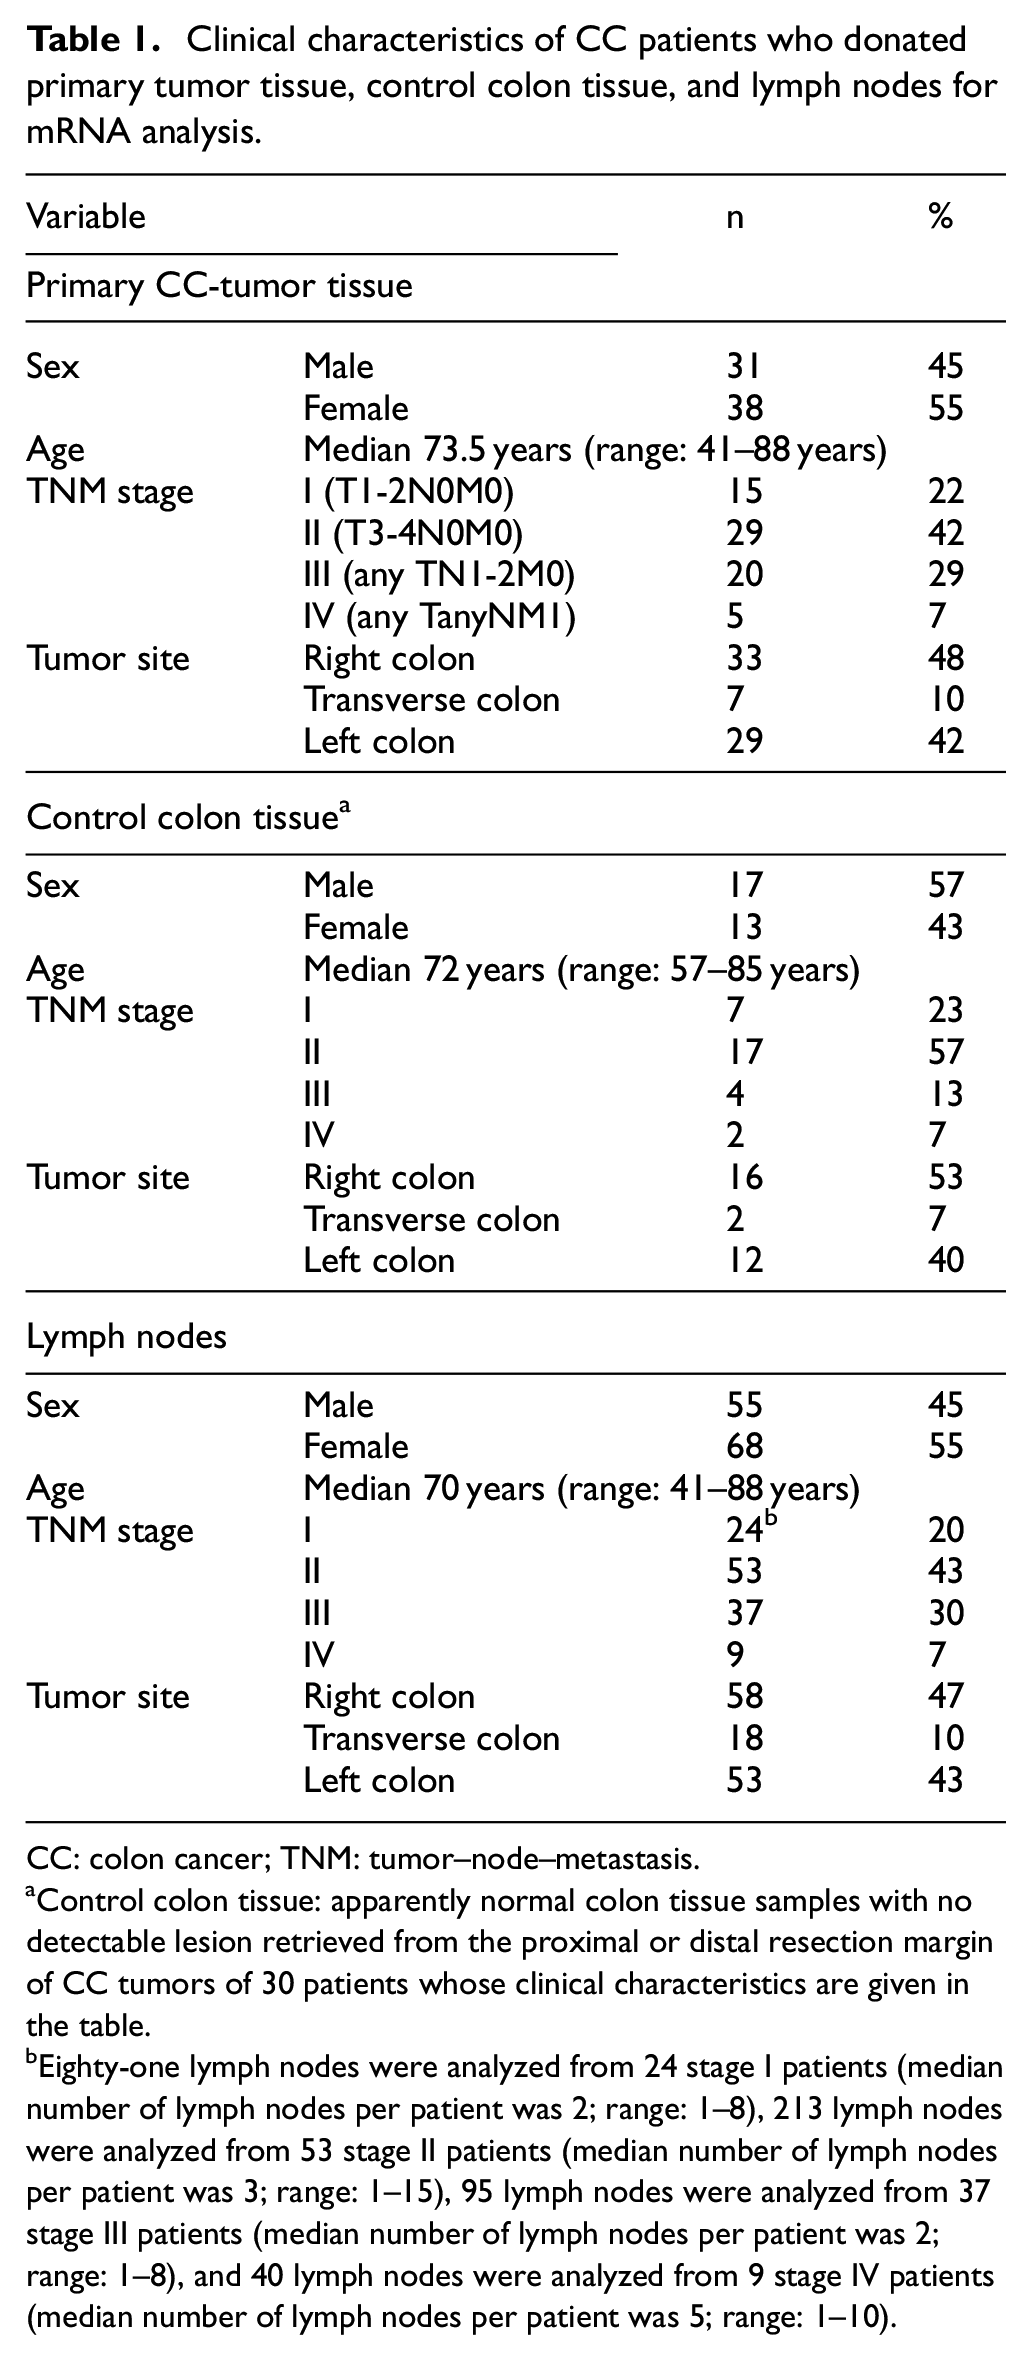
CC: colon cancer; TNM: tumor–node–metastasis.
Control colon tissue: apparently normal colon tissue samples with no detectable lesion retrieved from the proximal or distal resection margin of CC tumors of 30 patients whose clinical characteristics are given in the table.
Eighty-one lymph nodes were analyzed from 24 stage I patients (median number of lymph nodes per patient was 2; range: 1–8), 213 lymph nodes were analyzed from 53 stage II patients (median number of lymph nodes per patient was 3; range: 1–15), 95 lymph nodes were analyzed from 37 stage III patients (median number of lymph nodes per patient was 2; range: 1–8), and 40 lymph nodes were analyzed from 9 stage IV patients (median number of lymph nodes per patient was 5; range: 1–10).
Lymph nodes were collected from the resected specimens of 123 CC patients; 429 lymph nodes from these patients were analyzed. Table 1 shows the clinical characteristics of the patients donating lymph nodes and, in addition, the number of lymph nodes analyzed from each TNM stage. Out of a total 123 CC patients, 69 were investigated for both their lymph nodes and primary tumors. For primary tumors and normal colon tissue, the number of samples which were from the same patients was 30. In addition, 84 control lymph nodes were from 14 patients (median age: 23 years, range: 9–32) with ulcerative colitis (n = 12), Crohn’s disease (n = 1), and lipoma (n = 1). Median number of lymph nodes per patient was 5 (range: 1–13).
Cell lines and peripheral blood mononuclear cells
The human CC cell lines LS174T, HT29, T84, HCT8, and Caco-2 were used. T-cell line (Jurkat), B-cell lines (CNB6 + KR4), plasma cell line (U266), monocyte cell line (U937), granulocyte cell line (HL60), pre-erythrocyte cell line (K562), and primary foreskin fibroblast cells (FSU) were also used. 16 Peripheral blood mononuclear cells (PBMCs) were isolated from five healthy adults by Ficoll-Isopaque gradient centrifugation. Polyclonal activation of PBMCs was performed as described. 16
Patients and tissue specimens for immunohistochemistry
Primary tumor tissue specimens from 10 CC patients from stages I to IV obtained after surgery were studied. None of the patients received treatment before surgery. Normal colon tissue specimens were also obtained from nine CC patients and were taken distant to any macroscopically detectable lesions.
Lymph nodes were collected from 10 CC patients. Six non-metastatic lymph nodes (H&E(–)) were obtained from five patients, and six metastatic (H&E(+)) lymph nodes were obtained from five patients. The clinical characteristics of the CC patients donating primary tumors, control colon tissue, and lymph nodes are shown in Table 2.
Clinical characteristics of CC patients who donated primary tumor tissue, control colon tissue, and lymph nodes for IHC analysis.

CC: colon cancer; TNM: tumor–node–metastasis; IHC: immunohistochemistry.
Control colon tissue: apparently normal colon tissue samples with no detectable lesion retrieved from the proximal or distal resection margin of CC tumors of nine patients whose clinical characteristics are given in the table.
Six H&E(–) lymph nodes were analyzed from five stage I, II, and III patients, and six H&E(+) lymph nodes were analyzed from five stage III patients.
RNA preparation and real-time qRT-PCR
Total RNA was extracted using the acid–guanidine–phenol–chloroform method as described earlier. 16
To determine the absolute expression levels of MIF-1 mRNA in the clinical material, a real-time qRT-PCR assay with RNA copy standard was constructed using specific primer pairs placed in different exons together with a reporter dye-labeled probe hybridizing over the exon boundary in the amplicon. The qRT-PCR was performed using the 3′-primer as template for reverse transcription and Tth DNA polymerase (LightCycler 480 RNA master hydrolysis probes, Cat. No. 04991885001; Roche, Mannheim, Germany) as reverse transcriptase and polymerase. Primer and probe sequences were forward primer 5′-TCACCCAGCAGCTGGC-3′, reverse primer 5′-TGGTCCCGG ACCAGCT-3′, and probe 5′-CCCCCCAGTACATCG-3′. The reporter dye was fluorescein amidite (FAM) and the quencher dye minor groove binder (MGB). The RT-PCR profile was 50°C for 2 min, 60°C for 30 min, 95°C for 5 min followed by 45 cycles of 95°C for 20 s and 60°C for 1 min. The RNA copy standard was prepared as previously described. 17 Serial dilutions of the RNA copy standard at concentrations from 103 to 108 copies per microliter were included in each qRT-PCR run. Concentrations in unknown samples were determined from the standard curve and expressed as copies of mRNA per microliter. The assay does not detect MIF-2, which only shows 34% sequence identity with MIF-1. 18
The concentration of 18S rRNA was determined in each sample by real-time qRT-PCR (Applied Biosystems) as described before. 19 Emission from the released reporter dye in the PCR reaction was measured by the StepOnePlus™ Real-Time PCR Systems (Applied Biosystems, Foster City, CA, USA). Results from qRT-PCR analysis were expressed as mRNA copies per unit of 18S rRNA.
Antibodies and substrate
The monoclonal antibodies (mAbs) used in IHC were anti-MIF (IgG1, M01, Clone 2A10-4D3; Abnova, Stonesfield, UK) and anti-CEA mAb (IgG1; clone II-7; Dako, Glostrup, Denmark) and mouse IgG, ready to use (Dako), served as negative control. Anti-mouse Ig ImmPress enhancement reagents kit was used as secondary reagent (Vector Laboratories, Burlingame, CA, USA). The substrate was 3,3′-diaminobenzidine (DAB; Vector Laboratories).
For immunofluorescence, the mAbs used were fluorescein isothiocyanate (FITC)-conjugated anti-epithelial cell mAb BerEP4 (F0860, lot 00059670; Dako) and unconjugated anti-MIF mAb. Alexa Fluor® 594-conjugated goat anti-mouse IgG (ab150116; Abcam, Cambridge, MA, USA) was used as secondary antibody. Anti-CEA mAb was used as a positive control for indirect staining and FITC-conjugated mouse IgG2b (X0959; Dako) as a negative control.
Immunohistochemistry and immunomorphometry
Briefly, as previously described, 20 the sections were fixed with 4% paraformaldehyde, incubated with primary mAbs (anti-MIF, 1:50 and anti-CEA, 1:60) and subsequently incubated with secondary antibody conjugate, ImmPress anti-mouse Ig. The bound peroxidase was revealed by incubation with the substrate DAB. Quantification of number positive cells was performed according to Weibel. 21 Consecutive sections were stained with anti-MIF and anti-CEA mAb, respectively.
Two-color immunofluorescence
Sections of tumor tissues were fixed as described above and incubated with the anti-MIF mAb, followed by the Alexa Fluor® 594-conjugated goat anti-mouse Ig (red). Subsequently, sections were incubated with FITC-conjugated BerEP4 (green). Double positive cells develop a yellow–orange color. Microscopy was performed using a Nikon fluorescence microscope, and images were analyzed with NIS Elements software.
Statistical analysis
The statistical significance of differences of number of MIF positive cells in primary tumors compared to normal colon tissue as well as MIF mRNA levels in primary tumor tissue compared to normal colon tissue as well as CC lymph nodes compared to control lymph nodes was calculated using two-tailed Mann–Whitney rank sum test. Correlation between MIF and CEA mRNA levels was analyzed using the nonparametric Spearman correlation coefficient. Descriptive values are expressed as mean ± standard error of the mean (SEM) for immunomorphometric analysis and median for mRNA levels. The software utilized for statistical calculations was GraphPad Prism 6 (GraphPad Software, San Diego, CA, USA). Differences between patient groups in disease-free survival and risk for recurrent disease after surgery were calculated according to Kaplan–Meier survival model in combination with the log-rank test and univariate Cox regression analysis. Patients who died from causes other than CC were considered disease-free. Descriptive values of risk and survival time are given as mean and 95% confidence interval (CI). The software utilized was SPSS version 24 (IBM Corporation, Armonk, NY, USA). Correlations between mRNA levels, differences in mRNA levels, differences in survival time, and hazard ratios with a p value <.05 were considered statistically significant.
Results
MIF-1 mRNA levels in primary CC tumors, CC cell lines, immune cell lines, PBMCs, and a fibroblast cell line
MIF-1 mRNA was expressed at a median of 12.4 copies/18S rRNA unit (interquartile range (IQR): 8.4–25.3; range: 0.35–273) in primary CC tumors (n = 69) and at similar levels in five CC cell lines (Table 3 and Figure 1(a)). The median expression level of MIF-1 mRNA was 60 times higher than that of normal colonic tissue (Table 3 and Figure 1(a)), a significant difference (p < .0001). However, MIF-1 mRNA was also expressed in all immune cell lines (especially in monocytes and T-cell lines) and in resting and activated PBMCs and in the fibroblast cell line FSU (Table 3). These levels were closely similar to those of primary CC tumors. For comparison, we also determined the CEA mRNA levels in these cells (Table 3), demonstrating a very different expression pattern with high expression in CC tumors only.
Expression levels of MIF-1 and CEA mRNAs in primary CC tumors, CC- and leukocyte cell lines, and freshly isolated PBMCs, and PBMCs stimulated with polyclonal T cell activator.
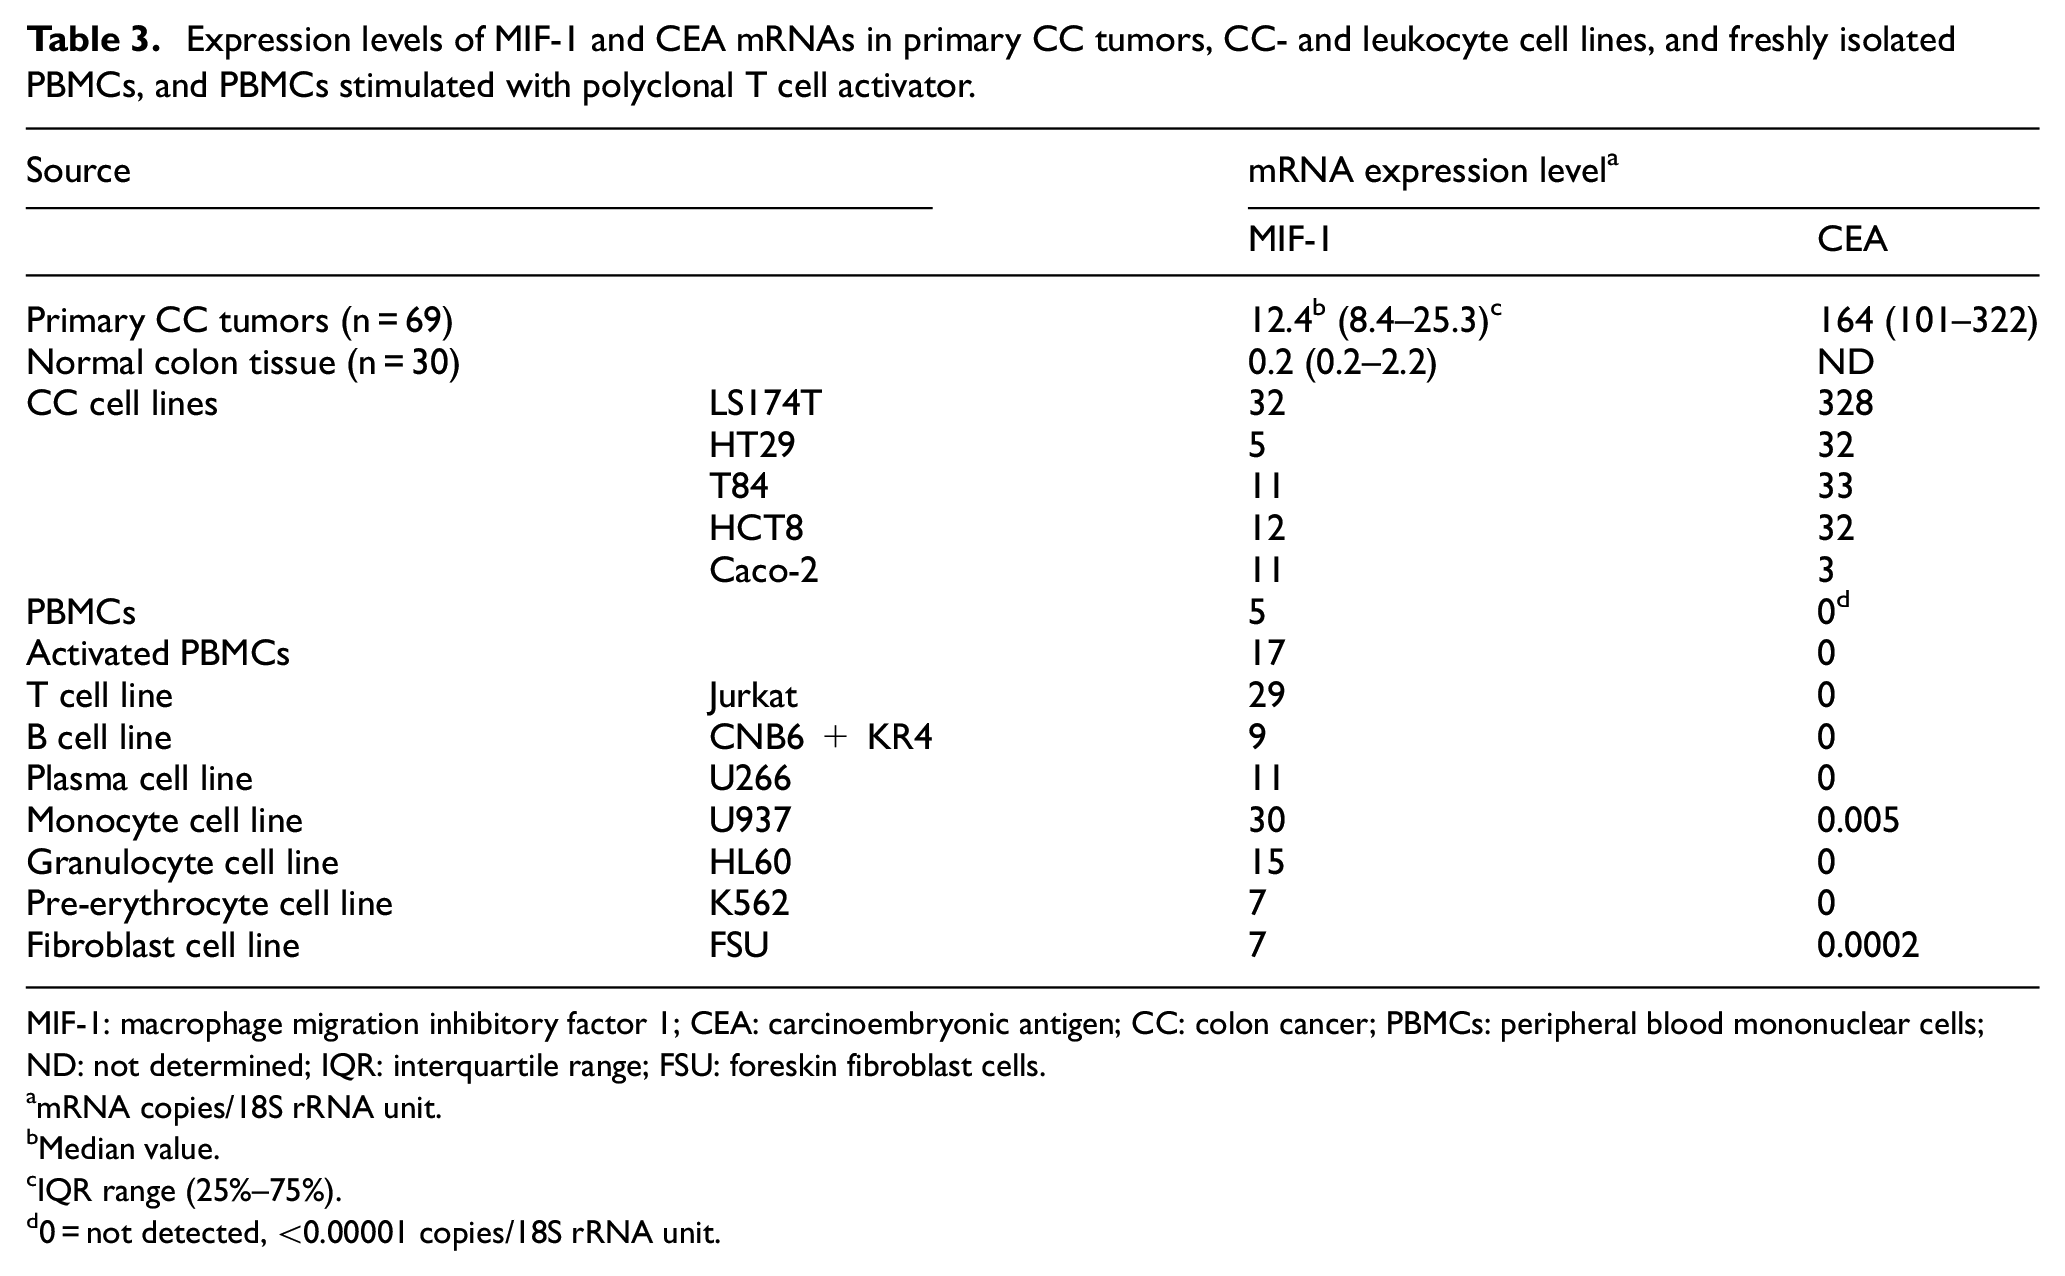
MIF-1: macrophage migration inhibitory factor 1; CEA: carcinoembryonic antigen; CC: colon cancer; PBMCs: peripheral blood mononuclear cells; ND: not determined; IQR: interquartile range; FSU: foreskin fibroblast cells.
mRNA copies/18S rRNA unit.
Median value.
IQR range (25%–75%).
0 = not detected, <0.00001 copies/18S rRNA unit.

mRNA expression levels of MIF-1 in primary colon cancer tissues (CC) and in lymph nodes. (a) MIF-1 mRNA levels in CC and resected normal colon (CTR). (b) MIF-1 mRNA levels in metastatic (H&E(+)) and non-metastatic (H&E(–)) lymph nodes. (c) MIF-1 mRNA levels in lymph nodes from noncancerous disease patients (CTR) and CC patients in different TNM stages (stages I–IV). (d) MIF-1 mRNA levels in relation to CEA mRNA levels. All lymph nodes (n = 429) from CC patients (n = 123) were divided into three groups according to their CEA mRNA content measured as CEA mRNA copies/18S rRNA unit (CEA(+) = CEA mRNA levels > 3.67 copies/18S rRNA unit, CEA(int) = CEA with intermediate mRNA levels, that is, 0.013–3.67 copies/18S rRNA unit, and CEA(–) = CEA mRNA levels < 0.013 copies/18S rRNA unit). Correlation between mRNA levels of MIF-1 and mRNA levels of CEA (e) in the highest lymph node in stage IV and (f) in H&E(+) lymph nodes. mRNA levels are given as mRNA copies/18S rRNA unit. All samples were analyzed in triplicates. The p values were calculated by two-tailed Mann–Whitney t-test for comparison between expression levels in (a) and (b), and by Kruskal–Wallis nonparametric ANOVA followed by a post hoc Dunn’s test for multiple comparisons in (c) and (d). Statistically significant differences are given. Black horizontal lines indicate medians. n = number of samples. The correlation coefficients (r) and the p values were calculated by two-tailed Spearman’s rank order correlation test.
MIF-1 mRNA levels in lymph nodes from CC patients and controls
A total of 429 lymph nodes from 123 CC patients representing all four TNM stages and 84 nodes from 14 non-CC control patients were investigated for the expression levels of MIF-1 mRNA. A significant difference in mRNA expression levels was found between H&E(+) lymph nodes and H&E(–) lymph nodes (Figure 1(b); medians 8.2 and 3.1 copies/18S rRNA unit, respectively, p < .0001). The median MIF-1 levels in lymph nodes from patients classified according to TNM stages I to IV were 3.17, 3.04, 3.02, and 6.14 copies/18S rRNA unit, respectively. Only lymph nodes from stage IV CC patients were significantly different from controls (median value 3.07 copies/18S rRNA unit; p = .001) and from nodes of the other CC stages (I–III; Figure 1(c)). The lymph nodes were also divided according to their CEA mRNA values, as previously described, 16 that is, into CEA(–) nodes with CEA mRNA values below the highest control node (<0.013 copies/unit), CEA(int) nodes with CEA mRNA values higher than control nodes but below the clinical cutoff determined by Cox regression (0.013–3.67 copies/unit), and CEA(+) nodes with CEA mRNA values above the clinical cutoff (>3.67 copies/unit). We found that the MIF-1 values in the CEA(+) group were significantly higher than the other two groups (Figure 1(d); p < .0001 for both comparisons). A high correlation coefficient between MIF-1 mRNA and CEA mRNA was only found for stage IV patients and for H&E(+) lymph nodes (Figure 1(e) and (f); r = 0.6, p = .002 and r = 0.5, p = .006, respectively). Together, these results indicate that high levels of MIF-1 mRNA are expressed in advanced CC.
Clinical utility of MIF-1 mRNA analysis of lymph nodes from CC patients
To investigate the clinical utility of analyzing MIF-1 mRNA expression in lymph nodes for predicting tumor recurrence, hazard risk ratio was calculated using Cox regression analysis. Each patient was represented by the lymph node with the highest MIF-1 level. The patients were divided into five groups according to the 20th, 40th, 60th, and 80th percentiles of the MIF-1 mRNA values, corresponding to cutoff values of <2.19, 2.19–3.65, 3.65–5.17, 5.17–8.36, and >8.36 copies/unit, respectively. The patients were followed for 12 years. The second group differed significantly from the group with the lowest expression values with hazard ratio = 4.5-fold (p = .02), but no significant effect was observed in the mean survival time. The second group was combined with the third, fourth, and fifth groups and termed MIF-1(+) and the first group termed MIF-1(–). This procedure yielded a cutoff level of 2.19 copies/unit. Patients in the MIF-1(+) group showed a 3.5-fold (p = .03) increased recurrence rate as compared to the MIF-1(–) group. The difference in mean survival time according to Kaplan–Meier analysis between the two groups was 7 months at 12 years follow-up (p = .03; Figure 2).

Kaplan–Meier cumulative survival curves for CC patients divided into the two groups, MIF-1(+) and MIF-1(–), according to the 20th percentile of the MIF mRNA values (= 2.19 mRNA copies/18S rRNA unit).
Risk for recurrence and survival time after surgery are not correlated to MIF-1 mRNA levels in primary CC tumors
No difference in recurrence risk or survival time was seen in CC patients divided into two groups at the 50th percentile of the MIF-1 mRNA values of primary CC tumors corresponding to a cutoff level of 12.37 copies/unit. A significant correlation, but with a low coefficient, was found between MIF-1 mRNA levels in primary tumors and lymph nodes of CC patients (r = 0.3, p = .03).
Expression of MIF protein in CC tumors, normal colon tissue, and lymph nodes as determined by IHC
To ascertain that tumor cells indeed expressed MIF protein, we performed two-color immunofluorescence experiments using anti-MIF mAb (Figure 3(a); red) and the anti-epithelial cell mAb BerEP4 (Figure 3(b); green). The overlay picture (Figure 3(c); yellow) demonstrated that a large number of the primary tumor cells expressed both markers. While MIF protein appears to be expressed both intracellularly and at the cell surface the expression of the epithelial cell marker, EpCAM was limited to the cell surface.

Two-color immunofluorescence staining of primary colon cancer tissue with anti-MIF and the anti-epithelial cell mAb, BerEP4: (a) Anti-MIF = red color, (b) BerEP4 mAb = green color, and (c) Overlay = yellow color of many double-stained areas. Magnification: 200×.
In confirmation of the mRNA results, it was found that the frequency of MIF positive tumor cells in primary tumors was significantly higher than in epithelial cells of normal colon tissue (Supplementary Figure 1, and Figure 4; 19 vs. 2%, p = .002). No significant difference was found between tumor stromal cells (3%) and normal stromal cells (1%) (p = .6).

Immunoperoxidase staining of tissue sections of primary colon cancer (CC). (a) Anti-MIF staining of primary CC tissue, original magnification 100×. (b) Higher magnification of indicated area in (a), 400×. (c) Anti-MIF staining of resected normal colon tissue, original magnification 100×. (d) Higher magnification of indicated area in (c), 400×. (e) Negative control staining with mouse IgG of a resected normal colon tissue, original magnification 100×. (f) Higher magnification of indicated area in (e), 400×. Positive cells stained brown to black. Methyl green was used for counterstaining.
By applying the consecutive staining method on lymph nodes from CC patients, we demonstrated that many metastatic tumor cells express both MIF and CEA confirming that MIF is expressed by tumor cells in regional lymph nodes. Moreover, some stromal cells were also found to express MIF but not CEA (Figure 5). In non-metastatic lymph nodes, some stromal cells were also observed to express MIF.

Immunoperoxidase staining of tissue sections of lymph node metastases of colon cancer. (a) Anti-MIF staining of an H&E(+) lymph node of a CC patient, original magnification 100×. (b) Anti-CEA staining of an H&E(+) lymph node of a CC patient, original magnification 100×. (c) Higher magnification of indicated area in (a), 400×. (d) Higher magnification of indicated area in (b), 400×. (e) Anti-MIF staining of an H&E(–) lymph node of a CC patient, original magnification 100×. (f) Anti-CEA staining of an H&E(–) lymph node of a CC patient, original magnification 100×. (g) Negative control staining with mouse IgG of an H&E(–) lymph node of a CC patient, original magnification 100×. (h) Higher magnification of indicated area in (f), 400×.
Discussion
This study clearly demonstrates that MIF-1 mRNA is expressed at highly increased levels both in the primary tumor and in metastatic lymph nodes of CC patients. Overexpression of MIF-1 in these compartments is also seen at the protein level since strong staining was seen with the anti-MIF mAb used in the study in a significantly higher number of cells. In view of the low degree of sequence, identity between MIF-1 and MIF-2 (34%) it is unlikely that the mAb would also bind to MIF-2. Our results confirm previous immunohistochemical results with polyclonal antibodies by Legendre et al. 14 and He et al. 15 and, in addition, demonstrate overexpression at the mRNA level. Thus, it is possible to conclude that it is MIF-1 that is upregulated. Whether MIF-2 also is upregulated in CC cells remains to be investigated.
Furthermore, this study extends the analysis to regional lymph nodes. H&E positive lymph nodes had significantly higher levels of MIF-1 mRNA than H&E negative nodes. However, the median increase in expression levels was relatively small, only 2.7 times. Moreover, the total range of mRNA values in lymph nodes from stage I to IV CC patients varied within a narrow range of less than 2 orders of magnitude, most probably due to that many cell types including both T- and B-lymphocytes, plasma cells, and fibroblasts express similar levels of MIF-1 mRNA as CC-tumor cells. Thus, even if there is a clear increase in the expression of MIF-1 mRNA in CC-tumor cells compared to epithelial cells in normal colon tissue, this increase tends to drown in the background-level expression of MIF-1 mRNA caused by these other cell types.
When comparing MIF-1 mRNA expression levels in relation to cancer-specific death, we found that a cutoff level at 2.19 mRNA copies/18S rRNA unit discriminated between patients with relatively good prognosis and poor prognosis. Patients with higher mRNA levels of MIF-1 in their lymph nodes had a higher risk for recurrence of 3.5-fold (p = .04) and lower mean survival time of 7 months (p = .03). Although significant, this difference is probably too small to be useful in clinical practice particularly if compared with other biomarkers such as CEA, KLK6, CXCL17, CXCL16, or GPR35.16,22–25
In conclusion, MIF-1 is overexpressed in primary tumors and regional lymph nodes of CC patients confirming its important role in the development and progression of CC as ascertained from several important functional studies. It would be interesting to study if MIF-2 has a more restricted cell-type distribution, and therefore may serve as a progression marker in CC.
Supplemental Material
Supplemenatry_Figure_1 – Supplemental material for Evaluating macrophage migration inhibitory factor 1 expression as a prognostic biomarker in colon cancer
Supplemental material, Supplemenatry_Figure_1 for Evaluating macrophage migration inhibitory factor 1 expression as a prognostic biomarker in colon cancer by Lina Olsson, Gudrun Lindmark, Marie-Louise Hammarström, Sten Hammarström and Basel Sitohy in Tumor Biology
Footnotes
Acknowledgements
We thank Ms. Anne Israelsson for skillful technical assistance.
Author contributions
B.S., L.O., M.-L.H., S.H., and G.L. conceived and designed the experiments. G.L. collected the surgical specimens. L.O. constructed the macrophage migration inhibitory factor 1 (MIF-1) quantitative reverse transcriptase–polymerase chain reaction (qRT-PCR) assay, and performed qRT-PCR determination of MIF-1 mRNA levels. B.S. performed two-color immunofluorescence and immunohistochemistry. B.S., S.H., M.-L.H., and L.O. analyzed the data. B.S., S.H., and M.-L.H. wrote the manuscript. All authors reviewed the manuscript.
Declaration of conflicting interests
The author(s) declared no potential conflicts of interest with respect to the research, authorship, and/or publication of this article.
Ethical approval
All procedures performed in studies involving human participants were in accordance with the ethical standards of the institutional research committee and with the 1964 Helsinki Declaration and its later amendments or comparable ethical standards.
Funding
The author(s) disclosed receipt of the following financial support for the research, authorship, and/or publication of this article: This work was financially supported by grants from the Swedish Research Council–Medicine and Health (B.S.), the Swedish Research Council–Natural and Engineering Sciences (M.-L.H.), the Medical Faculty of Umeå University (B.S. and M.-L.H.), the County Council of Västerbotten (B.S.), the Lions Cancer Research Fund (B.S.), and the Stig and Ragna Gorthon Foundation (G.L.).
Informed consent
Samples were collected after patients’ written, informed consent. The study was approved by the Local Ethics Research Committee of the Medical Faculty, Umeå University, Umeå, Sweden (Registration Number: 03-503).
Supplemental material
Supplemental material for this article is available online.
References
Supplementary Material
Please find the following supplemental material available below.
For Open Access articles published under a Creative Commons License, all supplemental material carries the same license as the article it is associated with.
For non-Open Access articles published, all supplemental material carries a non-exclusive license, and permission requests for re-use of supplemental material or any part of supplemental material shall be sent directly to the copyright owner as specified in the copyright notice associated with the article.