
Abstract
Gaining a better understanding of the biological properties of cell-free DNA constitutes an important step in the development of clinically meaningful cell-free DNA–based tests. Since the in vivo characterization of cell-free DNA is complicated by the immense heterogeneity of blood samples, an increasing number of in vitro cell culture experiments, which offer a greater level of control, are being conducted. However, cell culture studies are currently faced with three notable caveats. First, the concentration of cell-free DNA in vitro is relatively low. Second, the median amount and size of cell-free DNA in culture medium varies greatly between cell types. Third, the amount and size of cell-free DNA in the culture medium of a single cell line fluctuates over time. Although these are interesting findings, it can also be a great source of experimental confusion and emphasizes the importance of method optimization and standardization. Therefore, in this study, we compared five commonly used cell-free DNA quantification methods, including quantitative polymerase chain reaction, Qubit Double-Stranded DNA High Sensitivity assay, Quant-iT PicoGreen Assay, Bioanalyzer High Sensitivity DNA assay, and NanoDrop Onec. Analysis of the resulting data, along with an interpretation of theoretical values (i.e. the theoretical detection and quantification limits of the respective methods), enables the calculation of optimal conditions for several important preanalytical steps pertaining to each quantification method and different cell types, including the (1) time-point at which culture medium should be collected for cell-free DNA extraction, (2) amount of cell culture supernatant from which to isolate cell-free DNA, (3) volume of elution buffer, and (4) volume of cell-free DNA sample to use for quantification.
Introduction
Accumulating evidence indicates tremendous potential for cell-free DNA (cfDNA) as a non-invasive biomarker for the screening and management of various pathologies, such as cancer, 1 prenatal genetic abnormalities, 2 and cardiovascular disease. 3 However, as more researchers in the field are beginning to recognize, harnessing the full potential of cfDNA as a biomarker for routine clinical tests requires considerable improvements in our understanding of its molecular origin, 4 cellular origin,1,5 physical properties,6–8 and dynamics in blood circulation. 9 A firm understanding of these baseline values is essential for concrete interpretations concerning the associations between changes in the characteristics of cfDNA and the clinical manifestations of disease.
Since the characterization of cfDNA is complicated greatly by the immense heterogeneity of blood samples and the complexity of the in vivo setting,1,5,9,10 an increasing number of studies are assessing the utility of in vitro cell culture models to study the biological properties of cfDNA.11–15 Based on these studies, together with data compiled from eight characterized cell lines of previously published work 12 (HepG2, HeLa, HEK-293, RD, A375) and unpublished results (143B, HMEC-1, and PCS201010) (Figure 1), three important conclusions can be drawn from in vitro studies. First, the concentration of cfDNA in vitro is relatively low, ranging between 0.55 and 73.28 ng/mL with an average of 9 ng/mL (Figure 1). By contrast, in cancer patients, for example, cfDNA in plasma has been found to range between 0 and 4738 ng/mL with an average of 137 ng/mL. 16 This implies that the methodology used for the quantification of cfDNA derived from plasma cannot, in the majority of cases, be applied to the in vitro analysis of cfDNA without appropriate adjustments. Second, the average amount of cfDNA present in culture medium varies significantly between different human cell types when investigated under the same normal physiological conditions. For example, cervical adenocarcinoma (HeLa) cells have been shown to release a maximum of 11.65 ng into a 75 cm2 flask containing 12 mL culture medium, whereas hepatocellular carcinoma (HepG2) cells release a maximum of 879 ng (Figure 1). Third, the amount of cfDNA present in the culture medium of a single cell line fluctuates over different incubation periods. For some cell lines, such as HepG2 cells, the amount of cfDNA can change as much as eightfold over an incubation period of 80 h (Figure 1). In addition to the amount of cfDNA, these studies have also shown that the size of cfDNA differs between cell lines and varies for a single cell line when investigated at different time points.

Comparison of cell-free DNA levels in different human cell lines. The total mass of cell-free DNA (cfDNA) (left y-axis) present in the culture medium (12 mL in T-75 cell culture flasks) of hepatocellular carcinoma (HepG2), human dermal microvascular endothelium (HMEC-1), cervical adenocarcinoma (HeLa), human embryonal kidney (HEK-293), primary dermal fibroblast (PCS201010), rhabdomyosarcoma (RD), melanoma (A375), and human bone osteosarcoma (143B) cells, as measured after different periods of incubation following culture medium renewal. The graph was compiled from previously published data (HepG2, HeLa, HEK-293, RD, A375) and unpublished results (143B, HMEC-1, and PCS201010). Each data point represents a minimum of six replicates. For all cell lines, cfDNA was isolated with the NucleoSpin Gel and PCR Clean-up kit (Macherey-Nagel) and quantified with the Qubit™ dsDNA HS Assay Kit (Invitrogen, Life Technologies). The minimum and maximum amount of cfDNA, as well as the fold-change between these two values, present in the cell culture medium of different cell lines during the time course study is summarized on the right-hand side of the graph. Error bars indicate standard deviation.
Taken together, these findings underscore the importance of establishing the appropriate (1) time-point at which culture medium should be collected for cfDNA extraction; (2) amount of cell culture supernatant from which to isolate cfDNA; (3) volume of buffer in which to elute cfDNA; (4) volume of cfDNA sample to use for quantification; and perhaps most importantly (5) method to be used for quantification. Therefore, in this study, we compared five commonly used cfDNA quantification methods, including quantitative polymerase chain reaction (qPCR), Qubit Double-Stranded (dsDNA) High Sensitivity (HS) assay, Quant-iT PicoGreen Assay, Bioanalyzer HS DNA assay, and NanoDrop Onec. Using this data as a starting point, the optimal conditions (e.g. for points 1–4 above) prior to cfDNA quantification can be determined for each quantification method and for a range of experimental scenarios for each cell line of interest.
Materials and methods
Cell culturing and supernatant processing
The human dermal microvascular endothelial cell line (HMEC-1) was acquired from the American Type Culture Collection (ATCC® CRL-3243™). Cells were grown in MCDB-131 culture medium (PAN Biotech; cat #P04-80057, lot #3390618), supplemented with 10 ng/mL EGF Recombinant Human Protein (Thermo Fisher Scientific; cat #PHG0311, lot #2031430), 1 µg/mL Hydrocortisone (Merck; cat #H0888-1G, lot #SLBT5910), 20 mM L-Glutamine (Lonza; cat #17-605E, lot #8MB025), and fortified with 10% fetal bovine serum (FBS) (PAN Biotech; cat #P30-3302) and 1% penicillin/streptomycin (Lonza; cat #DE17-02E, lot #7MB159). Cells were incubated in humidified atmosphere containing 5% CO2 at 37°C. Approximately 2 million cells (#23) were seeded in eight 75 cm2 flasks (Thermo Fisher Scientific; cat #156472, lot #154474), respectively, containing 12 mL culture medium. The cells were then grown for 12 h, after which the culture medium was replenished. After this time, pairs of flasks were incubated for 24 h (experiment 1), 36 h (experiment 2), 56 h (experiment 3), and 80 h (experiment 4), respectively. These time points were selected in order to ensure that different cfDNA concentrations can be compared for quantification. Following incubation, the growth medium was collected in 15 mL nuclease-free conical tubes (CELLSTAR®, Greiner Bio-One; cat #1882714, lot #E16103T6), centrifuged at 1000 × g for 10 min and transferred to fresh 15 mL tubes. The samples were then stored at −80°C until extraction.
Isolation of cfDNA
cfDNA was extracted with the NucleoSpin Gel and Polymerase Chain Reaction (PCR) Clean-up kit (Macherey-Nagel, Düren, Germany; cat #740609250, lot #1801/007), according to the PCR clean-up protocol, with minor modifications. Briefly, samples were thawed at 37°C in a temperature controlled water bath. After incubation, the samples were vortexed and centrifuged briefly. For each biological replicate, cfDNA was extracted in duplicate from 1.7 mL of culture medium. Before extraction, samples were mixed with 3.4 mL of binding buffer NTB (sample-to-buffer ratio of 1:2). Samples were then vortexed, the entire volume of culture media added to the spin column in increments of 600 μL, and centrifuged at 11,000 × g for 1 min at room temperature. The columns were then washed twice and dried, followed by the elution of cfDNA into 20 μL of elution buffer.
Quantification of cfDNA
Qubit fluorometer 3.0
Quantification of cfDNA was performed using the Qubit® fluorometer 3.0 (Invitrogen, Life Technologies) in combination with the Qubit™ dsDNA HS Assay Kit (Invitrogen, Life technologies; cat #Q32851, lot #1724782). As per the manufacturer’s instructions, a standard curve was prepared using the 0 and 10 ng/μL Qubit standards provided in the kit. For all cfDNA extractions, 3 µL of sample was diluted in 197 µL Qubit working solution before measurement.
NanoDrop Onec Spectrophotometer
Quantification of cfDNA was performed by measuring the absorbance of 1 µL sample at 260 nm using a NanoDrop Onec Microvolume Ultraviolet–visible (UV–Vis) Spectrophotometer (Thermo Fisher Scientific, cat #ND-ONEC-W).
PicoGreen assay
Quantification of cfDNA was performed using a TECAN Safire plate reader (96-well format) in combination with the Quant-iT™ PicoGreen™ dsDNA Assay Kit (Molecular Probes, Invitrogen; cat #P11496, lot #1911829) according to the manufacturer’s instructions, with slight modifications. Briefly, 2 µL of sample was diluted in 498 µL TE buffer and then mixed with 500 µL of working solution (200:1 mixture of TE buffer (10 mM Tris-HCL, 1 mM ethylenediaminetetraacetic acid, pH 7.5) and Quant-iT PicoGreen reagent). Samples were quantified in triplicate (250 µL/well). The absolute concentration of the cfDNA was calculated by using a low-range standard curve, which consisted of five different dilutions of genomic DNA (Applied Biosystems, cat #4312660, lot #360486; 250, 1000, 2500, 5000 and 10,000 pg/μL). In this study, human genomic DNA was used to create the standard curve instead of the Lambda DNA included in the PicoGreen kit, since it has been reported that the use of Lambda DNA as a calibrator results in an overestimation of DNA concentration by a factor of 10. 17 Samples were excited at 480 nm and the fluorescence emission intensity was measured at 520 nm.
Agilent Bioanalyzer 2100
Quantification and sizing of cfDNA was performed by capillary electrophoresis (CE) using an Agilent 2100 Bioanalyzer (Agilent Technologies Inc., Santa Clara, CA) equipped with Expert 2100 software, in combination with a HS DNA microchip (Agilent Technologies, cat #5067-4627, lot #WG23BK50) and HS DNA kit (Agilent Technologies, cat #5067-4627, lot #1834). The assay was performed according to the instructions provided by the manufacturer. After the nucleic acids are separated analogously to CE, they are normalized to a ladder and two DNA markers, which are then represented as a virtual band. The software then automatically calculates the size and concentration of each band.
Real-time PCR
PCR amplification of cfDNA was measured using a real-time quantitative assay for the β-globin gene. All assays were performed on a LightCycler® 480 Instrument II (Roche) using a 96-well plate setup. The reaction mixture consisted of 1 μL DNA and 24 μL master mix, which was composed of 9.1 μL real-time PCR (RT-PCR) grade H2O (Invitrogen; cat # AM9935, lot #1804029), 12.5 μL TaqMan Universal MasterMix (Applied Biosystems; cat #4304437, lot #1805142), 0.4 μL of 10 μM dual fluorescent probe 5′-(FAM)AAG GTG AAC GTG GAT GAA GTT GGT GG(TAMRA)-3′, and 1 μL of 10 μM forward and reverse primers, respectively. The primers used were: F1, 5′-GTG CAC CTG ACT CCT GAG GAG A-3′, and R1, 5′-CCT TGA TAC CAA CCT GCC CAG-3′. The probe and primers were synthesized by TIB MOLBIO. PCR conditions were set to the following: 95°C for 10 min, followed by 45 cycles of 15 s denaturation at 95°C, 1 min annealing at 60°C, followed by 30 s extension at 72°C. Sequence data of β-globin is attainable from GenBank (accession number: U01317). The absolute concentration of the target gene was calculated using a standard curve. In this study, a standard curve was generated using five different genomic DNA dilutions (Applied Biosystems; cat #4312660, lot #360486) (25, 250, 1000, 2500, and 10,000 pg/μL, respectively). Each biological replicate was quantified in duplicate, and triplicates of the standard curve were included in each run (only assays with R2 values above 0.99 for the standard curve were used).
Statistics
All statistics were performed using GraphPad Prism software version 5.0 and Microsoft Excel. Differences between group means were calculated using one-way analysis of variance (ANOVA). Outliers were identified and omitted using the Grubbs’ test. The p values smaller than 0.05 were considered to be statistically significant. For each of the experiments, cfDNA was isolated from cell culture medium in duplicate (n = 2) and quantified at least in duplicate (n = 2).
Results
In this study, we used the cell culture supernatant from the HMEC-1 cell line as a source of cfDNA to compare five commonly used cfDNA quantification methods, including (1) qPCR, (2) Qubit dsDNA HS assay, (3) Quant-iT PicoGreen Assay, (4) Bioanalyzer HS DNA kit, and (5) NanoDrop Onec. All methods were able to detect cfDNA and showed good reproducibility between replicates (Figure 2). However, as determined by one-way ANOVA, the average cfDNA concentration showed wide variability across the different quantification methods and differed significantly from each other in all experiments (ANOVA p < 0.0001). In relation to qPCR, which is considered the gold standard for DNA quantification, the other methods overestimated the amount of cfDNA by the following percentages (average overestimation for experiment 1–experiment 4 ± standard deviation): Qubit dsDNA HS assay (22.4% ± 6.7 %), Quant-iT PicoGreen Assay (59.8% ± 9.9%), Bioanalyzer HS DNA kit (114.8% ± 16.3%), and NanoDrop Onec (247.6% ± 12.2%). Based on these results, the qPCR and Qubit methods deliver comparable cfDNA measurements. In contrast, there are greater discrepancies between qPCR and the other methods.
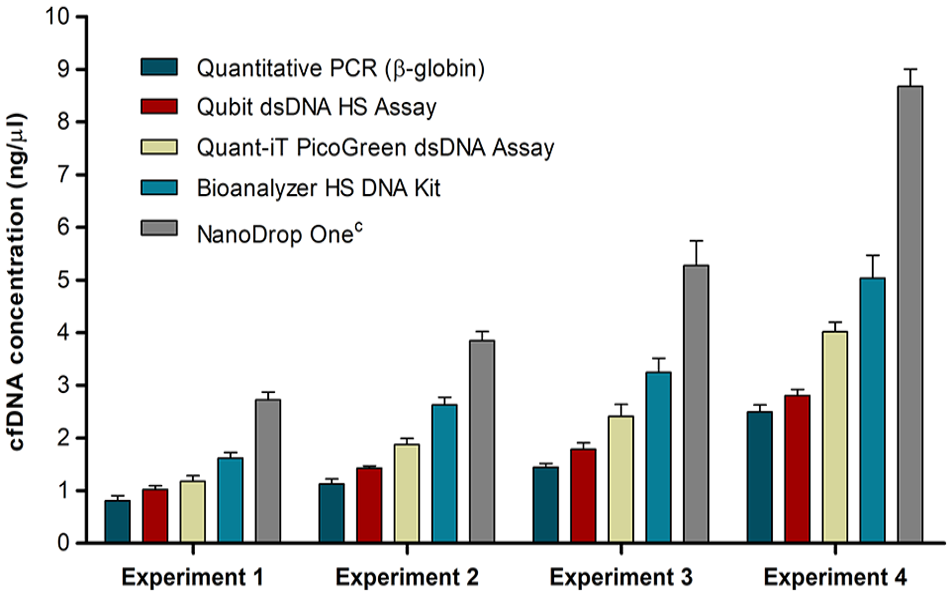
Comparison of cell-free DNA quantification methods. In order to evaluate the efficacy of different quantification methods for a range of cell-free DNA (cfDNA) quantities, cfDNA was isolated directly from the cell culture supernatant collected from human dermal microvascular endothelium (HMEC-1) cells after 24 h (experiment 1), 36 h (experiment 2), 56 h (experiment 3), and 80 h (experiment 4) of incubation, respectively, followed by quantification using commonly used methods, including qPCR (n = 3), Qubit dsDNA HS assay (n = 2), Quant-iT PicoGreen Assay (n = 4), Bioanalyzer HS DNA kit (n = 2), and NanoDrop Onec (n = 2). Each bar indicates the average concentration of cfDNA measured in two biological replicates (i.e. two cell culture flasks) and two isolation replicates. Error bars indicate the standard deviation. In all experiments, the average amount of cfDNA measured by each of the different quantification methods differed significantly (ANOVA p < 0.0001). In addition, the average amount of cfDNA measured by the same method over the different experiments differed significantly for all of the respective quantification methods (ANOVA p < 0.0001).
Discussion
The upper limit of quantification (ULOQ) for the Bioanalyzer HS DNA assay is 500 pg/µL. This means that more than twice the recommended amount of DNA was loaded onto the chip in this study (samples were not adjusted to lie within the detection range because the purpose of the study was to compare the performance of quantification methods for cfDNA samples of unknown concentration). Therefore, it is possible that the overestimation of cfDNA concentration can be explained partly by the effects of chip overloading. To test this, we measured samples with cfDNA concentrations that are within the detection range of the method (i.e. 82, 272, 404, and 424 pg/µL, respectively). In this case, we found that the concentration of cfDNA was still overrepresented by an average percentage of 61.6% ± 11.7%, similar to the values obtained by the Quant-iT PicoGreen Assay (results not shown). A possible explanation for this overrepresentation is discussed later in this section. Although the Bioanalyzer HS DNA assay is sensitive and demonstrates good quantitation accuracy (20% CV) and reproducibility (15% CV), its detection range is very narrow (5–500 pg/µL), and it is unlikely that the concentration of cfDNA in the majority of samples will fall within this range without adjusting the volume according to the concentration of cfDNA measured using an alternative method. An alternative to the HS DNA assay is the Bioanalyzer 12,000 Assay. While the latter assay has a slightly lower accuracy for both sizing and quantification, it does have the benefit of a broader detection range for both size (100–12,000 bp) and concentration (0.5–50 ng/µL). However, a major limitation of the Bioanalyzer chip-based assays for the quantification of cfDNA is their low throughput. Only 11 samples can be measured per chip in a single 45 min assay. In summary, this method is generally not suitable for first-line quantification of cfDNA, especially not in high capacity conditions.
In the case of the NanoDrop Onec, the amount of cfDNA may have been overestimated because the concentration of cfDNA (as determined by qPCR) in most samples were lower than the theoretical lower limit of quantification (LLOQ) of the instrument (i.e. 2 ng/µL). However, this overestimation was also observed in experiment 4, in which the concentration of cfDNA is above the LLOQ (2.49 ng/µL). It is not uncommon for the NanoDrop Onec instrument to overestimate DNA concentration, especially at very low levels and when there are trace amounts of residual organic solvents present after the extraction process. Another disadvantage of this method is that it cannot distinguish between dsDNA, single-stranded DNA, oligonucleotides, and free nucleotides. Therefore, while the accuracy may improve at much higher cfDNA concentrations, we argue that this method does not show enough sensitivity and is generally not applicable for the purpose of accurately quantifying cfDNA derived from cell cultures.
An explanation for the difference in cfDNA concentration measured by qPCR, PicoGreen, and the NanoDrop Onec instrument is the difference in their ability to accurately quantify different fragment sizes of cfDNA. For example, in one study, genomic DNA was sheared into size populations of 1500, 500, and 150 bp, respectively. Compared with intact (unfragmented) DNA, qPCR measurements showed a 67% reduction in the concentration for DNA fragments with a size of 150 bp, while PicoGreen measurements only showed a 29% reduction. 17 In the case of qPCR, the sharp decrease in the amount of DNA measured can be explained by the attrition of primer annealing sequences by fragmentation. This should be more pronounced when longer amplicons are targeted for amplification. It is not clear why PicoGreen shows a reduction in signal. Interestingly, the amount of DNA measured by the NanoDrop instrument was not affected by fragmentation to 150 bp, probably because fragmentation does not affect absorbance measurements, as discussed earlier. These effects have also been observed by other research groups.18–20 As shown in Figure 3, the majority of cfDNA measured in every experiment of this study was around 166 bp and may therefore explain why the PicoGreen and NanoDrop assays have measured higher levels of cfDNA. To the best of our knowledge, both the Qubit HS DNA assay and the Bioanalyzer HS DNA assay have not yet been included in such a comparative study. Therefore, we cannot state with complete confidence that these methods are also more apt than qPCR at quantifying short fragments of cfDNA.

Cell-free DNA size profiles. Capillary electropherogram showing the size of cell-free DNA (cfDNA) isolated from the cell culture supernatant of human dermal microvascular endothelial (HMEC-1) cells after 24 h (experiment 1), 36 h (experiment 2), 56 h (experiment 3), and 80 h (experiment 4) of incubation following medium renewal, respectively. The peaks at 35 and 10,000 bp correspond to the two internal size markers. The relative fluorescence (y-axis) of these markers are used to calculate the size of the unknown cfDNA samples (x-axis). Thus, any deviation from the baseline, excluding the markers, indicates the size of cfDNA.
Another issue regarding the design of qPCR assays involves uncertainty concerning the efficacy of housekeeping genes (HKGs). Due to their low level of expression variability over a wide range of cellular changes and experimental conditions, specific sequences within HKGs are often targeted for cfDNA quantification. However, they may not always be representative of the total amount of cfDNA. For example, in a previous study in which eight HKGs were compared for the quantification of cfDNA across four cell lines, it was found that the amount of HKGs differ significantly in the cell culture supernatant between different cell lines. Furthermore, some HKGs that are expressed intracellularly were not detected as cfDNA extracellularly. 21
Based on these findings, it seems plausible that the other methods have not significantly overestimated cfDNA concentration, but that qPCR has actually underestimated cfDNA concentration. The accuracy of qPCR quantification can possibly be improved by either targeting (1) more than one HKG in parallel (e.g. β-actin, ERV, and GAPDH), (2) HKGs with different amplicon lengths (e.g. B-actin 41 bp vs B-actin 127 bp, or L1PA2 90 bp vs L1PA2 247 bp), (3) several genomic loci (e.g. the InviQuant GeneCount 40 qPCR workflow allows the detection of 40 random genomic loci), or (4) sequences that are more abundant in the human genome, such as the repetitive DNA elements LINE-1 (e.g. L1PA2) and Alu. These primer sequences are summarized in Table 1. However, it can also be argued that cfDNA levels can be determined most accurately only by a combination of different methods, such as calculating an average from qPCR and Qubit or PicoGreen measurements.
qPCR targets for the quantification of cell-free DNA (cfDNA).

Although all quantification methods were able to detect cfDNA from HMEC-1 cells in this study, not all cell lines are characterized by a high concentration of cfDNA (as shown in Figure 1). Therefore, not all methods are appropriate for all cell lines and all experimental conditions. Based on data shown in Figure 1, we calculated both the minimum and maximum concentration (pg/µL) of cfDNA that will be obtained for each cell line when cfDNA is isolated from 0.7, 1.7, 6, and 12 mL of cell culture supernatant, respectively, and eluted in 20 µL buffer TE (summarized in Table 2). By comparing these values with the theoretical LLOQs and ULOQs for each method, the appropriate quantification method can be determined for each cell line and experimental scenario.
The minimum and maximum concentrations of cfDNA (pg/µL) measured for eight different cell lines when different volumes of cell culture supernatant are used for cfDNA isolation (all samples are assumed to be eluted in a total of 20 µL TE buffer).

qPCR: quantitative polymerase chain reaction; dsDNA: double-stranded DNA; HS: high sensitivity.
For each quantification method, beige colored blocks indicate that the concentration of cfDNA lies within the theoretical quantification range of the method, while pink colored blocks indicate that the concentration of cfDNA lies outside the theoretical detection range of the method.
For example, according to these results, qPCR (using β-globin) and the Quant-iT PicoGreen Assay can be used to accurately quantify both the minimum and maximum amount of cfDNA for all cell lines in all experimental conditions, even when as little as 0.7 mL of cell culture supernatant is used for cfDNA isolation. However, we should caution that when the PicoGreen method was adapted from a 2 mL assay volume (for measurement in a cuvette, as recommended by the manufacturer) to an assay volume of 250 µL (for measurement in a 96-well plate), the lowest standard that could be distinguished from the blank measurement was 250 pg/µL, and not 25 pg/µL as would be the case when 2 mL is measured in a cuvette. In this case, cfDNA should either be isolated from 6 mL of cell culture supernatant or, when a smaller volume is used, approximately 5–10 µL of the extracted cfDNA sample should be used for quantification. Regarding the Qubit dsDNA HS assay, both the minimum and maximum amounts of cfDNA for all cell lines can only be detected by the method when more than 6 mL of cell culture supernatant is used for cfDNA isolation. However, since as much as 20 µL of cfDNA sample can be used for quantification, this method will also be able to detect the minimum and maximum amounts of cfDNA for all cell lines, even when 0.7 mL of cell culture supernatant is used for isolation, provided that approximately 5–10 µL of cfDNA is used for quantification. When either 0.7 or 1.7 mL of cell culture supernatant is used for cfDNA isolation, the Bioanalyzer HS DNA kit should be able to quantify cfDNA. However, when more than 6 mL of cell culture supernatant is used for cfDNA isolation, the cfDNA concentration of most samples will exceed the detection range of the method. In contrast, the NanoDrop Onec instrument can only accurately quantify the minimum amount of cfDNA of two cell lines (HepG2 and HMEC-1) and maximum amount of cfDNA in five cell lines (HepG2, HMEC-1, HEK-293, RD, and 143B), provided that all cell culture medium (12 mL) is used for cfDNA isolation.
Barring quantification, other downstream uses of cfDNA often require a greater amount, such as DNA sequence determination or epigenetic characterization. According to previous findings, 28 the yield of cfDNA from cell cultures can be increased by several strategies, including: (1) processing collected cell culture supernatant once at 10,000 × g before storage (it should be cautioned that it is not yet known whether the increased amount of cfDNA is a result of cell lysis due to greater centrifugal forces), (2) storing cell culture supernatant at –80°C instead of 4°C, (3) storing cell culture supernatant in 15 mL tubes instead of 1.5 mL Eppendorf tubes, (4) thawing cell culture supernatant at 37°C instead of room temperature, (5) eluting in 60 µL of TE buffer instead of 20 µL, (6) eluting samples in three steps of 20 µL instead of one step of 60 µL. Besides these approaches, cfDNA yield can be increased significantly by treating the cell culture supernatant with denaturing agents (e.g. SDS and proteinase K) prior to extraction, or selecting an extraction kit that delivers a higher yield of cfDNA. Finally, more cfDNA can be obtained by culturing cells in 175 cm2 flasks and roughly 30 mL culture medium. To simplify the extraction of cfDNA from large volumes, the culture media can be drawn through the spin columns using a vacuum manifold and pump setup.
Conclusion
The characteristics of cfDNA present in cell culture medium changes over the course of incubation, and seems to be dependent on various cellular conditions (e.g. apoptosis levels, glucose consumption rate, proliferation rate, cell cycle phase, etc.).4,11–15 Consequently, the concentration and size of cfDNA measured at any instance may differ significantly for a single cell line and between cell lines. For example, some cell lines may be characterized by a low concentration of high molecular weight cfDNA, while others may be characterized by a high concentration of low molecular weight DNA. This may also be the case for a single cell line when investigated at different time points. In addition, the concentration of cfDNA in cell culture supernatant is generally much lower than in human blood. This indicates that (1) the methodology used for the quantification of cfDNA isolated from human samples (e.g. serum or plasma) cannot be applied to the in vitro analysis of cfDNA without proper adjustments, and (2) the appropriate quantification method and preanalytical conditions should be identified for a specific cell line and experimental setting.
The findings reported in this article, in combination with an understanding of theoretical values, can be considered by researchers for selecting a quantification method and corresponding preanalytical steps that are appropriate for a specific cell line and the aims of an experiment (similar to the approach followed in Table 2). A guideline that is suitable to any set of conditions will be exhaustive and, therefore, beyond the scope of this article. However, the following general recommendations can be made:
Real-time qPCR is biased toward size and specific genomic loci, and may thus give inaccurate results when the cfDNA population in a sample is biologically and structurally diverse. More accurate qPCR measurements can be obtained by targeting a variety of differently sized amplicons in parallel assays. The use of qPCR is ideal in cases where the concentration of isolated cfDNA is low and only a small fraction of the sample (e.g. 2–6 µL of a 20–30 µL elution) can be allocated for quantification (e.g. quality control). Moreover, qPCR is highly sensitive and can be used to quantify cfDNA isolated from a small volume of cell culture supernatant (e.g. 0.7 mL), provided that cells are at a minimum confluency of 30%–50% in T-75 flasks containing 12 mL culture medium.
The Qubit dsDNA HS assay is a relatively simple method, and produces comparable measurements to qPCR, and as such may serve as a workable alternative. However, the Qubit dsDNA HS assay is not as sensitive as qPCR. Therefore, depending on the characteristics of the cell line, the experimental conditions need to be adjusted accordingly. When the total amount of cfDNA sample (i.e. 20 µL) is used for quantification, the Qubit dsDNA HS assay should be able to detect cfDNA from most cell lines when isolated from a small volume of cell culture supernatant (e.g. 0.7 mL), provided that cells are at a minimum confluency of 30%–50% in T-75 flasks containing 12 mL culture medium. Under the same conditions, the volume of eluted cfDNA sample needed for an accurate quantitation assay can be reduced to 2–4 µL when cfDNA is isolated from a minimum volume of 6 mL cell culture supernatant. Similarly, cfDNA can be isolated from a smaller volume of cell culture supernatant (e.g. 3 mL) when a smaller volume of elution buffer is used (e.g. 10 µL).
While each of the above methods may be useful for different purposes, it is likely that accurate quantification of total cfDNA levels may only be achievable through a combination of different methods, such as qPCR with several amplicons, Qubit dsDNA HS assay, and the PicoGreen assay. However, there is currently no optimal approach for the quantification of total cfDNA levels. The development of such a method may become imperative for confidently characterizing minor variations of different types of cfDNA molecules from its baseline values under different conditions.
Footnotes
Declaration of conflicting interests
The author(s) declared no potential conflicts of interest with respect to the research, authorship, and/or publication of this article.
Funding
The author(s) received no financial support for the research, authorship, and/or publication of this article.