
Abstract
The objective of the present feasibility study was to transfer single cell line cells to either microscopy slides for downstream immune characterization or to polymerase chain reaction tubes for downstream DNA quantitation. Tumour cell lines, SKBR3 and MCF7 and trophoblast cell line JEG-3 were spiked in healthy donor blood. The CytoTrack system was used to scan the spiked blood samples to identify target cells. Individual target cells were identified, picked by use of a CytoPicker and deposited to either a microscopic slide or a polymerase chain reaction tube (PCR). Single tumour cells on microscopic slides were further immunostained with human epidermal growth factor receptor 2 (Her2) and epithelial cell adhesion molecule (EpCAM). From the picked cells in polymerase chain reaction tubes, DNA was amplified, quantified and used for Short Tandem Repeat genotyping. Depositing rare cells to microscopy slides was laborious with only five cells per hour. In this study with a trained operator, the picked cells had an 80.5% recovery rate. Depositing single trophoblast cells in PCR tubes was a faster process with 10 cells in 5 min. Immunostaining of isolated cells by both Her2 and EpCAM was possible but showed varying staining intensity. Presence of trophoblasts and contaminating white blood cells in PCR tubes after cell picking was confirmed based on DNA yield and mixed Short Tandem Repeat profiles in five out of eight samples. Using the CytoPicker tool, single tumour and trophoblast cells were successfully isolated and moved from blood samples, allowing subsequent immunostaining or Short Tandem Repeat genotyping.
Introduction
Both circulating tumour cells (CTC) and foetal trophoblasts are rare cells in the blood stream. Rare cells are potential tools in precision medicine, and there is an ongoing interest for understanding their phenotypic and genotypic behaviour. A method to detect and collect the rare cells from other blood cells would be a valuable tool before further characterization. Single cell analysis is plausible with analysis such as fluorescence in situ hybridization (FISH), polymerase chain reaction (PCR), immunostains or massive parallel sequencing. 1
From cancerous sites, tumour cells may spread through the blood and lymphatic system to other parts of the body.2–4 A blood sample containing CTC is often referred to as a ‘liquid biopsy’ and may serve as a surrogate for the metastatic tumour. The number of CTC is prognostic, and specific CTC-related biomarkers may serve as additional diagnostic tools and reflect the discrepancy between local metastatic sites.1,5,6 In recent years, characterization of the human epidermal growth factor receptor 2 (HER2) expression profile of the primary tumour has been a success in the development of precision medicine. Hence, immune targeting of the receptor has prolonged survival and even decreased mortality rates among HER2 positive patients.7,8 Potentially, CTC HER2 expression profiles may prove valuable and assist personalized medicine in metastatic disease. 9 Additional molecular targets in CTC characterization, like epithelial cell adhesion molecule (EpCAM), may also become future predictive biomarkers, complying with the contemporary transition towards precision medicine.9,10
Other rare cells have potential to become valuable diagnostic tools. The presence of foetal trophoblasts in the peripheral blood stream of pregnant women has been recognized for a few decades. The isolation of those and down stream genetic analysis could become key in cell-based non-invasive prenatal diagnosis. 11
The CytoTrack procedure is a technique for rare cell isolation where all nucleated cells in a blood sample are scanned with the CytoTrack Scanner.12–16 The CytoTrack system automatically detects immune stained cells from blood samples smeared on a round glass disc (CytoDisc) using fluorescence microscopy. With the CytoPicker system, it is possible to manually select the cells and extract them from the CytoDisc™, which opens the possibility of analysing individual cells. We have previously shown that the CytoTrack system is able to detect rare cells, like CTC, from a blood sample.12–16 It is unknown if such rare cells can be transferred from the CytoDisc to microscopy slides and PCR tubes. The objective of the present feasibility study was to transfer single cell line cells to either microscopy slides for downstream HER2 and EpCAM immune characterization or to PCR tubes for downstream DNA quantitation and human identification Short Tandem Repeat (STR) genotyping.
Materials and methods
Cell cultures
For spiking experiments, the human breast cancer cell lines MCF7 and SKBR3 and the human placenta choriocarcinoma cell line JEG-3 were used (American Type Culture Collection (ATCC), Manassas, VA, USA). The MCF7, SKBR3 cancer-cells and JEG-3 trophoblast-cells were cultured in Dulbecco’s modified Eagle’s medium-GlutaMAX (Life Technologies™, Carlsbad, CA, USA) supplemented with 1% penicillin–streptomycin (Life Technologies) and 10% heat-inactivated foetal bovine serum (Life Technologies). All cell lines were grown in a humidified atmosphere containing 5% CO2 at 37°C. Cells were washed with phosphate-buffered saline (PBS) and harvested with trypsin–ethylenediaminetetraacetic acid (EDTA) (0.25%) (Thermo Fisher Scientific, Waltham, MA, USA).
Cells spiked in donor blood
Spiking was performed by adding 1 million MCF7 or SKBR3 cells into 7.5 mL blood in CellSave preservative tubes (Janssen Diagnostics, LLC, Raritan, NJ, USA). In all, 100,000 JEG-3 cells were spiked into 9 mL blood sample in Greiner Vacuette tubes (Greiner Bio-One GmbH, Germany). The blood tubes were immediately processed. The blood was sampled from healthy donors (Nordsjællands Hospital, Hillerød, Denmark, or Ghent University, Belgium). A written informed consent in accordance with the Declaration of Helsinki was obtained from each participant before sample collection.
Staining of tumour cells
Spiked blood samples were prepared as previously described.12–16 In brief, after centrifugation, the buffy coat was isolated, and lysis buffer was added to clear co-isolated erythrocytes. The cells were stained with CT Reagent Kit A (CytoTrack, Lyngby, Denmark), containing a nuclear stain (4′,6-diamidino-2-phenylindole (DAPI)), stain of CD45 (APC) and pan-cytokeratin (fluorescein isothiocyanate (FITC)). The stained sample was smeared on a round glass disc, CytoDisc™ (CytoTrack, Lyngby, Denmark), and left to dry.
Detection of tumour/trophoblast cells
Tumour cells and trophoblast cells were readily visible in almost any field on the CytoDisc™ using ultra-sensitive fluorescence scanner CytoTrack CT4 (CytoTrack, Lyngby, Denmark).12,14 To identify the tumour cells in the samples, following established criteria were applied: presence of blue nucleus (visible in both DAPI/FITC and DAPI channels); presence of green cytokeratin (visible in both DAPI/FITC and FITC channels); and no presence of red CD45 (visible in the APC channel). Morphological criteria were nearly round and size was >4 µm.5,17 Once identified, the tumour/trophoblast cells were ready for cell picking.
Cell-picking procedure
Cell-picking is a manual process using the CytoPicking system added to the CytoTrack scanner CT4.
Cell deposition on microscopy slides
Pipette pressure was carefully increased to expulse the cell on a microscopy slide. For deposition on microscopy slides, 70% ethanol (CSS Healthcare AB, Malmö, Sweden) was used as deposition media. Continuous monitoring and careful regulation of the pressure in the pipette was essential, so that cell position after expulsion could be recorded. Cells were monitored until the ethanol evaporated, since the cells tended to move with the microflows that occurred as the fluid evaporated. Coordinates of the cells as well as images were recorded for the purpose of revisiting the cells following the stains. 14 Five cells were deposited on each slide inside a small square (1.0 × 1.0 cm) carved into the slides, which assisted in rediscovery of the cells after deposition.
Single cell immune characterization – HER2 and EpCAM
The deposited cells were stained by two different antibodies: anti-human CD340 (HER2) (clone 24D2, Alexa Fluor 647) and anti-EpCAM (clone VU-1D9, Alexafluor 555). A volume of 30 µL antibody solution (in PBS, 1:50) was applied to the deposited cells and incubated 1 h with a cover slide. It was followed by wash in PBS and drying of the cells. All slides were stained with HER2, and a small batch of these slides was stained with EpCAM. The stains were scored by fluorescence intensity of HER2 (Cy5 channel) and EpCAM (PE channel). All scoring of stains were blinded.
Cell depositing in PCR tubes
The deposition of cell-picked cells in PCR tubes was performed in a similar fashion to deposition on microscopy slides with minor alterations. Pipette pressure was carefully increased to expulse the cell in a droplet of PCR grade water in a PCR tube lid. The PCR tube was closed and spun by microcentrifuge and stored at −80°C until whole genome amplification (WGA).
WGA and evaluation of DNA quantity and quality of trophoblasts in Eppendorf tubes
Two WGA kits were used for downstream cell lysis and DNA amplification after cell picking. For each WGA method, two 3-cell samples and two single-cell samples were deposited in a total volume of 1 µL for DOPlify™ reaction kit and 5 µL for PicoPLEX® WGA kit, respectively.
Cell lysis and WGA was performed using DOPlify™ reaction kit (Reproductive Health Science, Thebarton, Australia) and PicoPLEX® WGA kit (Rubicon Genomics Inc., MI 48108, USA) according to manufacturer’s instructions. For both WGA methods, a positive control sample, containing 30 pg high quality control DNA (Human Genomic DNA, Roche, 100 µg (500 µL)), was included to evaluate the DNA yield of the WGA procedure in optimal conditions. Also, a negative control sample, containing 1 µL PBS, was added to determine possible contamination introduced during WGA. Purification of the amplified samples was performed using the Genomic DNA Clean & Concentrator kit (version 1.0.0, Zymo Research, Irvine, CA, USA) following manufacturer’s recommendations. DNA yield was then determined using Qubit dsDNA High Sensitivity Assay Kit (Life technologies™, Carlsbad, CA, USA). DNA quality of all WGA samples was evaluated by means of automated DNA electrophoresis using Agilent High Sensitivity DNA kit (Agilent Technologies, Santa Clara, CA, USA).
STR genotyping of cells in Eppendorf tubes
An in-house multiplex PCR assay, based on the Promega Powerplex, was used to simultaneously amplify the amelogin locus and 14 tetrameric STR loci across the human genome: D3S1358, TH01, D21S11, D18S51, vWA, D8S1179, TPOX, FGA, D5S818, D13S317, SE33, CD4, D7S820 and D16S539. Each reaction mix contained 2.5 U Hotstar Taq polymerase (Qiagen, Hilden, Germany), 0.5 mM MgCl2 (Qiagen, Hilden, Germany), 0.4 µg/µL albumin (Sigma-Aldrich, Saint Louis, USA), 1× PCR buffer (Qiagen, Hilden, Germany), 0.15 µM–1 nM of each STR primer and 30 µL of amplified DNA, with a total volume of 50 µL. All amplified DNA samples served as template. For DOPlify samples, 1 ng WGA product was added whereas for PicoPLEX samples, 5 ng was added. Multiplex PCR consisted of three steps: an initial denaturation step (95°C, 15 min), 28 amplification steps (94°C, 1 min; 58°C, 1 min; 72°C, 1 min 20 s) and a final elongation step (72°C, 10 min) were performed in a SimpliAmp Thermal Cycler (Life Technologies, Carlsbad, USA). Four additional samples were included in multiplex PCR. A positive control, containing 30 pg high quality DNA (Human Genomic DNA, Roche, 100 µg (500 µL)), was included, to confirm the good performance of the PCR reaction in optimal conditions. A sample containing 30 µL of H2O was included as a non-template control. Bulk DNA samples from the JEG-3 cell line and the blood donor were amplified as well. STR profiles were generated by capillary electrophoresis using the ABI 3130 Genetic Analyzer equipped with GeneMapper ID× 1.2 software (Applied Biosystems™, Carlsbad, CA, USA). Allele peaks were indicated by maintaining a detection threshold of 50 RFU.
Statistics
To investigate a difference in the rate of cell loss between the two cell-lines MCF7 or SKBR3 when cell picking to microscopy slides, a chi-square test was applied with a α-significance level at 0.05.
Results
The cell-picking procedure and cell deposition on microscopy slides
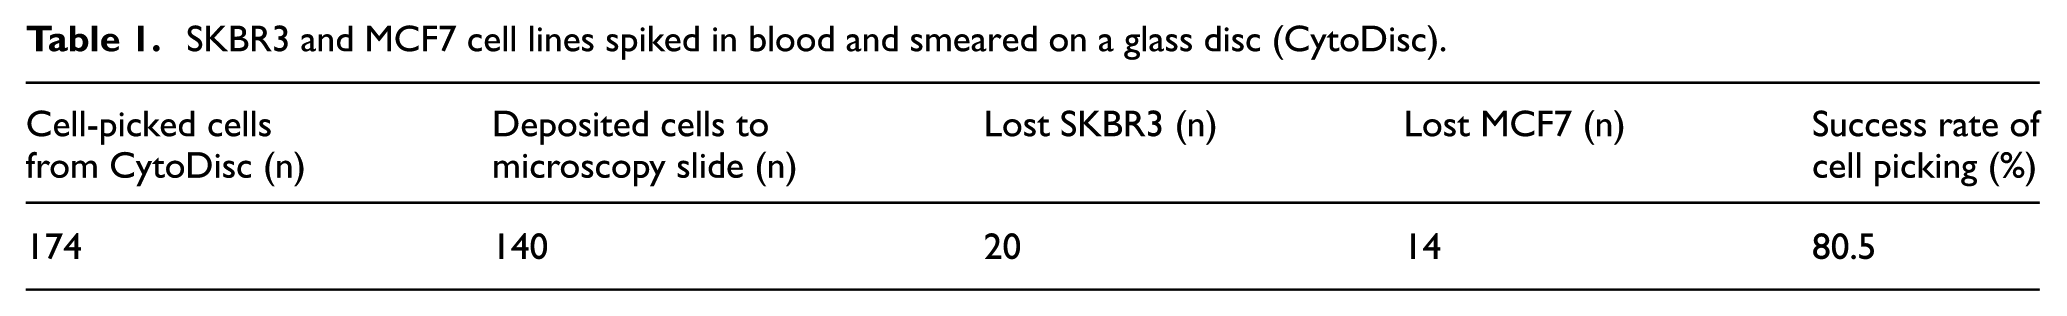
A skilled operator, defined as more than 10 h training in the procedure, was able to successfully cell pick (Figures 1 and 2) 140 cells out of attempted 174 (80.5%, Table 1). The ‘lost cells’ were cells vacuumed into the pipette, but not successfully deposited on the microscopy slide. Most frequently (n = 17), cell loss was caused by sudden changes in the air pressure of the pipette, resulting in a violent expulsion of the cell, which complicated rediscovery. The second most common reason of cell loss (n = 13) was cells adhered to the surface of the pipette. For a few cells (n = 4), the reason for cell loss was unknown. There was no significant difference in the rate of cell loss between the cell lines SKBR3 and MCF7 (p = 0.303, chi-square test). The average time for the procedure was five cells per hour. Drying time varied the most during cell-picking (median: 5:23, range: 0:57–14:34 min), and the rest of the process took approximately 5 min per cell. Thus, total time to finish cell-picking and deposit a cell varied from 6 to 20 min. It was not always possible to collect a ‘clean’ cell; for example, leukocytes entered the pipette and were co-deposited.

Cell-picking: The set up for isolating single cells from a smear on a CytoDisc using a micropipette with an oil containing tube connected to a pump managing suction in the pipette (the Cytopicker with the CytoTrack). After a tumour cell was located on the CytoDisc and selected for isolation, a generous amount of distilled water was deposited around the cell (e.g. 20 μL) to allow the Cytopicker system to manipulate the cell to release it from the surface of the CytoDisc. Gentle suction was applied to the micropipette to aspirate the cell. The pressure in the pipette was equalized and removed from the surface of the CytoDisc. The CytoDisc could now be substituted with the desirable target for cell deposition, either a separate microscopy slide, or PCR tube. The chosen target for cell deposition created different requirements in the subsequent cell deposition process.

After cell-picking, cells were deposited on microscopy slides. The target cells were picked from a CytoDisc, which was smeared with cells from a blood sample, spiked with cells of the MCF7 or SKBR3 breast cancer cell lines. For depositing on microscopy slides, the slides were positioned on a separate CytoDisc at a known and fixed position. After picking a single cell, the cell remained in the pipette, while the microscope slide mounted on a CytoDisc inserted under the microscope. For deposition on microscopy slides, 10 μL 70% ethanol (CSS Healthcare AB) was used as deposition media. The tip of the Cytopicker pipette with tumour cells was carefully positioned into the ethanol droplet. The pipette was emptied completely by creating a forceful pressure by the CytoPicker to expulse the cells. Afterwards, the Cytopicker pipette was examined in the microscope to confirm that no tumour cells remained in the pipette. Cells were monitored until the ethanol evaporated and a new cell was picked from the sample CytoDisc and deposited at the same position on the microscopy slide. Five cells were deposited on each slide inside a small square (1.0 × 1.0 cm) carved into the slides, which assisted in rediscovery of the cells after deposition.
SKBR3 and MCF7 cell lines spiked in blood and smeared on a glass disc (CytoDisc).
HER2 and EpCAM characterization
After cell-picking to the microscopy slide, the slides were HER2 stained. Out of 140 cells, 123 cells were rediscovered after HER2 staining (Table 2). There was no difference in loss between tumour cell lines SKBR3 and MCF7 (p = 0.8). An additional six cells were lost during the subsequent EpCAM staining process.
Rediscovery rate of single picked cells after HER2 and EpCAM immune stain.

HER2: human epidermal growth factor receptor 2; EpCAM: epithelial cell adhesion molecule.
Cells were scored according to criteria: no visible output (score 0), weak visible output (score 1) and strong visible output (score 2; Figure 3). The HER2 control stains (HER2 stain of cells from the same cell-line batch with no previous cell picking) were strongly positive (score 2) in all cases for SKBR3 cells.18,19 However, cell-picked SKBR3 cells were almost equally distributed between the HER2 scores (score 0, 1 or 2; Figure 3(a)).

Single cell analysis. The distribution of cells according to blinded evaluation of the immune stain scores: (a) distribution of SKBR3 cells according to given score of the HER2 stain; (b) distribution of MCF7 cells according to given score of the HER2 stain and (c) distribution of SKBR3 cells according to given score of the EpCAM stain.
The MCF7 control stains were all negative (score 0).18,19 The cell-picked cells were negative (score 0) except five cells, which were weakly stained (score 1; Figure 3(b)).
SKBR3 control cells were weakly stained for EpCAM (score 1). 20 All the cell-picked SKBR3 cells received a positive score with the majority receiving a score of 1 (Figure 3(c)).
Cell deposition in PCR tubes
Depositing cells into PCR tubes (Figure 4) was faster than depositing onto microscopy slides, because there were no drying times for the cells deposited in the PCR tubes. The effective worktime when cell-picking all the cells for this part of the project amounted to 3 h for 84 cells to 18 tubes. A rate of about 10 cells being cell-picked and deposited in 5 min was achieved, when cell-picking multiple cells into the same tube.

After cell-picking, cells were deposited in Eppendorf tubes. The target cells were picked from a CytoDisc, which was smeared with cells from a blood sample, spiked with cells of the JEG-3 cell line. For depositing in PCR tubes, the tubes were positioned horizontally with the lid open, under the microscope. To create a media to deposit the tumour cells in, a droplet of PBS was deposited inside the Eppendorf tube using a regular precision pipette (Biohit 0.5–10 μL pipette). The volume of PBS used varied according to specifications given by the downstream PCR requirements, varying from 2–5 μL. The tip of the CytoPicker pipette with trophoblast cells was carefully positioned into the PBS droplet. The pipette was emptied completely by creating a forceful pressure by the CytoPicker to expulse the cells. Afterwards, the Cytopicker pipette was examined in the microscope to confirm that no trophoblasts remained in the pipette.
DNA yield after WGA
After WGA, the DNA yield of all samples was assessed (Table 3). For both WGA methods, the DNA yield of the positive control was similar to the one- and three-cell samples from the respective WGA method. A negligible amount of DNA is present in the negative controls after WGA.
DNA concentration and DNA yield after DOPlify and PicoPLEX WGA.

WGA: whole genome amplification.
DNA quality after WGA
After WGA, the DNA quality of all samples was evaluated based on size distribution of the DNA products. Samples amplified with the same WGA kit show a similar DNA size distribution profile. DOPlify WGA samples show an average DNA fragment size of 384 ± 59 bp while PicoPLEX WGA samples result in an average DNA fragment size of 506 ± 92 bp. For both WGA methods, an electropherogram is shown for a one-cell sample in Figure 5 ((a) DOPlify WGA and (b) PicoPLEX WGA, respectively).

DNA quality of a one-cell sample illustrated by electropherogram for (a) DOPlify WGA and (b) PicoPLEX WGA.
STR profiles
Five out of eight samples show a mixed STR profile. This means that for some loci, more than two alleles are detected and thus the sample originates from more than one individual. The comparison of the sample profiles with the WBC reference profile (Figure 6) demonstrates that all samples showed 3–11 loci containing all reference alleles, indicating that WBC were present in all Eppendorf tubes. The other loci either showed allelic dropouts or complete locus dropouts. Only few loci contained all reference alleles of the JEG-3 cell line. Apart from the alleles that the JEG-3 and WBC have in common, three samples did not show any alleles corresponding with the JEG-3 cell line. In the other five samples, three to seven alleles identifying the presence of JEG-3 cells were detected.

Examples of STR profiles. The amplified samples (top row) were compared with the reference STR profiles of both the JEG-3 cell line (top panel, bottom row) and the blood donor (bottom panel, bottom row). This way, the presence of target JEG-3 cells or accidently picked white blood cells (WBC) in the Eppendorf tube was determined. Sample STR profiles are compared with the reference JEG-3 profile and with the WBC reference profile. Loci that contain all alleles of the reference profile are labelled in green. An orange square represents a heterozygous reference locus for which only one allele is found in the sample. Loci, for which no reference alleles are present, are indicated in red. Five out of eight samples show a mixed STR profile. This means that for some loci, more than two alleles are detected and thus the sample originates from more than one individual. The comparison of the sample profiles with the WBC reference profile demonstrates that all samples showed 3 to 11 loci containing all reference alleles, indicating that WBC were present in all Eppendorf tubes. The other loci either showed allelic dropouts or complete locus dropouts. Only few loci contained all reference alleles of the JEG-3 cell line. Apart from the alleles that the JEG-3 and WBC have in common, ‘DOPlify 1-cell sample 2’, ‘PicoPLEX 1-cell sample 1’ and ‘PicoPLEX 3-cell sample 2’ did not show any alleles corresponding with the JEG-3 cell line. In the other samples, three to seven alleles identifying the presence of JEG-3 cells were detected.
Discussion
Individual rare nucleated cells spiked in blood were manually picked, and single cell downstream analysis was made possible. After smearing the blood sample on a glass surface (CytoDisc), target cells were successfully picked and deposited either in a PCR tube or on a microscopy slide. Trophoblast cells were transferred into PCR tubes, where the presence of cells was confirmed by WGA. The negligible amount of DNA in the negative control sample suggested that the DNA yield of the samples originates from the picked cells (Table 3). Spiked tumour cells were singularly deposited on microscopy slides and characterized with HER2 and EpCAM immune staining (Figures 2 and 3). There was no difference in the picking abilities between the two tumour lines, MCF7 and SKBR3, which may indicate that the method is feasible for other cell lines as well as a liquid biopsy.
In this study, up to 1 million nucleated cells were transferred to donor blood samples. This does not mimic clinical samples, where cells are more rare. However, it is proof of concept of the CytoPicker method. The CytoPicker method is an add-on tool to the CytoTrack system. We have previously shown the system’s capabilities to detect rare cells, like CTC.12–16 This study shows that detection of rare cells by the CytoTrack scanner may be proceeded by the cell-picking method. A clear limitation of this study is the use of up to a million cells for spiking in a blood sample, where the spiked cells cannot be termed rare. However, during the technical cell picking procedure, only one or a few cells were visible in the microscope and those exact cells were isolated and moved to either microscope slide or PCR tube and the recovery reported to be around 80% (Tables 1 and 2). So it is reasonable to presume that the method is also feasible when cells are rare in the sample. However, CTC and foetal trophoblasts may have other capabilities than cell lines, and thus may be harder to transfer, for instance, if they stick more to the CytoDisc or the pipette.
Picking single cells manually requires extensive training and patience. The most common cause of cell loss was air in the pipette, which was often triggered by improper operation of the pump. Second most common reason of lost cells were cells adhered to the pipette, where cell size and accompanying leukocytes increased the chances of this happening. Another issue was improper pipette installation, or breakage, which lead to cell loss as pressure in the pipette became hard to manage. These were issues that potentially arose with fatigue and time constraints, and therefore, cell-picking sessions should not be too long.
Lu et al. 21 also isolated and moved single cells with cell-picking and transfer carried out semi-automatically from droplets of cell-suspension. They, however, also experienced difficulties with managing the pressure in the pipette. They transferred one cell in 30 s to microwell devices with a success rate of 80.24% resulting in 167 cells in total. 21 This is similar to the success rate and transfer time to PCR tubes in our study with cancer cells from blood, where 10 target cells were picked and deposited in PCR tubes in 5 min. However, transfer time was slower to microscopy slides, primarily due to monitoring the cell drying, otherwise it sometimes disappeared in microfluids. This step could be improved with similar microwells as in Lu et al.’s 21 study. Another method for single cell isolation is the fully automatized Cellselector™ (ALS, GmbH, Jena) in combination with the CellSearch® system with a cell-picking rate of about 50 cells in 1–1.5 h. 22
A combination of the CellSearch® system to isolate tumour cells from a blood sample and DEPArray® for automatic purification from white blood cells and blood debris is one solution to purify tumour cells for further single cell characterization. This combined automated method has shown a success rate ranging from 60% to 80%, which is similar to this study. 23
The advantages of the CytoTrack system combined with the manual CellPicker may be the ‘all-in-one’ system. Few methods integrate rare cell identification and single cell retrieval within a single system.
In three of eight samples, only WBC from the donor were present; however, in the remaining five samples, both JEG-3 cells and WBC were present; thus, trophoblast cells were not cleanly aspirated. The DNA quality and quantity of the WGA was adequate by both the Doplify and Picoplex methods as revealed by yield and average DNA fragment size. However, overall quality of STR profiles was intermediate, since many allele or locus dropouts occurred. This could be due to the red blood cell lysing solution, which contains formaldehyde and may have hampered WGA.
In this study, some cells were lost in the immunostaining processes. A way to optimize this could be to stain cells in a moisture chamber instead of using cover-slides to keep the slides moist during PBS wash. The results from the EpCAM stain of the SKBR3 cells show a more consistent stain result than the HER2 stain. In order to use HER2 immune characterization of CTCs as a reliable biomarker, more optimization is needed.
After detection of single cells with the CytoTrack system, we have shown that these cells can be picked from the CytoDisc and may be characterized for specific biomarkers or genome sequencing. These preliminary results show the possibilities with the manual Cytopicker. Purifying single cells from patient blood samples proceeded by downstream characterization could help elucidate mechanisms of rare cells, and may predict disease progression and be a tool in precision medicine.
Footnotes
Acknowledgements
We thank Helle Alsbæk for illustrations.
Declaration of conflicting interests
The author(s) declared no potential conflicts of interest with respect to the research, authorship, and/or publication of this article.
Funding
The author(s) disclosed receipt of the following financial support for the research, authorship, and/or publication of this article: The study was funded by North Zealand Hospital Research Foundation. The CytoTrack scanner was funded by Toyota-Fonden, Denmark.