
Abstract
Human Y-box binding protein 1 is a member of highly conserved cold shock domain protein family which is involved in transcriptional as well as translational regulation of many genes. Differential expression of Y-box binding protein 1 has been observed in various cancer types, but no diagnostic or therapeutic correlation has been established so far. This study aimed to identify differentially expressed novel genes among the interactors of Y-box binding protein 1 in different cancer types. Analysis of RNA-Seq data for colorectal, lung, prostate and stomach adenocarcinoma identified 39 unique genes which are differentially expressed in the four adenocarcinoma types. Gene enrichment analysis for the differentially expressed genes from individual adenocarcinoma with focus on unique genes resulted in a total of 57 gene sets specific to each adenocarcinoma. Gene ontology for commonly expressed genes suggested the pathways and possible mechanisms through which they affect each adenocarcinoma type considered in the study. Gene regulatory network was constructed for the common genes and network topology was analyzed for the central nodes. Here 12 genes were found to play important role in the network formation; among them, two genes FOXM1 and TOP2A were found to be central in network formation, which makes them a common target for therapeutics. Furthermore, five common differentially expressed genes in all adenocarcinomas were also identified.
Introduction
Identifying the genes that influence common cellular function and exploring their mechanism of action through differential expression (DE) analysis during disease or other disorders has been the most sought after research area. In most of the cases, interaction among different genes is influenced by its cellular environment in normal and diseased conditions.1,2 It is necessary to understand the variation in the interaction between and among genes in different conditions to identify novel therapeutic targets and diagnostic markers. In this work, we chose to study Y-box binding protein 1 (YBX1), a gene which is known to have its influence in various cellular regulatory mechanisms and its interactors have influence in four adenocarcinomas (colorectal adenocarcinoma (COADREAD), lung adenocarcinoma (LUAD), prostate adenocarcinoma (PRAD), and stomach adenocarcinoma (STAD)).
YBX1 is a member of a highly conserved cold shock domain protein family that is involved in regulation of several genes. 3 It is usually centralized in cytoplasm, but due to various stress conditions, they are reportedly localized to nucleus.4–7 YBX1 regulates transcription of genes which are usually involved in multidrug resistance, cell death, and proliferation 8 and the proteins binding to other transcription factors. 9 YBX1 is involved in tumorigenesis and overexpressed in various types of cancers. 10 It is activated by phosphorylation at serine 102 position. 11 It has been reported to be overexpressed in colorectal carcinoma 12 and breast cancer. 13 Its overexpression in various types of cancers is due to metastasis and multidrug resistance.14,15 YBX1 is regulated by binding of transcription factor at E-box 16 and to its transcription factors.17,18 YBX1 interactors are known to be involved in various cellular mechanisms including transcription factors, actin filaments, DNA and protein repair mechanism, and multidrug resistance development in cells.13,19–24
RNA sequencing technique provides accurate measures of the gene expression and can be used to compare expression data across different experimental conditions and helps to look into the variation of expression in different diseases. 25 Expression data in turn are used to construct a gene regulatory network which suggests possible interactions among them, as well as the pathways activated during different cellular conditions26,27 using information available from biological databases, and this helps researchers to identify the selected gene and pathways as a target for treating the disease and to have the insight of disease mechanism. 28
In this study, we investigated the differential expression of YBX1 and its interactors in four adenocarcinomas and looked into the difference in cellular functions through gene enrichment analysis. We also constructed gene regulatory network for the commonly expressed genes in four adenocarcinoma, and network topology was accessed through graph theory. The approach may be employed to other related and co-morbidity disease data set to deepen our understanding of the disease progress using high-throughput technologies from a system biological viewpoint.
Materials and methods
YBX1 interactors
Genes which are known to be involved in interactions of YBX1 at both transcriptional and translational levels were obtained from three different databases:
TRRUST (Transcriptional Regulatory Relationships Unraveled by Sentence-based Text mining) 29 enlisted transcription factors and cooperative transcription factors of YBX1.
Metamatched 30 provided significantly predicted regulators co-cited with YBX1.
UniHI (The Unified Human Interactome database) 31 with physical and regulatory interactors of YBX1.
Gene duplications occurring due to different sources were avoided, and finally, a total of 368 genes including YBX1 were considered for the study (Supplementary 1).
RNA sequence data
The Cancer Genome Atlas (TCGA) level 3 transcriptome data for the four types of adenocarcinoma were retrieved from Broad Genome Data Analysis Center (Broad GDAC) Firehose site (https://gdac.broadinstitute.org/). In order to avoid variance and heterogeneity in data, tumor samples for which matched normal samples are available were selected exclusively. RNA Sequence by Expectation Maximization (RSEM) 32 counts for 368 genes of interest in each adenocarcinoma type were used for the DE analysis.
Sample filtering and DE analysis
Sample-to-sample distance was calculated for the rlog-transformed sample sets in each adenocarcinoma with hierarchical clustering to filter out the outliers among the tumor and normal samples using dist function of DESeq2 Bioconductor package.33–35 DE analysis was carried out with DESeq2 and the logarithmic fold change was calculated using nbinom Wald test and adjusted p (adj-p) value was calculated based on Benjamini–Hochberg method using DESeq2.
Gene set enrichment expression analysis
Different gene set enrichment analyses (GSEAs) 36 were performed separately for each adenocarcinoma using the pre-ranked differentially expressed gene set (adj-p < 0.05) against 18,026 gene sets available from Molecular Signatures Database (MSigDB).37–40 The ranks for the differentially expressed gene sets are given based on their log2 fold change. The genes with positive log2 fold change are ranked top and those with negative log2 fold change are placed at the bottom. GSEA was carried out by choosing classic enrichment statistics with maximum and minimum excluded set numbers as 500 and 5, respectively. Leading edge analysis was carried out to analyze the overlap between leading edge subsets.
Correlation and regulatory network analysis for differentially expressed common genes
Correlation between the differentially expressed common genes among each adenocarcinoma was calculated using cor function in R with Pearson correlation method. Bioconductor packages Hmisc 41 and corrplot 42 were used to calculate the significance level of the Pearson correlation and to plot the correlation heat map between genes in each adenocarcinoma type.
A common gene regulatory network was constructed using GeneMANIA 43 with default parameters, and the derived network was analyzed using Network Analyzer of Cytoscape 3.4 44 for the network topology, namely, closeness centrality, betweenness centrality, and degree.
Gene ontology for common genes
Gene ontology for the differentially expressed common genes was carried out using Bingo plugin of Cytoscape 45 with default parameters and gene ontology full option including both biological process and molecular functions. Enrichment of the Bingo output was carried out with EnrichmentMap plugin 46 of Cytoscape 3.4 with overlap coefficient cutoff (0.5) and p value (0.005) and false discovery rate (FDR) Q-cutoff (0.05).
Results
Sample filtering
Sample-to-sample distance was calculated among the tumor and normal samples in each adenocarcinoma using the log-transformed RSEM counts with hierarchical clustering, and the samples which showed larger Euclidean distance within tumor and normal samples were eliminated (Supplementary 2) and only the samples with less variation were taken for further analysis (Table 1).
Number of samples in adenocarcinomas before and after filtering.

DE analysis
DE analysis was carried out with DESeq2, and the genes with adj-p value (<0.05) and log2 fold change threshold (|1|) were taken as significant differentially expressed genes (Supplementary 3). YBX1 was not significant differentially expressed in all four adenocarcinomas (Table 2). Five genes were found to be commonly expressed in all four types with their direction of fold change, same except ETV4 which showed a downregulation in the case of PRAD and upregulation in other adenocarcinomas (Figure 1).
Differential expression (DE) analysis of YBX1 in different adenocarcinomas.


Differential expression profiling output overview: (a) commonly expressed genes in four adenocarcinomas and their log fold change pattern, whether they are upregulated or downregulated and (b) number of differentially expressed genes overlapping among each adenocarcinoma.
Gene set enrichment expression analysis ways to molecular target in specific adenocarcinoma
To understand the role of YBX1 interactors in the biological mechanism and their connections, gene enrichment analysis was carried out using GSEA. Leading edge with FDR < 0.2 was performed to narrow down the result of GSEA to find out the gene sets which were strongly correlated to the pre-ranked gene data. GSEA results showed that all significantly enriched gene sets belong to positive phenotypes (upregulated), and no significant gene sets were obtained for genes that belong to negative phenotypes (downregulated) in the adenocarcinomas (Supplementary 4).
Furthermore, the gene sets uniquely expressed in particular adenocarcinoma were identified as they are useful in investigating particular pathways and cellular mechanisms to identify potential biomarkers and therapeutic targets (Figure 2).
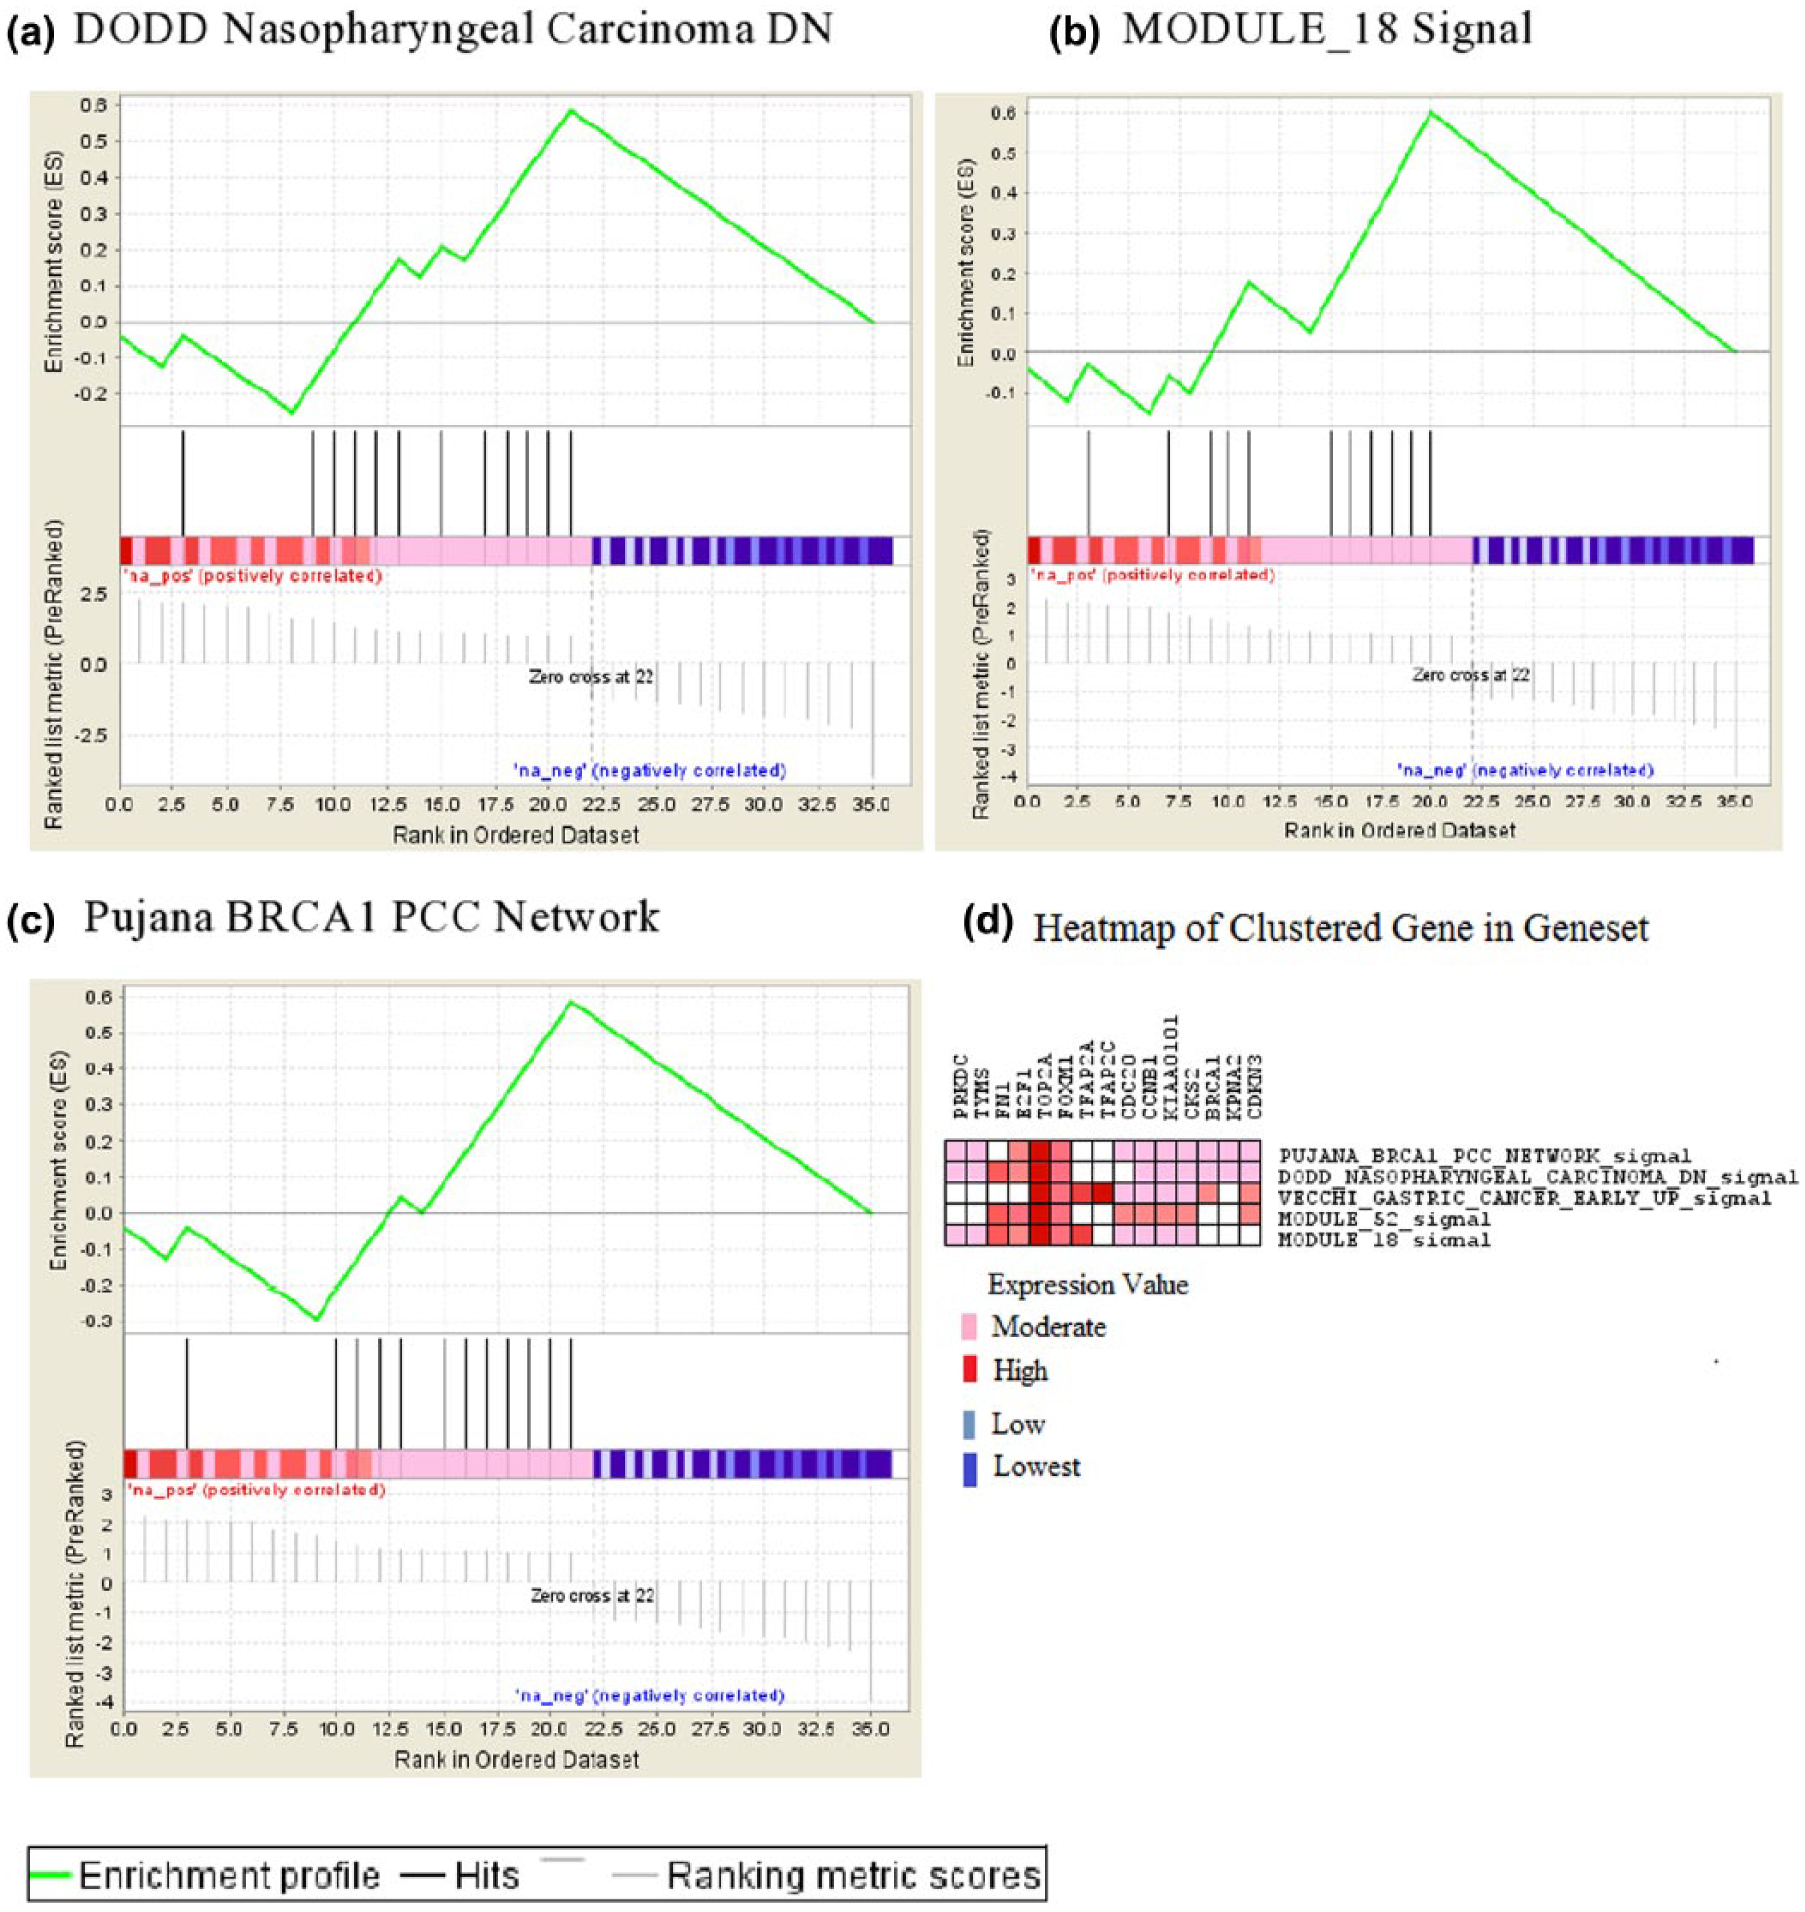
STAD GSEA enrichment profile. (a)–(c) The enrichment profile of the gene lists in the mentioned gene sets. It indicates the positive phenotype (upregulated) part of the gene list represented in all three gene sets. (d) The heat map between the clustered gene and gene set in leading edge analysis (FDR < 0.2). PRKDC, a YBX1 interactor gene which is uniquely expressed in STAD alone, is moderately expressed in three pathways mentioned above.
Correlation and gene regulatory network analysis for differentially expressed common genes
The correlation analysis for the commonly expressed genes was carried out, and the gene pairs with correlation coefficient threshold (|0.75|) and p value (<0.05) were considered strongly correlated in negative or positive way based on their direction of correlation coefficient sign. TWIST-PGR is found to be a strongly correlated common gene pair in all adenocarcinomas except LUAD (Figure 3).

Correlation matrix between the commonly expressed genes in four adenocarcinomas: correlation matrix between the commonly expressed genes TWITS2, TOP2A, ETV4, PGR, and FOXM1 in four adenocarcinomas. The color grading defines the correlation value range: dark blue with positive correlation and brown with negative correlation. (a) COADREAD, (b) LUAD, (c) PRAD, and (d) STAD.
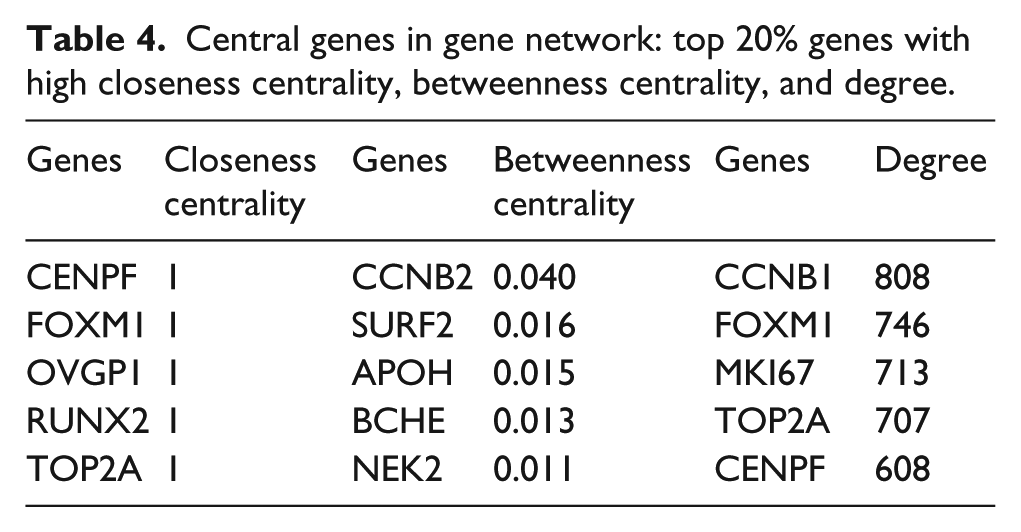
Gene regulatory network was constructed using GeneMANIA with maximum resultant genes having attributes as 20 and 10, respectively, which resulted in increase in gene from 5 to 25 with 3119 interactions (Table 3). The constructed network was analyzed for its topology using Cytoscape network analyzer tool (Figure 4). Based on Graph Theory concept, parameters, namely, degree, betweenness centrality, and closeness centrality were employed to access topology of the network constructed. Genes were sorted based on these parameters and the top 20% genes were selected, and considering the overlapping of the nodes, finally, a total of 12 genes were chosen (Table 4).
Interaction type and number of interactions in the network constructed using GeneMANIA for the commonly expressed gene.


Gene network analysis with Cytoscape. Directed root network built from the gene interaction data obtained from GeneMANIA. A total of 25 nodes with 3119 interactions.
Central genes in gene network: top 20% genes with high closeness centrality, betweenness centrality, and degree.
Gene ontology for the common genes
Gene ontology to identify the gene function, biological pathways and mechanism was carried out using Bingo plugin of Cytoscape resulted in 79 pathways. Enrichment for the Bingo output was done using EnrichmentMap plugin of Cytoscape and it narrowed down the count of gene sets and pathways to 43 and these gene sets are strongly related to cancer (Figure 5). This network showed a stronger and deep connection between gene sets (513 edges, edge/node: 11.9).

EnrichmentMap for commonly expressed genes in adenocarcinomas. The map displays the gene sets which are obtained after the enrichment of Bingo gene annotation results. The annotation defines the major biological and cellular mechanism in which the gene sets are majorly involved.
Discussion
Many studies have been carried out to understand the role of specific genes in cancer progression and proliferation by exploring its interactors and their cellular expression level. It not only helps in understanding the distinct mechanisms behind the disease progression but also identifies novel targets and pathways specific for individual cancer as well as commonly affected genes and pathways. In this study, we investigated the role of YBX1 and its interactors in four adenocarcinomas (COADREAD, LUAD, PRAD, and STAD) by looking at their expression and gene enrichment which resulted in identification of novel gene and pathways as targets unique for individual adenocarcinomas and the most commonly affected pathways indicating the role of YBX1 and its interactors in specific cellular function.
The DE analysis suggests that differential expression of YBX1 is not significant in any of the cancer types as the threshold cutoff for the log fold change (|1|) with adj-p value (<0.05) was set to select significant differentially expressed genes. It is in accordance with previous report that the major role of YBX1 in cancer is mainly due to its localization property between nucleus and cytoplasm.47,48 The analysis focused on variation in expression level of the interactors in different adenocarcinomas. There were five common differentially expressed genes in all adenocarcinomas, and certain genes were differentially expressed specific to particular adenocarcinoma (Supplementary 5). These uniquely expressed genes specific to particular adenocarcinoma type can be a potential therapeutic target or marker as well. The gene annotation for the differentially expressed genes with focus on gene sets particularly belonging to the unique groups suggested the distinct pathways specific to adenocarcinoma types (Supplementary 6). For example, the gene HABP4 which encodes for hyaluronan-binding protein 4 is differentially expressed specifically in PRAD, and not much work has been carried out on this gene. It can be a potential biomarker in the case of PRAD. Similarly, the gene PRKDC involved in regulation of MYC gene and its overexpression leading to less survival in colorectal cancer49,50 can be a target in STAD for therapeutics application. On the other hand, gene ontology for the five commonly expressed genes provided the common cellular mechanism that is affected in four adenocarcinomas. The enriched gene ontology data for common gene suggested the pathways and gene sets which are strongly associated with carcinomas. The gene ETV4 which is known to be involved in metastasis in breast and prostate cancers51,52 is a commonly expressed gene in adenocarcinomas and it can be a potential biomarker for patients with both cancer types. The genes PGR, TWIST2, TOP2A, and FOXM1 are involved in progression of breast cancer, prostate cancer, and cervical cancer,53–59 but their role in adenocarcinomas are not much been explored and they can be a potential marker for the diagnosis in adenocarcinoma based on their expression. The comparison between the unique gene set and the common one helps to focus on specific novel therapeutic targets toward each adenocarcinoma. The hub genes play an important role in the network formation, and deletion of these genes leads to network lethality comparing non-hub genes.60–62 The gene ontology for the commonly expressed gene investigates feasibility of co-occurrence in a given biological state by making cross-links between the other genes indicating their functional importance as a central node in the network. Two common genes, FOXM1 and TOP2A, form the central node exhibiting their importance in network formation and can be potential therapeutic targets for adenocarcinoma. The analysis provided gene sets related to signaling pathways which are to be further explored for the particular adenocarcinoma type. For instance, the gene set “GO appendage development signal,” which has been reported for skin cancer 63 in one of the enriched set for LUAD, and gene set “GO oligodendrocyte differentiation up signal and GO positive regulation of transferase activity signal” which is involved in cellular differentiation and drug resistance mechanism,64,65 respectively, are enriched sets in PRAD which need to be explored.
Conclusion
The study was carried out to understand the synergistic role of YBX1 and its interactors in different adenocarcinoma progressions by looking at their expression and gene enrichment analysis for the differentially expressed gene. The study identified the unique interactors which are differentially expressed to particular adenocarcinoma and that can be used as a target for markers and therapeutic application. We have followed a system biological approach to study a gene and its interactor’s role in adenocarcinoma. The findings of this study need to be explored further to investigate the diagnostic feasibility and relevance of suggested candidate markers and therapeutic targets in case of specific cancer types.
Footnotes
Acknowledgements
A.M. is thankful to SERB New Delhi for a project grant under young scientist scheme.
Declaration of conflicting interests
The author(s) declared no potential conflicts of interest with respect to the research, authorship, and/or publication of this article.
Funding
The author(s) received no financial support for the research, authorship, and/or publication of this article.