
Abstract
Glioblastoma is the most common and malignant tumour that occurs primarily in nervous system and has a high morbidity. Research on glioblastoma has recently focused on human cytomegalovirus, belonging to the beta subfamily of Herpesviridae that plays crucial roles in cancer development and progression. This study aimed to investigate the role of human cytomegalovirus–associated microRNA-613 in glioblastoma. In this study, we demonstrate that microRNA-613 expression was frequently reduced in human cytomegalovirus–positive glioblastoma specimens/cells compared with human cytomegalovirus–negative glioblastoma tissue/cells, and a significant correlation was observed between the reduction in microRNA-613 expression and the presence of unfavourable variables, including tumour size (p = 0.0118), World Health Organization stage (p = 0.0169), the overall survival (p = 0.0107) and disease-free (p = 0.0159) survival of patients. Overexpression of microRNA-613 in the glioblastoma cell lines U87 and U251 retarded cell growth and induced cell apoptosis. Upregulation of microRNA-613 inhibited glioblastoma cell clone formation, invasion and migration. Furthermore, we demonstrated that arginase-2 was directly regulated by microRNA-613 and played an essential role in mediating the biological effects of microRNA-613 in glioblastoma. Re-expression of arginase-2 markedly reversed the inhibitory properties of microRNA-613 in glioblastoma cells. Taken together, our data provide compelling evidence that human cytomegalovirus reduced the level of microRNA-613 which functions as an anti-onco-miRNA in glioblastoma, primarily by downregulating the expression of arginase-2.
Introduction
Glioblastoma (GBM) is a primary malignant tumour with high morbidity that principally emerges in intracalvarium and accounts for 15.7% of all nervous system neoplasm and 46.1% of malignant tumour in brain.1,2 GBM is characterized by highly invasive and infiltrative growth, and the early symptoms of GBM are nonspecific, leading to a delay in early diagnosis. Despite modern multidisciplinary treatments including chemotherapy and surgery, the 5-year survival rate of GBM patients remains 5.1%. 3 Increasing evidence implicates that human cytomegalovirus (HCMV) infection, as causal in GBM, can induce cellular responses that would provide a growth advantage for GBM cells. HCMV might play an ‘oncomodulatory’ role in the GBM progress. 4 The biological mechanisms underlying the initiation, development and invasion of HCMV-associated GBM remain poorly understood. Thus, a better understanding of the biology of this malignancy is necessary to optimize treatment strategies, identify biomarkers and develop new chemotherapeutic agents.
MicroRNAs (miRNAs) are a class of endogenously expressed, single-stranded, 19- to 24-nucleotide noncoding RNAs that can inhibit gene expression by targeting messenger RNAs (mRNAs) via binding to the 3′-untranslated region (3′-UTR) of target genes to mediate translational repression and/or cleavage. 5 MiRNAs play critical roles in a number of normal biological processes, including embryogenesis, lineage determination and regulation of cellular differentiation, metabolism, proliferation and apoptosis. 6 Nevertheless, there is accumulating evidence that miRNAs can serve as either oncogenes or tumour suppressors depending on their target genes. 7 Moreover, miRNA-targeted treatment approaches have shown enormous potential in controlling the aggressive pathology of GBM, and miRNAs are deeply implicated in multiple steps of GBM occurrence and development, including proliferation, adhesion, invasion and metastasis. 8
The purposes of this study were to explore the differential expression levels of microRNA-613 (miR-613) between HCMV-positive and HCMV-negative GBM tissue, to evaluate the clinical characteristics of miR-613 expression in glioma and to provide evidence for the critical role that miR-613 plays during the development of GBM. Our results demonstrated that HCMV-induced aberrant miR-613 expression is associated with GBM cell property, indicating that miR-613 plays an important role in GBM pathology.
Materials and methods
Patients and tissue samples
Total of 64 human glioma samples, 10 HCMV-negative GBM samples, 10 HCMV-positive GBM samples and matched adjacent normal tissues were obtained from patients who underwent curative resection at the Department of Pathology, The Affiliated Hospital of Qingdao University between August 2010 and August 2015. All samples were obtained with informed consent and immediately divided into two parts: one part was fixed in 4% paraformaldehyde for immunohistochemical analysis, and the remaining part was snap frozen in liquid nitrogen and stored at −80°C for RNA extraction. This study was approved by the Ethics Committee of The Affiliated Hospital of Qingdao University.
Immunohistochemistry assay
The clinical specimens were fixed in 4% paraformaldehyde for 48 h and were subsequently embedded in paraffin. Then, 5-µm-thick tissue sections were dewaxed by heating at 60°C and dehydrated in graded alcohol. Antigen retrieval was performed with 0.3% H2O2-methanol to quench endogenous peroxidase activity following by heating for antigen retrieval. After blocking with 5% normal goat serum, the primary antibody (mouse monoclonal to HCMV Immediate Early protein (IE1), dilution 1:200, #0841; ViroStat, Westbrook, ME, USA) was incubated with the sections at 4°C in a humid chamber overnight. Subsequently, biotinylated detection agent (Dako, Munich, Germany) was incubated with sections for 30 min at room temperature, and the antigen–antibody reaction was visualized with diaminobenzidine (Maixin, Fuzhou, China) serving as the chromogen.
HCMV DNA polymerase chain reaction
Specific UL83 region polymerase chain reaction (PCR) amplifications were performed for HCMV DNA detection (primer: forward, 5′-CGATACTGGCTGGTGAAGGTG-3′; reverse, 5′-ACCCGCAACCCTTCATGCGCCC-3′). Total PCR reaction system contains 2 µL of DNA, 1 µL of each primer, 6 µL H2O and 10 µL Taq Master Mix (Novoprotein, Shanghai, China). The PCR conditions were as follows: 95°C for 3 min, followed by 40 cycles of 95°C for 30 s, 58°C for 30 s and 72°C for 30 s. Amplified products were visualized on agarose gels with ethidium bromide (Klamar, Shanghai, China), bands were cut out and DNA extracted was analysed by sequencing.
RNA extraction and miRNA expression assay
MiRNAs were extracted using a mirVana™ miRNA Isolation Kit (Applied Biosystems, Carlsbad, CA, USA) according to the manufacturer’s instructions. Expression of mature miRNAs was assayed using the Taqman MicroRNA Assay (Applied Biosystems) specific for miR-613. A volume of 10 ng of total RNA was used for reverse transcription to complementary DNA (cDNA) with specific stem–loop real-time primers. Reverse transcription primers specific for miR-613 were used to amplify cDNA from the miRNA reverse transcription. Real-time quantitative PCR (qPCR) was performed with an Applied Biosystems 7900 Real-time PCR System (Applied Biosystems) and a TaqMan Universal PCR Master Mix (ABI, Foster City, CA, USA). All primers were obtained from the TaqMan miRNA Assays (ABI). The relative quantification of miR-613 was calculated using the 2−ΔΔCt method. The data were normalized using U6 as an internal control and measured relative to a calibrator sample as the external control.
Cell culture and transfection
The human GBM cell lines U87 and U251 were obtained from the American Type Culture Collection and grown in Dulbecco’s minimum essential medium (DMEM; Gibco BRL, Grand Island, NY, USA) supplemented with 10% foetal bovine serum (FBS) and 100 U/ml penicillin/streptomycin in humidified atmosphere at 37°C and 5% CO2. The miR-613 mimics and control miRNA mimics were purchased from Dharmacon (Austin, TX, USA). The cells were transfected with the miRNA mimics (50 nM) or recombinant plasmid (200 ng) using Dhamafect 1 (Dharmacon, Lafayette, CO, USA) according to the manufacturer’s instructions. Cells were harvested for further analyses performed 48 h after transfection.
Cell proliferation assay
To determine the cell proliferation capacity, cells were monitored using cell growth curves. The cells were plated into 24-well plates (5 × 10³ cells/well), and the cell viability was monitored using the Cell Counting Kit-8 (CCK-8; Dojindo Laboratories, Kumamoto, Japan) at indicated time points (0, 1, 2, 3, 4 and 5 days after seeding into plates). The absorbance value in each well at 570 nm was measured with a Benchmark Microplate Reader (Bio-Rad Laboratories, Hercules, CA, USA).
Cell-cycle assay
The human GBM cells were seeded into six-well plates for 48 h after transfection, collected by centrifugation, washed with cold phosphate-buffered saline (PBS), fixed with 70% cold ethanol and incubated at −20°C overnight. The fixed cells were then collected, washed with PBS and resuspended in Tris-HCl buffer (pH 7.4) supplemented with 100 µg/mL RNase A and labelled for 15 min with propidium iodide (PI). Cell-cycle analysis was performed with a flow cytometer (Becton Dickinson, San Jose, CA, USA) using the ModFit 3.0 software packages.
Apoptosis assay
Flow cytometric analysis was used to evaluate cell apoptosis. Briefly, the cells were seeded into six-well culture plates for 48 h after transfection and then harvested by trypsinization, washed with cold PBS and stained with Annexin V and PI using the Annexin V Apoptosis Detection Kit (Tiangen Biotech Co., Ltd., Beijing, China). Immediately after incubation for 30 min at 4°C in the dark, Annexin V–fluorescein isothiocyanate (FITC) and PI signals were detected using flow cytometry (Becton Dickinson Biosciences, Inc., Franklin Lakes, NJ, USA).
Clone-formation assays
GBM cells were seeded onto 6-cm dishes at a density of 500 cells/well and cultured for 12 days. The clones were fixed with cold methanol for 15 min and then stained with 0.1% crystal violet for 10 min. The clone-formation ability was evaluated as the number of colonies.
Cell invasion assay
The invasion assays were performed using 24-well Transwell chambers (8-µm pore size; Corning Inc., Corning, NY, USA) in 24-well culture plates. A total of 1 × 10⁵ cells suspended in 200 µL serum-free DMEM medium were seeded into the upper chamber of the Transwell insert, which was pre-coated with 1 mg/mL Matrigel (BD Biosciences, Sparks, MD, USA), and 500 µL DMEM medium containing 10% FBS was added to the lower part of the chamber. Following a 24 h incubation, the adherent cells on the membrane of the upper chamber were scrubbed off, and migrated cells were fixed in cold methanol and stained with 2% crystal violet (Sigma, St. Louis, MO, USA). Invasion ability was calculated as the number of invasion cells.
Wound-healing assay
For the wound-healing assay, cells were seeded into 24-well plates (1 × 10⁵ per well) and allowed to grow to 90%–95% confluence. Similar-sized wounds were introduced to monolayer cells using a sterile 200-µL pipette tip. The cells were then washed several times with appropriate culture medium to remove cell debris, and the culture was continued in fresh medium. Wound closure was monitored by microscopy at 24 h using a phase-contrast microscope. Migration capacity was determined as the percentage of wound closure with the initial wound width defined as 100%.
Western blot assays
Cells were lysed on ice using lysis buffer (100 mM 2-ME, 50 mM Tris-HCl (pH 6.8), 2% w/v sodium dodecyl sulphate (SDS), 10% glycerol). Protein concentration was quantified by the bicinchoninic acid (BCA) protein assay kit (Santa Cruz Biotechnology, USA). A volume of 30 µg of protein was separated by 10% SDS-polyacrylamide gel electrophoresis (PAGE) and transferred to an nitrocellulose (NC) membrane (Amersham Bioscience, Buckinghamshire, UK). Membranes were probed with primary antibodies overnight at 4°C and then incubated with the secondary antibodies. The bands were detected with an Enhanced Chemiluminescence (ECL) Kit (GE Healthcare, Beijing, China) and visualized with the ChemiDoc XRS system (Bio-Rad, Hercules, CA, USA). Human polyclonal antibody ARG2 (catalog number: 19324, final dilution 1:1000, Source: Rabbit; Cell Signaling Technology, Boston, MA, USA) was used as the primary antibody. Human monoclonal antibody glyceraldehyde 3-phosphate dehydrogenase (GAPDH; catalog number: 2118, final dilution 1:2000, Source: Rabbit, final dilution 1:1000; Cell Signaling Technology) was used as a control.
Plasmid construction
To construct a luciferase reporter vector, the full-length 3′-UTR of ARG2, as well as the mutant sequence of ARG2, was synthesized by PCR from U87 cells’ cDNA. Muta-Direct Site-Directed Mutagenesis Kit (SBS Genetech Co., Ltd, Beijing, China) was used for plasmid point mutation. The PCR product was cloned into the pMIR-report reporter plasmid downstream of the luciferase gene (Promega, Madison, WI, USA). For re-expression, ARG2 without the 3′-UTR was amplified by PCR with the following primers: forward, 5′-AGATTCTCAGTGCTGCGGATC-3′ and reverse, 5′-TGTCAGTGCAC AGTGTCTC-3′. The resulting PCR amplicons of ARG2 were cloned into the T vector (Promega). The correct clones were confirmed by sequencing.
Luciferase reporter assays
The human GBM cells were grown to 70%–80% confluence in 24-well plates and co-transfected with the recombinant plasmid containing the wild-type/mutant ARG2 3′-UTR and miRNA mimics (50 nM) using Lipofectamine™ 2000 reagent (Invitrogen, Carlsbad, CA, USA) according to the manufacturer’s instructions. Luciferase activity was analysed 48 h after co-transfection using dual-luciferase assays (Promega), and values were normalized against Renilla luciferase gene activity.
Statistical analysis
SPSS software (version 16.0; SPSS Inc., Chicago, IL, USA) was used for statistical analysis. Values are shown as the mean ± standard deviation (SD). Significant differences were analysed using Student’s t-test or chi-square analysis for comparisons between two groups, and one-way analyses of variance or the non-parametric Kruskal–Wallis H test were used for multiple comparisons. Survival rate was performed using the Kaplan–Meier method and the log-rank test. Differences were considered statistically significant at p < 0.05.
Results
MiR-613 expression is downregulated in HCMV-positive GBM specimens
To identify the HCMV status, all of GBM specimens were confirmed by IE1 immunohistochemistry staining and PCR (Figure 1(a) and (b)). The expression of miR-613 in 10 HCMV-positive GBM tissues and 10 HCMV-negative GBM tissues was examined by qPCR. MiR-613 was significantly decreased in HCMV-positive GBM tissues compared with HCMV-negative GBM tissues (Figure 1(c)). However, no difference was found between GBM tissue and adjacent normal tissue (Figure 1(d)). In addition, the level of miR-613 was downregulated after AD169 HCMV strain infection in GBM cells (Figure 1(e)). We also investigate the correlations of miR-613 expression with clinicopathological parameters. Based on the median miR-613 expression in all 64 glioma specimens, the glioma patients were divided into two groups, those with high miR-613 expression levels and those with low expression levels. The results showed that there were significant correlations between miR-613 reduction and unfavourable variables, including tumour size (p = 0.0118) and World Health Organization (WHO) grade (p = 0.0169). No significant difference was observed between miR-613 expression levels and patient age, gender and Karnofsky performance status (Table 1). Furthermore, Kaplan–Meier analysis revealed that patients with low miR-613 expression had significantly poorer tumour-free survival and overall survival rates (Figure 1(f)).

The detection of miR-613 in GBM tissues and cells. (a) IE1 expression was detected by immunohistochemistry in GBM specimens. (b) Clinical GBM samples were amplified using primers for UL83 region of HCMV gene (yielded a band of 346 bp). (c and d) Mature miR-613 expression was determined by TaqMan qPCR in HCMV-positive/negative GBM tissues and adjacent normal tissue (ANT; (*p < 0.05, n = 10). (e) Expression of miR-613 was determined in U87 and U251 cells after AD169 HCMV strain infection (MOI = 1; *p < 0.05, n = 5). (f) Patients were divided into high miR-613 expressers and low miR-613 expressers according to the mean value of the cohort. Kaplan–Meier survival curves for glioma patients with high and low expression of miR-613 (n = 64).
Correlations between miR-613 expression in glioma and clinical characteristics.

WHO: World Health Organization; KPS: Karnofsky performance status.
MiR-613 expression cut-off corresponding to median value in all glioma patients.
p < 0.05.
MiR-613 inhibits cell growth and induces apoptosis in human GBM cells
To investigate the role of miR-613 in human GBM progress, miR-613 was overexpressed in human GBM cells (U87 and U251) by transfection with miR-613 mimics. Increased expression of miR-613 was confirmed by qPCR (Figure 2(a)). CCK-8 assays showed that miR-613 overexpression significantly inhibited the growth of U87 and U251 cells, and this effect increased with time (Figure 2(b)). To further elucidate the anti-growth mechanism of miR-613 in GBM cells, we analysed cell cycle and apoptosis. As shown in Figure 2(c) and (d), overexpression of miR-613 in GBM cells had no significant impact on cell cycle compared with the control group. In contrast, transfection with miR-613 promoted cellular apoptosis (Figure 2(c) and (d)).
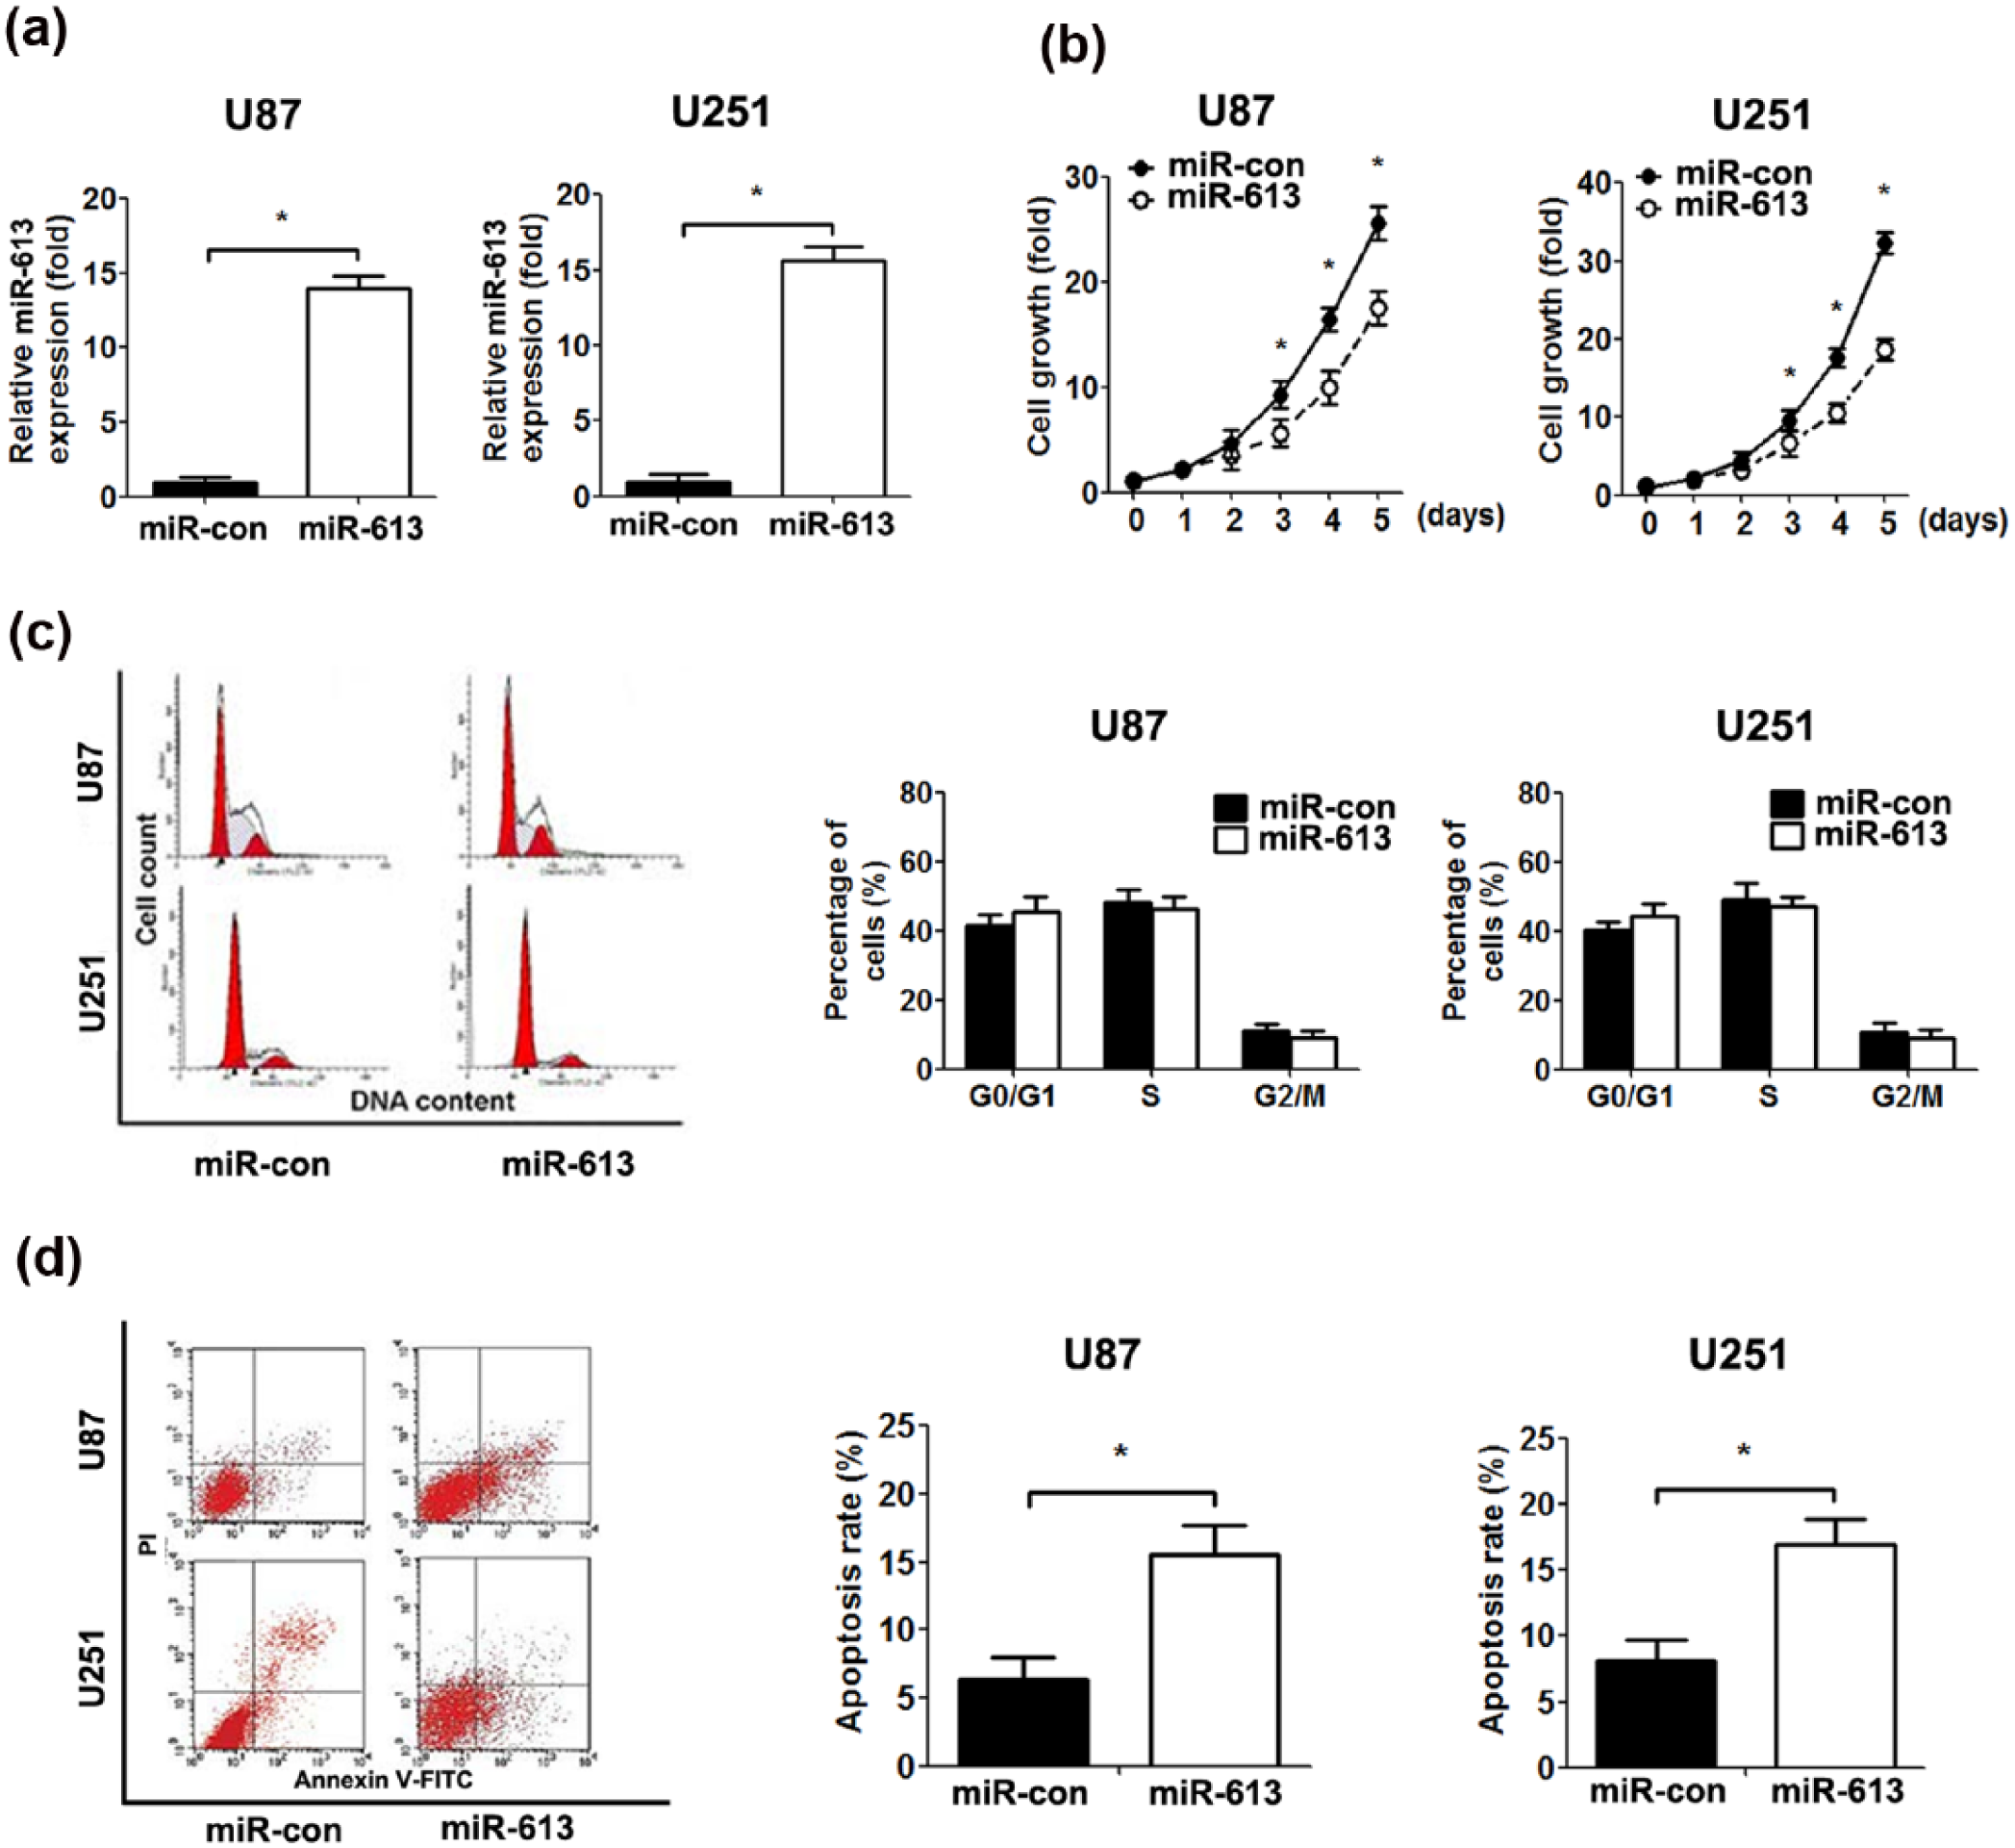
The effect of miR-613 on GBM cell proliferation. U87 and U251 cells were transfected with control or miR-613 mimics for 48 h. (a) Expression of miR-613 was determined in U87 and U251 cells after transfection. (b) Cell growth curves for cells were measured by the CCK-8 assay. Absorbance on day 0 was assigned a value of 1. (c) Representative cell-cycle images. Frequencies of cells at different stages of the cell cycle. (d) Representative images of cell apoptosis. The rate of cell apoptosis (*p < 0.05, n = 5).
MiR-613 suppresses clone formation, cell invasion and migration
The effect of miR-613 on the clone formation, invasion and migration of human GBM cells was evaluated using clone formation, Transwell invasion and wound-healing assays. Our results showed that the number of colonies and invasive GBM cells transfected with miR-613 mimics were significantly decreased compared with the control group (Figure 3(a) and (b)). Consistent with this result, the wound-healing assays also showed that miR-613 overexpression markedly inhibited GBM cell migration (Figure 3(c)).

The effect of miR-613 on the clone-formation, migration and invasion ability of GBM cells. U87 and U251 cells were transfected with control or miR-613 mimics for 48 h. (a) Representative images of the clone-formation assay for 12-day incubation. Quantification of the number of colonies in each disc. (b) Representative images of the Transwell migration assay after 24 h incubation. Quantification of the number of Transwell cells by counting five high-power fields in each chamber. (c) Representative images were taken at 0 and 24 h to assess the cell migration into the open space. Quantification of the percentage of the distance migrated was achieved by measuring these distances in five high-power fields (*p < 0.05, n = 5).
ARG2 is a direct target of miR-613 in GBM cells
As miRNAs govern the expression of mRNAs by targeting the 3′-UTR of relative mRNAs, we detected the target of miR-613 in GBM cells. To demonstrate whether ARG2 is regulated by miR-613 in GBM, we transfected U87 and U251 cells with miR-613 mimics. Western blot analysis showed that miR-613 mimics significantly reduced the expression of AGR2 protein in GBM cells (Figure 4(a)). To verify whether ARG2 is a direct target of miR-613 in GBM cells, we analysed the potential binding sequence for miR-613 in the 3′-UTR region of ARG2 and cloned the wild-type/mutant ARG2 3′-UTR fragments into a luciferase reporter gene system (Figure 4(b)). Wild-type/mutant ARG2 3′-UTR constructs were co-transfected with miR-613/control mimics into U87 and U251 cells, followed by measurement of luciferase activity. Indeed, overexpression of miR-613 in both GBM cell lines led to significantly reduced luciferase activity for the wild-type constructs, whereas no alteration in luciferase activity was detected with the mutant ARG2 3′-UTR luciferase reporter plasmid (Figure 4(c) and (d)).
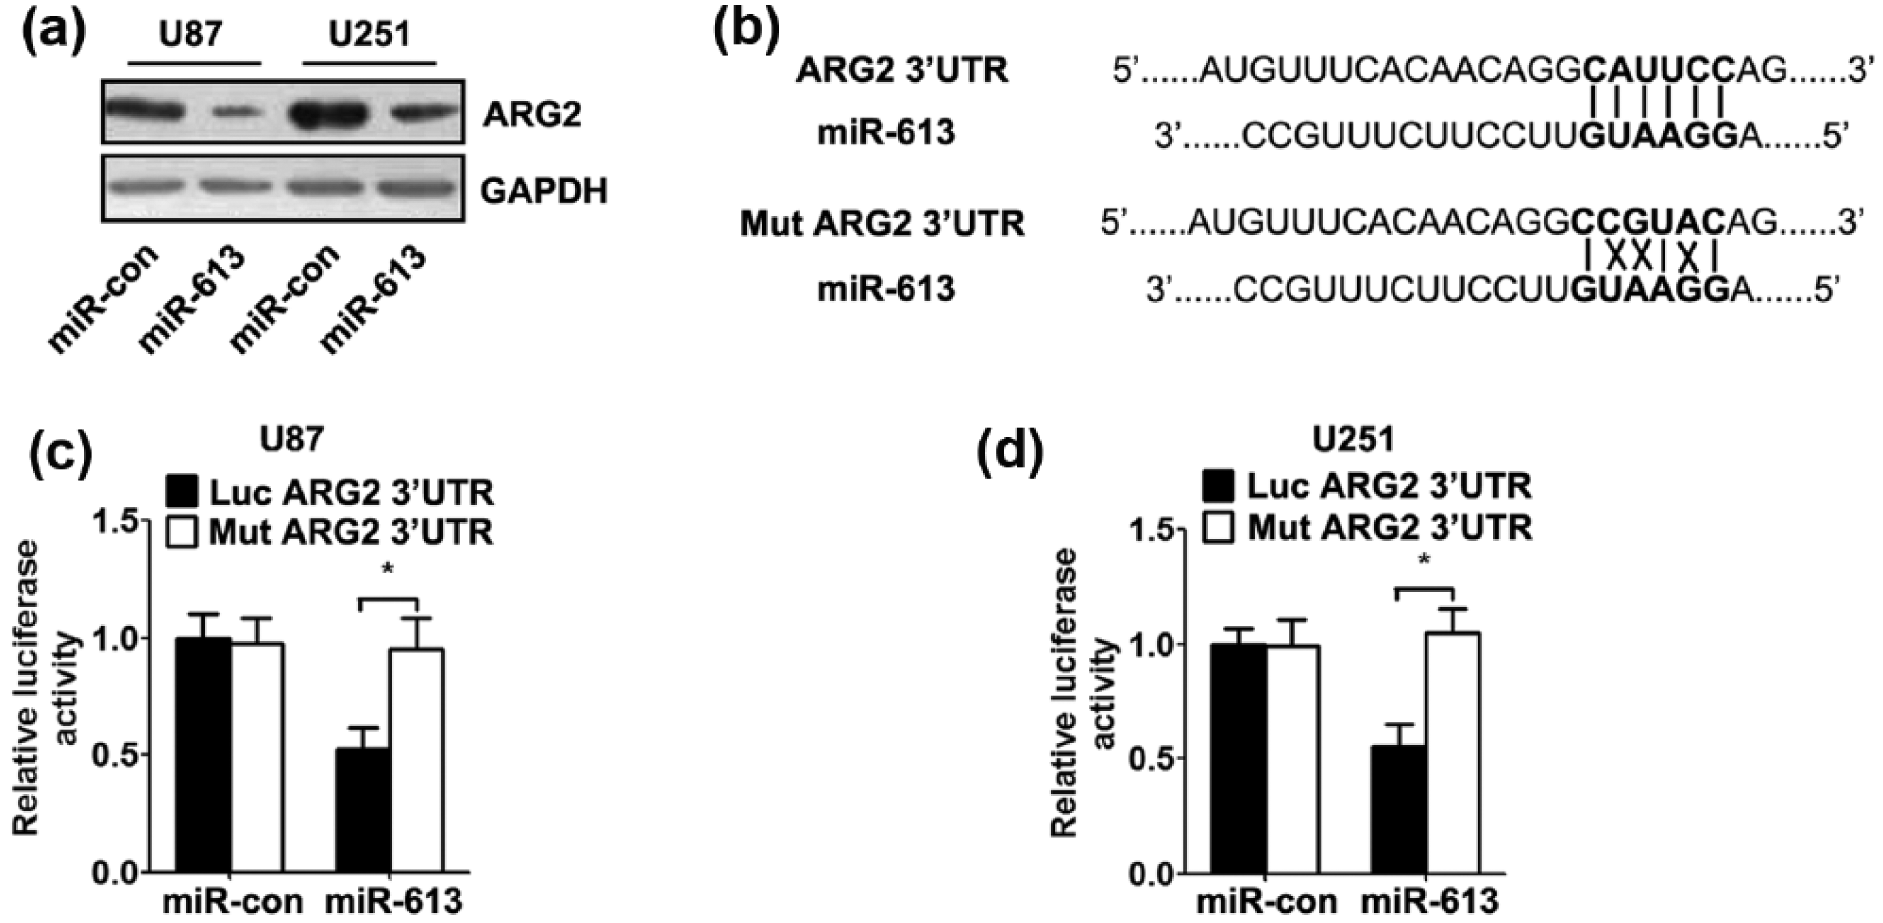
MiR-613 negatively regulates ARG2 expression in GBM cells. (a) ARG2 protein level was detected by western blot in GBM cells after transfection. GAPDH was used as an internal control. (b) The 3′-UTR sequences of wild-type/mutant ARG2 were cloned into the pMIR-report luciferase vector. The predicted binding sites between miR-613 and the 3′-UTR sequence of ARG2 is shown. (c and d) GBM cells were co-transfected with the luciferase reporter plasmid carrying the 3′-UTR sequences of wild-type/mutant ARG2 and control/miR-613 mimics. Luciferase activity was analysed 48 h after co-transfection using dual-luciferase assays (*p < 0.05, n = 5).
Re-expression of ARG2 reverses miR-613-mediated function
To determine whether the role of miR-613 in GBM cell was mediated by ARG2, we transfected U87 and U251 cells with an ARG2-overexpressing plasmid. Western blot analysis demonstrated increased expression of ARG2 proteins in the GBM cells co-transfected with this ARG2 construct compared with those transfected with the empty vector (Figure 5(a)). Re-expression of ARG2 exhibited an apparent rescue of GBM cell proliferation (Figure 5(b)). Cell apoptosis assays showed that re-expression of ARG2 abolished miR-613-induced cell apoptosis in GBM cells (Figure 5(c)). Likewise, clone formation, Transwell invasion and wound-healing assays showed that ARG2 re-expression reversed miR-613-mediated inhibition of clone formation, cell invasion and migration (Figure 5(d)–(f)).
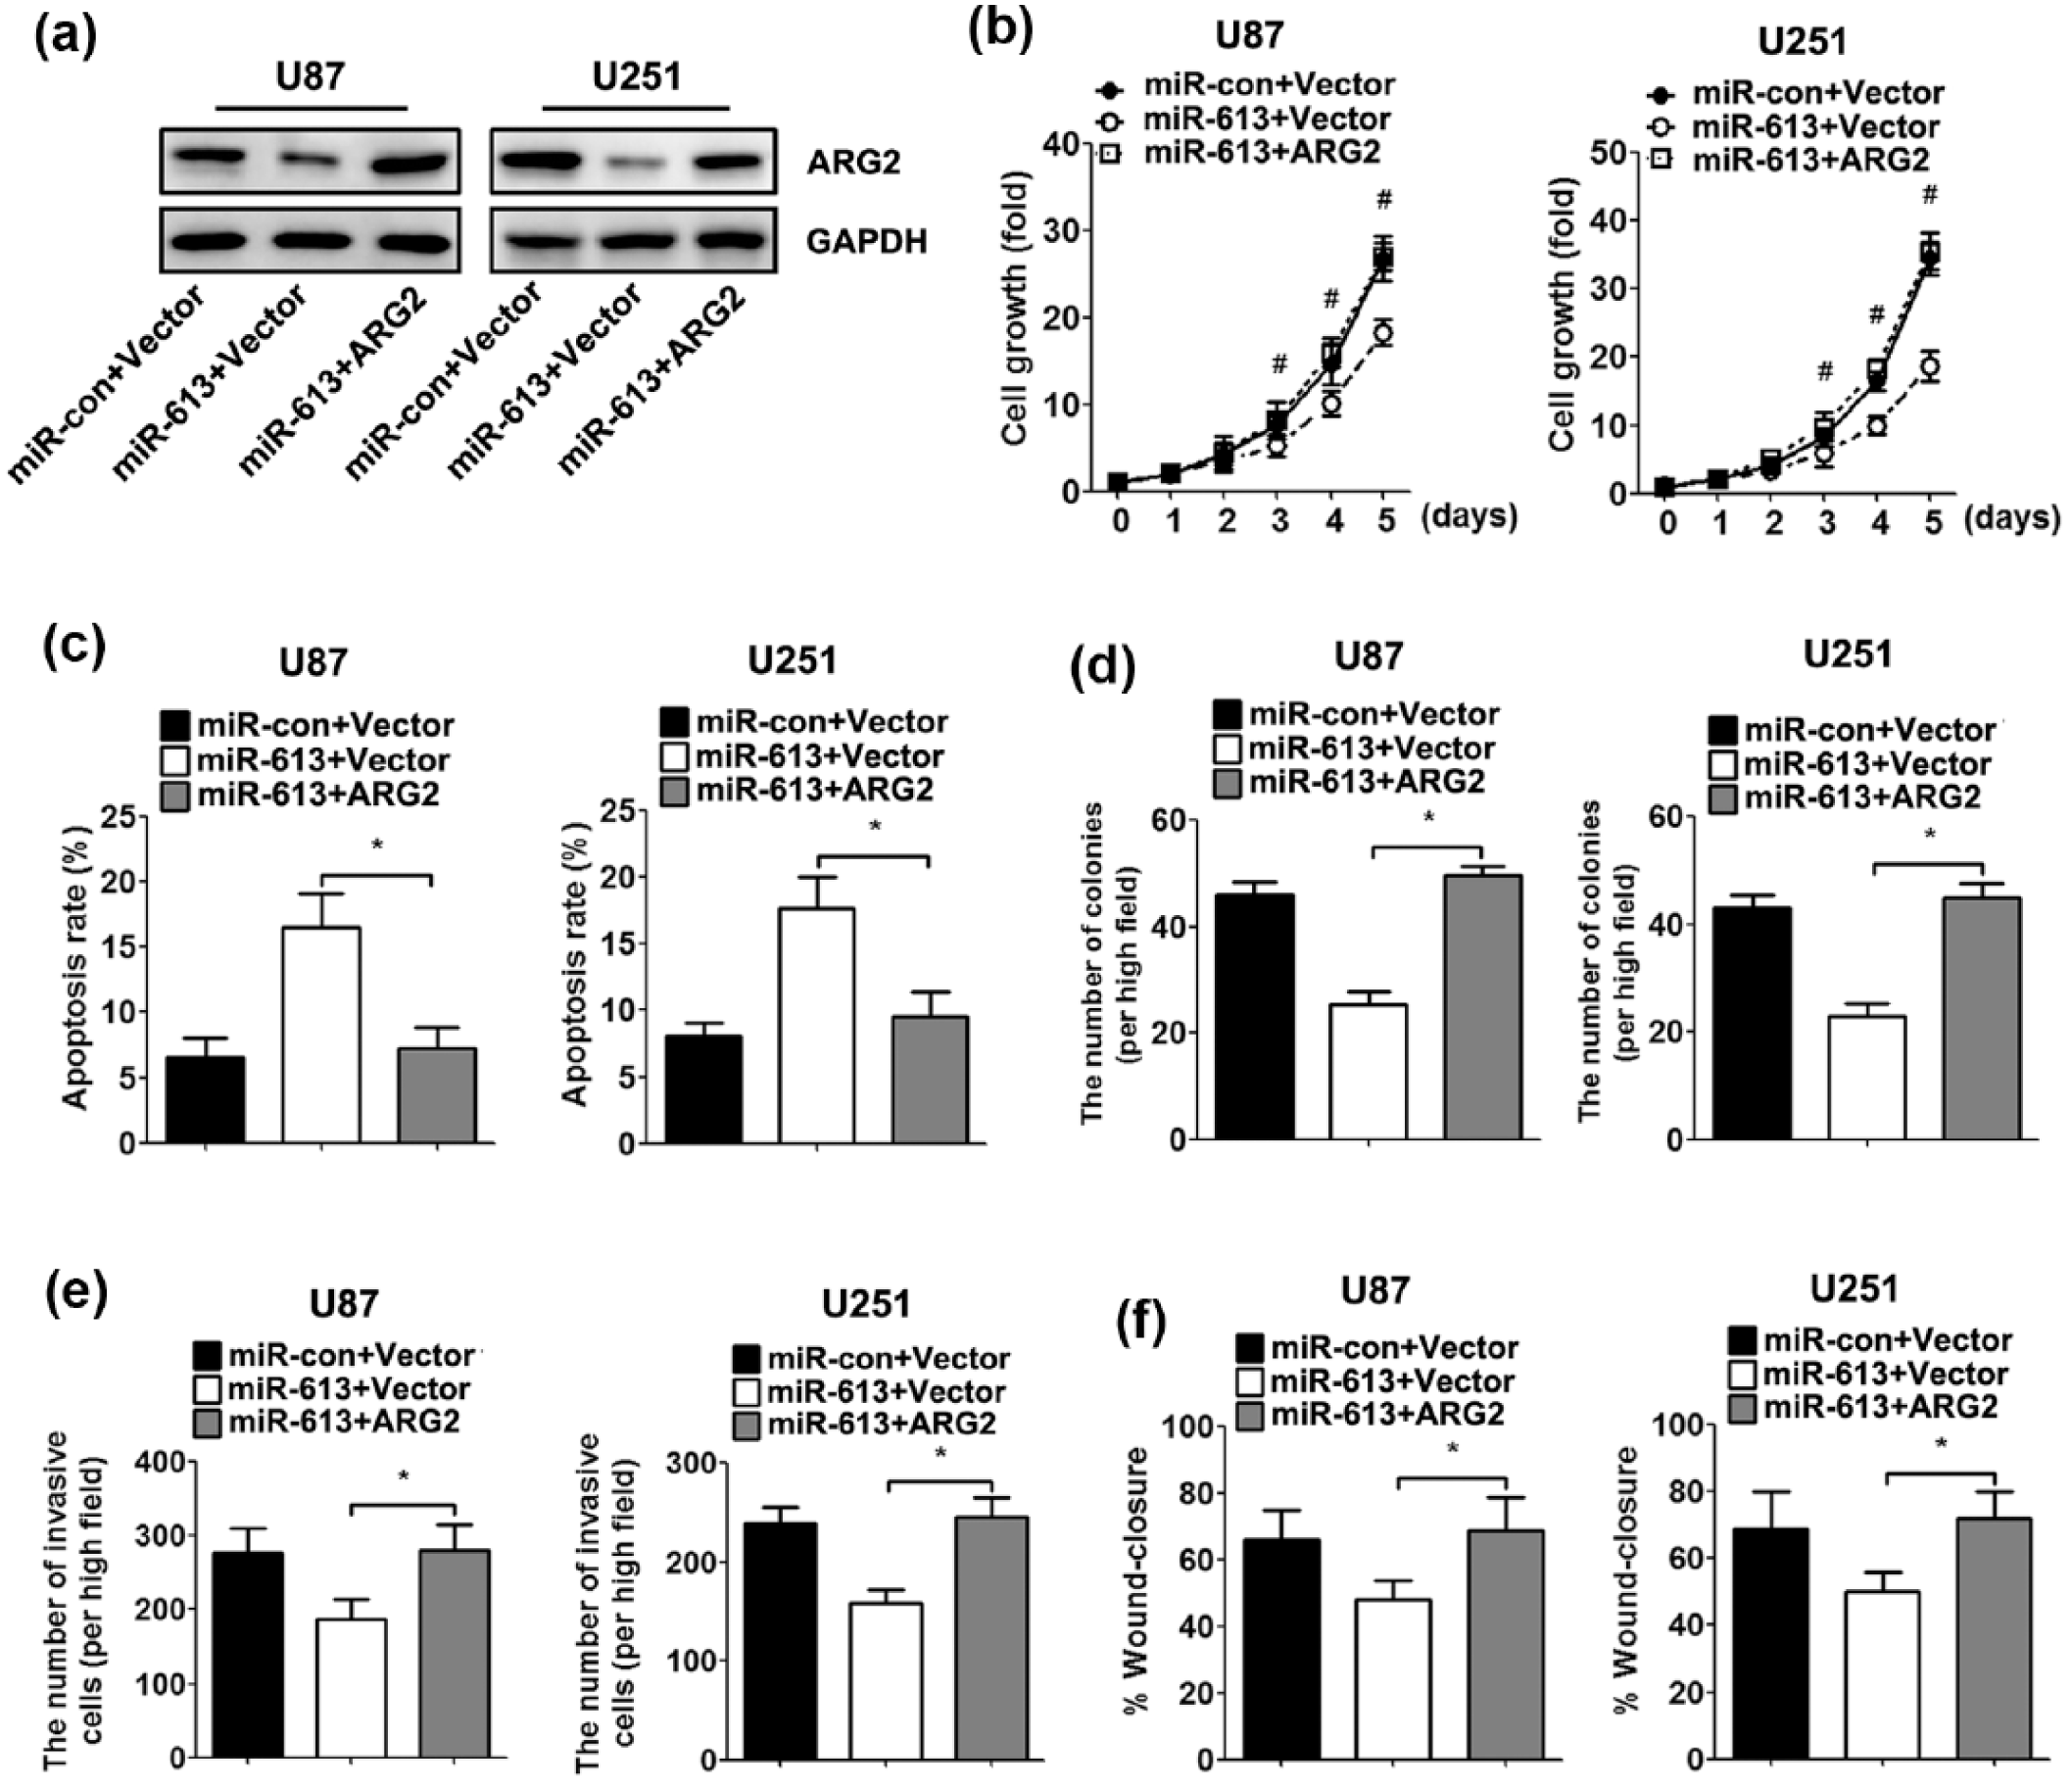
Re-expression of ARG2 reverses the inhibitory properties of miR-613. U87 and U251 cells were co-transfected with control/miR-613 mimics and the empty vector/ARG2 recombinant plasmid for 48 h. (a) The expression of ARG2 protein was analysed by western blot. GAPDH was used as an internal control. (b) Cell growth curves for GBM cells were measured by the CCK-8 assay. (c) Cell apoptosis was analysed by flow cytometry. (d) Clone-formation assay. The number of colonies was quantified. (e) Transwell assays. The number of invasive cells was quantified. (f) Wound-healing assays. The percentage of the distance migrated was quantified (*p < 0.05, n = 5).
Discussion
Elucidating modulatory mechanism specific to given miRNAs using cell lines is essential to determine the prognostic and therapeutic values of particular miRNAs expressed in tumours. Over the past few years, studies have demonstrated that aberrant expression of miRNAs in cancer is not just a random event, but rather an important process during tumour development. 7 Therefore, identification of these small, single-stranded RNAs and their targets involved in tumour pathology would provide valuable insight for the diagnosis and therapy of patients with human malignancies.
Emerging evidence shows that viral infections can be expected to result in changes in cellular miRNA expression that are cellular responses to the infection or alteration induced by the virus. The dysregulation of host miRNAs plays a critical role to foster a more favourable environment to establish and maintain viral latency and replication. 9 A set of cellular miRNAs has been identified that can be regulated by HCMV infection. Moreover, viral-encoded miRNAs usurp cellular miRNA, which exert their biological functions via mRNA destabilization and translational repression. 10 The recent studies suggest that HCMV-encoded miRNAs increase GBM cancer stem cell stemness and act as a potential regulator of HCMV-mediated GBM progression, implying that HCMV-encoded miRNAs are involved in regulating GBM pathophysiological processes.11,12
Our study indicated that miR-613 expression was decreased in HCMV-positive GBM tissue relative to HCMV-negative GBM tissue, and patients with lower levels of miR-613 tended to exhibit larger tumour size, advanced stages of disease and worse survival rate. We also showed that overexpression of miR-613 in GBM cells decreased cell proliferation, clone formation, invasion and migration and markedly upregulated apoptosis. These results were consistent with previous studies demonstrating that downregulation of the miR-613 has frequently been detected in various malignancy, including colorectal cancer, 13 osteosarcoma cancer, 14 non-small-cell lung cancer 15 and papillary thyroid cancer. 16 Mir-613 suppresses proliferation, migration and invasion of various tumours, revealing that mir-613 plays a tumour suppressor role. Our data first revealed a novel biological function for miR-613 in GBM and suggested that miR-613 might play a crucial role in HCMV-associated GBM pathogenesis.
Arginase, a metalloenzyme, is expressed primarily in extra-hepatic tissue, such as kidney, brain and retina. The Arginase family includes ARG1 and ARG2, which hydrolyzes the semi-essential amino acid
In conclusion, our data revealed the important molecular mechanism by which miR-613 exerts its negative effects on proliferation, clone formation, invasion and migration in human GBM cells using concomitant suppression of ARG2. Indeed, miR-613 acts a progression factor during glioma progression. In our future work, we will detect the change in the expression of miR-613 as the progression of glioma. This newly identified target of miR-613 may be employed as a prognostic marker and therapeutic target for GBM patients.
Footnotes
Acknowledgements
Y.W. and P.Z. have contributed equally to this work.
Declaration of conflicting interests
The author(s) declared no potential conflicts of interest with respect to the research, authorship, and/or publication of this article.
Funding
The author(s) received no financial support for the research, authorship, and/or publication of this article.