
Abstract
Multiple factors contribute to the development and progression of breast cancer. Markers of tumor growth and invasion, cell death, immune activation, and angiogenesis can be assessed in parallel by a novel multiplex immunoassay panel. The diagnostic performance of a multiplex cancer biomarker magnetic bead panel comprising 24 tumor associated parameters was evaluated in sera of 154 women including 77 patients with breast cancer, 10 with precancerous lesions, 31 with benign breast diseases, and 36 healthy controls. Marker levels were log-transformed for variance stabilization. Significance testing was done using t-test or Wilcoxon rank-sum test with correction of p values for multiple testing. Furthermore, receiver operating characteristic analyses were performed. Serum levels of several biomarkers were significantly (p ≤ 0.001) higher in cancer patients than in healthy controls, particularly alpha-fetoprotein, cancer antigen 15-3, cancer antigen 19-9, migration inhibitory factor, carcinoembryonic antigen, cancer antigen 125, hepatocyte growth factor, soluble Fas, tumor necrosis factor-α, stem cell factor, and osteopontin. As most markers were also elevated in benign breast diseases, only cancer antigen 15-3 showed significant differences to cancer patients (p ≤ 0.001). The resulting areas under the curve in receiver operating characteristic curves for discrimination between benign and malignant breast diseases achieved 0.71 with a sensitivity of 33.8% at 95% specificity. Multiplexing enables parallel analysis of different biomarker classes for cancer detection. Established cancer antigen 15-3 proved to be most relevant for differential diagnosis.
Introduction
The fact that cancer is a global health problem with the highest prevalence in regions with a very high human development index 1 opens a great field for research. Breast cancer belongs to the most frequent cancer diagnosis among women presenting the highest incidence and 5-year-prevalence worldwide.2,3 Summing up, gynecological cancers also show the highest mortality rate, whereby breast cancer is the entity with the highest number of death cases of women worldwide. 3
As 98.5% of breast cancer patients with localized disease and, in contrast, only 25% of those with metastatic breast cancer survive over 5 years, 4 there is a hope that appropriate diagnostic methods for early diagnosis could promise a better overall survival of cancer patients by receiving adequate therapy options at early stages. Currently, the diagnostic sequence of breast cancer, recommended by European Society for Medical Oncology (ESMO) clinical practice guidelines, is composed by assessment of general health status, mammography, ultrasound, breast magnetic resonance imaging (MRI) (not routinely recommended), and biopsy. 5 Sensitivity of mammography screening mostly depends on patients’ age and breast density6,7 requiring additional diagnostic tools or markers in order to reassure the diagnosis. However, in current studies, no biomarker was characterized to be specific for diagnostics in gynecological oncology, and there are only a few tumor markers recommended by the National Academy of Clinical Biochemistry (NACB) to be used as a complementary tool in therapy monitoring and follow-up of diagnosed diseases.8–10
Tumor tissues or cells were proven to secrete biomarkers into the blood caused by higher proliferation rate of cells, apoptosis processes, angiogenesis, and activation of the immune system.11,12 The presence of tumor disease is assumed to be reflected by the biomarker profile in serum, the measurement of which could be an ideal and minimal invasive diagnostic tool. Novel multiplex immunoassays offer a compelling spectrum of different biomarker classes, which can be detected simultaneously. The assay used in this study allows parallel assessment of 24 markers consisting of well-established as well as upcoming promising oncological, cell death, angiogenesis, and immunological biomarkers, using only a minimal volume of serum samples and represents a cost- and time-effective tool for multi-marker measurement.
As this recently released assay is currently available for research use only, we tested the methodical and pre-analytical accuracy of the various markers in a previous study. Thereby a good stability and precision was found for most biomarkers included in the panel. 13 Also, other studies validated and compared multiplex immunoassays with mostly acceptable and promising results.14,15 As next step closer to clinical use, the diagnostic performance of single markers and combinations to detect breast cancer was assessed in this study. Thereby we tested the discriminative power of the marker panel between cancer patients, with a special focus on early cancer stages, from healthy women. In addition, we used a cohort of patients with benign breast diseases as control group as physicians often are confronted with symptomatic patients and need markers to distinguish between benign and malignant lesions.
Materials and methods
Patients
In this study, serum samples from 154 women were analyzed. Among them were 77 patients with diagnosed breast cancer, mainly in early Union for International Cancer Control (UICC) stages (31 in stage 1, 25 in stage 2, 12 in stage 3, and 9 in stage 4), further 10 patients with precancerous lesions (ductal carcinoma in situ (DCIS)). As control groups, 31 patients with benign breast diseases (ductal hyperplasia, mastopathy, mastitis, etc.) as well as 36 healthy women were included. Detailed patient characteristics are listed in Table 1.
Patients’ characteristics.

Concerning inclusion criteria, only patients with active disease at time of venipuncture were considered in this study. This is primarily diagnosed or relapsed breast cancer before surgery or chemotherapy. In six cases, samples were taken after neoadjuvant chemotherapy when active disease was still present. Patients were not included if surgery was already performed or chemotherapy was ongoing. Furthermore, secondary tumor sites in the past or as a parallel diagnosis, which could influence the biomarker profile in serum, led to exclusion from the study as well.
All patients gave informed consent for blood collection in the Biofluid Biobank of the University Hospital Bonn at the Institute for Clinical Chemistry and Clinical Pharmacology supported by Centre for Integrated Oncology Cologne-Bonn (CIO). This process as well as the use of the samples for the planned study was approved by the Local Ethics Committee of the University Bonn.
Serum samples of patients and controls were collected between 2010 and 2012 within the diagnostic period of a clinical stay or ambulant consultations at the Department for Gynecology and Obstetrics of the University Hospital Bonn prior to any therapy and simultaneously with the routine blood samplings. Collected blood samples were immediately delivered to the Central Laboratory of the University Hospital Bonn, where the serum tubes were centrifuged at 4000 r/min (3300G) for 10 min. Subsequently, serum samples were stored at 4°C until they were aliquoted into polypropylene vials and archived at −80°C in the biobank store, labeled with a double-pseudonomized code. Corresponding to the code, the clinical history of each patient was documented in detail.
Methods
In this study, we used the MILLIPLEX™ MAP Human Circulating Cancer Biomarker Magnetic Bead Panel 1, 96-well plate assay (EMD Millipore™, Billerica, MA, USA) that was run on the Bio-Plex™ 200 system (Biorad, Hercules, CA, USA). The assays were purchased from EMD Millipore included all reagents needed and an appropriate plate required for the assay.
Principle and procedure are described in detail at Hermann et al. 13 The immunoassay reaction takes place on the surface of specifically fluorescent-coded magnetic beads (MagPlex™-C microspheres) that are functionalized with 24 different analyte-specific antibodies. After addition of patient samples and standards, incubation with biotinylated detection antibodies and a streptavidin-phycoerythrin (PE) conjugate complete the reaction on the microspheres and enable flow cytometric detection on the Bio-Plex 200 system.
The marker panel comprises the following markers: carcinoembryonic antigen (CEA), alpha-fetoprotein (AFP), total prostate-specific antigen (total-PSA), cancer antigen 15-3 (CA 15-3), CA 19-9, CA 125, cytokeratine 19-fragment (CYFRA 21-1), β-human chorionic gonadotropin (β-HCG), human epididymis protein 4 (HE4), osteopontin (OPN), prolactin, soluble Fas (sFas), soluble Fas-ligand (sFasL), tumor necrosis factor (TNF)-related apoptosis-inducing ligand (TRAIL), vascular endothelial growth factor (VEGF), interleukin-6 (IL-6), IL-8, TNFα, transforming growth factor-β (TGFβ), fibroblast growth factor-2 (FGF2), macrophage migration inhibitory factor (MIF), leptin, hepatocyte growth factor (HGF), and stem cell factor (SCF).
To assure appropriate assay function, calibration curves and quality controls provided by the manufacturer were used. In addition, serum sample pools in different value ranges were included and mixture of samples from cancer patients and control groups were placed in each plate. As intra-assay precision was acceptable with coefficients of variation (CVs) below 15% for most assessed biomarkers, 13 patient samples were run in singles.
Statistics
Performance of single biomarkers was assessed for the discrimination between breast cancer patients and healthy controls as well as between breast cancer patients and patients with benign breast diseases. Further subgroup analyses were done for DCIS patients with healthy controls. Biomarker levels were log-transformed for variance stabilization. Significance testing was done using t-test or Wilcoxon rank-sum test when data were not following a normal distribution. To address the multiple testing-problem, the significance level was adjusted to p ≤ 0.001 following a Bonferroni correction. In addition, areas under the curve (AUC) of receiver operating characteristic (ROC) curves were calculated and sensitivities of relevant biomarkers at 95% specificity versus the control group were given. Finally, ROC curves and sensitivities of the combination of most meaningful markers were calculated.
Results
Regarding the quality of the measurements, QC 1 and 2, all standards as well as serum pools met the expected ranges for most biomarkers and once again showed good accuracy in the inter-plate comparison: the CVs were below 20% for 23 biomarkers in QC1 and 2, for all markers in the standards and for 16 biomarkers in the higher concentrated serum pool 1. 13
In the clinical evaluation, several biomarkers were significantly higher in cancer patients than in healthy controls. This applies for the tumor markers CA 15-3 (p = 0.0001), CEA (p < 0.0001), CA 125 (p = 0.0001), CA 19-9 (p < 0.0001), AFP (p = 0.0001), MIF (p < 0.0001), HGF (p < 0.0001), sFas (p < 0.0001), TNFα (p = 0.0003), SCF (p < 0.0001), and OPN (p = 0.0002) (Figures 1 and 2). Detailed results with medians, ranges, and p values of all markers are indicated in Tables 2 and 3. Although the significance for TNFα was shown, it has to be mentioned that most levels of TNFα as well as of further markers β-HCG, HE4, sFasL, IL-6, IL-8, TGFβ, FGF2, and VEGF were in the very low concentration range where accuracy was lower and clinical relevance could be challenged.

Heatmap of biomarker levels in various patient groups. Observed marker concentrations are represented in color depending on the level: low levels are displayed in bright green, moderate levels in dark green over black to dark red, and very high marker levels in bright red. Included patients are grouped in healthy individuals, patients with benign, precancerous (DCIS), and malignant breast diseases in order to visualize the marker levels trends.

Distribution of biomarker levels in various patient groups. Box plots for biomarkers CA 15-3, CEA, CA 125, CA 19-9, OPN, HGF, sFas, and MIF show medians, means, interquartile ranges, whiskers, and outliers for the groups of healthy individuals, patients with benign, precancerous (DCIS), and malignant breast diseases.
Value distribution for measured parameters in clinical groups.
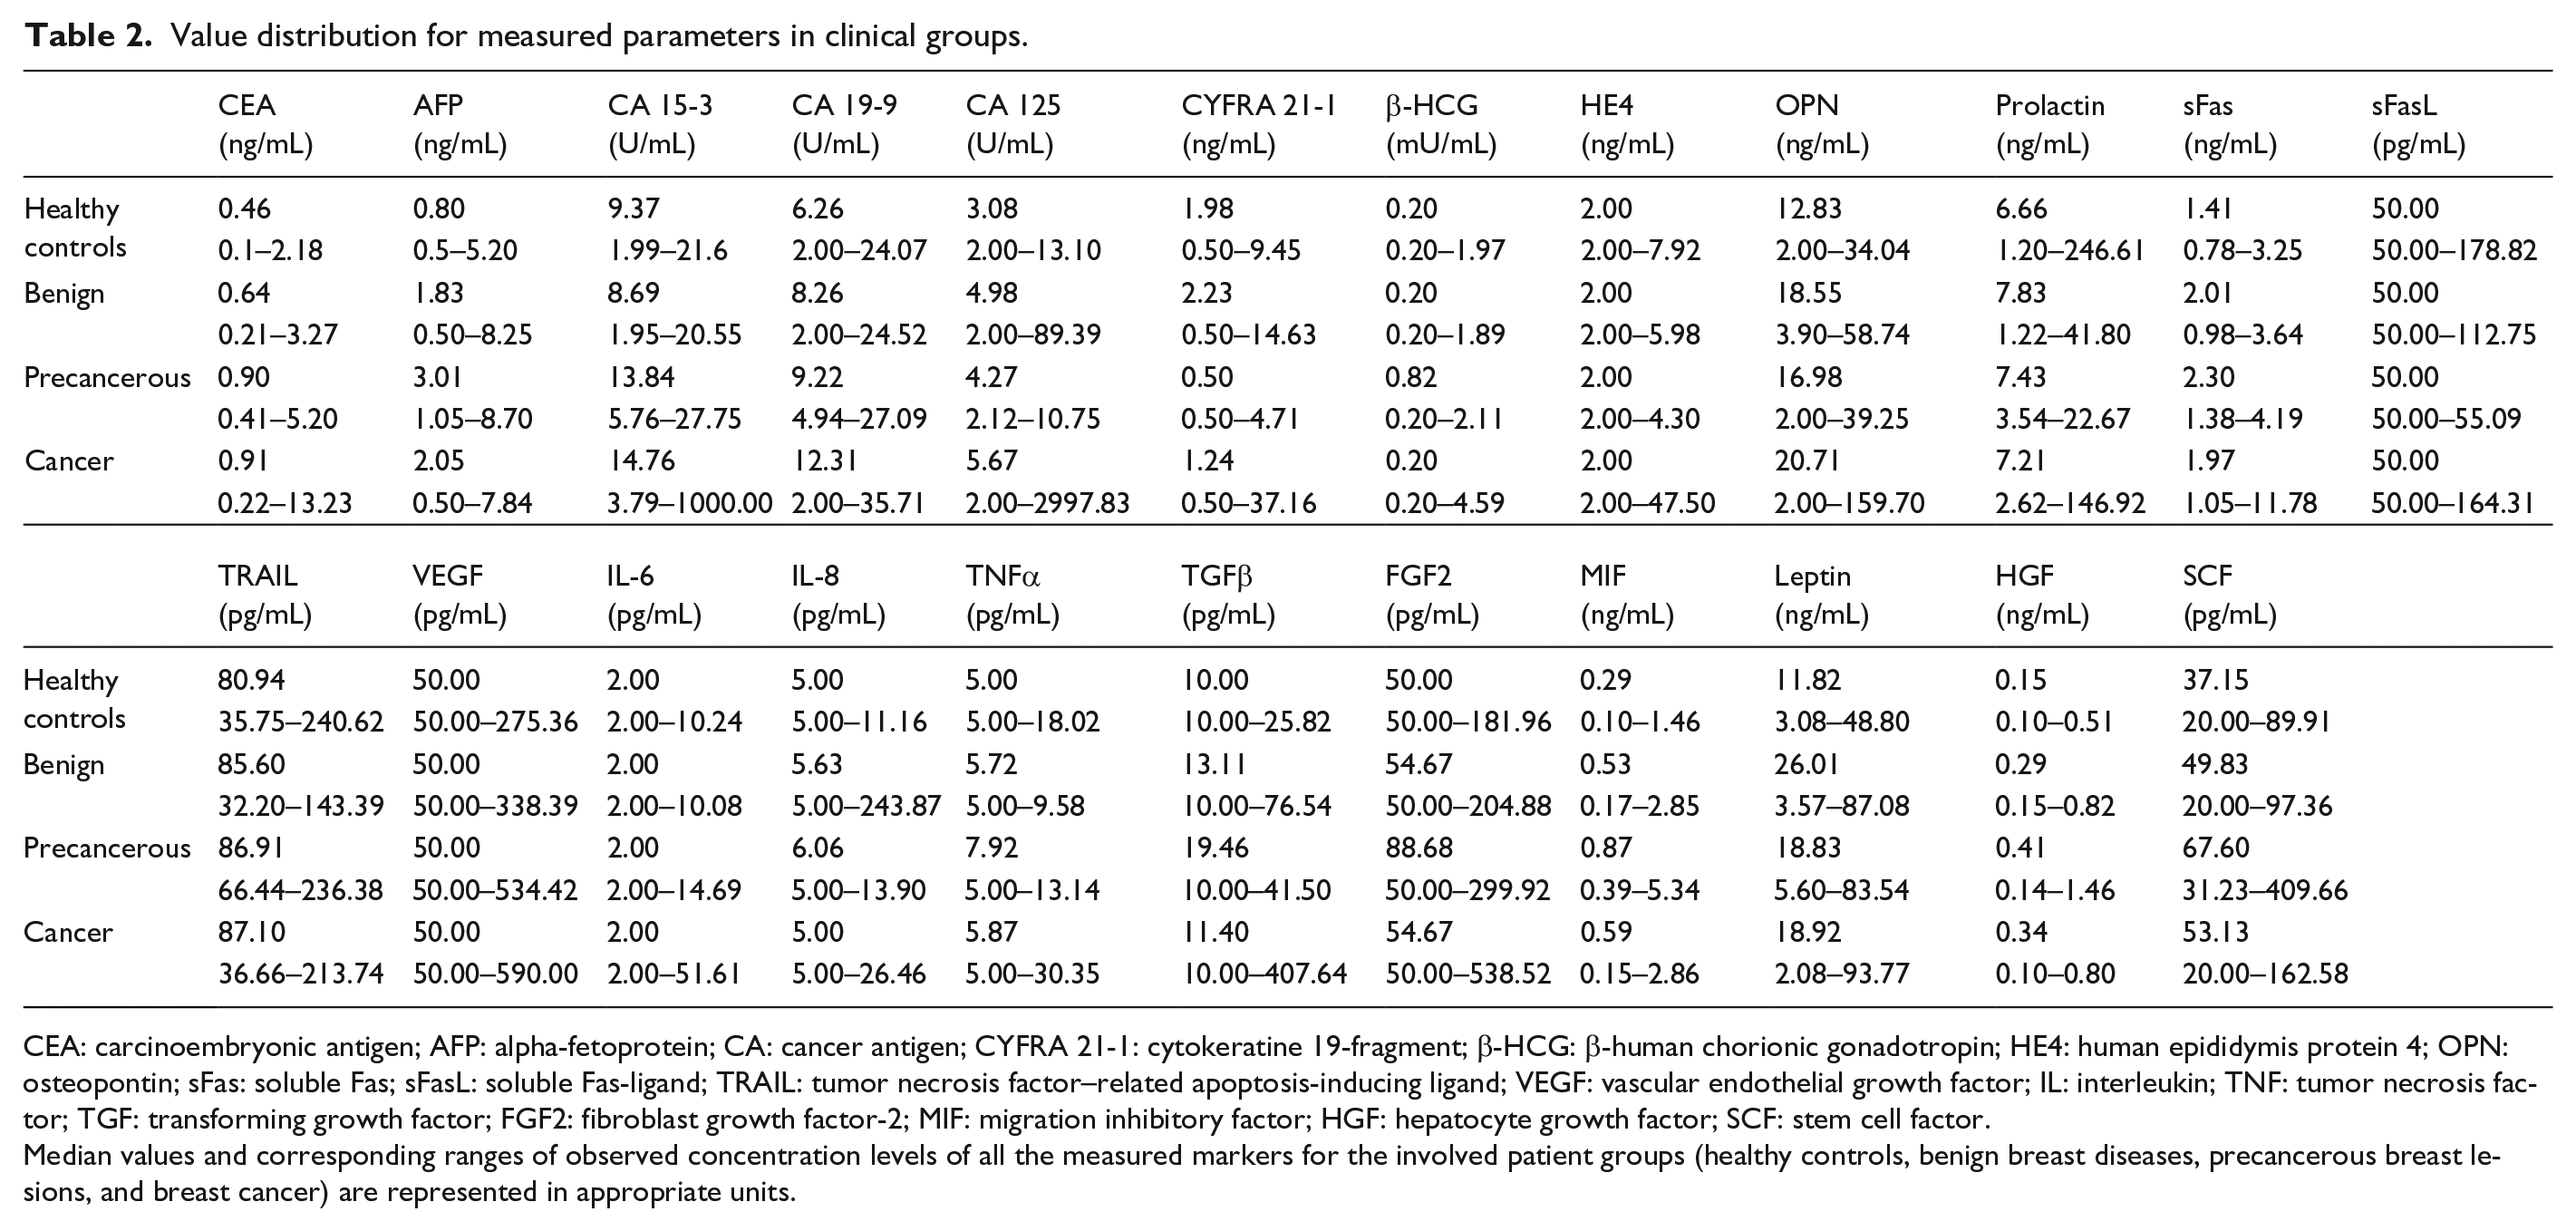
CEA: carcinoembryonic antigen; AFP: alpha-fetoprotein; CA: cancer antigen; CYFRA 21-1: cytokeratine 19-fragment; β-HCG: β-human chorionic gonadotropin; HE4: human epididymis protein 4; OPN: osteopontin; sFas: soluble Fas; sFasL: soluble Fas-ligand; TRAIL: tumor necrosis factor–related apoptosis-inducing ligand; VEGF: vascular endothelial growth factor; IL: interleukin; TNF: tumor necrosis factor; TGF: transforming growth factor; FGF2: fibroblast growth factor-2; MIF: migration inhibitory factor; HGF: hepatocyte growth factor; SCF: stem cell factor.
Median values and corresponding ranges of observed concentration levels of all the measured markers for the involved patient groups (healthy controls, benign breast diseases, precancerous breast lesions, and breast cancer) are represented in appropriate units.
Discriminative power between malignant, precancerous, and benign breast lesions from controls.

CEA: carcinoembryonic antigen; AFP: alpha-fetoprotein; CA: cancer antigen; CYFRA 21-1: cytokeratine 19-fragment; β-HCG: β-human chorionic gonadotropin; HE4: human epididymis protein 4; OPN: osteopontin; sFas: soluble Fas; sFasL: soluble Fas-ligand; TRAIL: tumor necrosis factor–related apoptosis-inducing ligand; VEGF: vascular endothelial growth factor; IL: interleukin; TNF: tumor necrosis factor; TGF: transforming growth factor; FGF2: fibroblast growth factor-2; MIF: migration inhibitory factor; HGF: hepatocyte growth factor; SCF: stem cell factor.
p values indicate the discriminating power of measured parameters between the following subgroups: healthy individuals versus breast cancer patients at any stage, healthy versus benign breast diseases, healthy versus precancerous breast diseases and benign breast disease patients versus breast cancer patients at any stage. After Bonferroni correction, the acceptable significance level was set on p ≤ 0.001. Considerable results are presented in bold italic fonts.
Precancerous breast lesions (DCIS) could be discriminated from healthy controls by AFP (p = 0.0006), MIF (p = 0.0008), and sFas (p = 0.0006). Significant differences between control groups with benign breast lesions and healthy controls were observed for AFP (p = 0.0009), MIF (p < 0.0001), HGF (p < 0.0001), sFas (p < 0.0001), and OPN (p = 0.0008) (Tables 2 and 3).
Most important for differential diagnosis is the comparison of symptomatic patients, this is between breast cancer patients and patients with benign breast diseases. Here, the well-established tumor marker CA 15-3 discriminated best between both groups with the p-value of 0.0002. In addition, CEA and CA 19-9 showed some discriminative potential with p = 0.0042 and p = 0.0290, respectively. Most immunologic and cell death markers were elevated in benign breast diseases as well and therefore could not discriminate between benign and malignant diseases (Tables 2 and 3, Figures 1 and 2).
With regard to stage dependency in breast cancer patients, a trend to higher levels in advanced stages, particularly stage 4, was found for many markers, such as for CA 15-3, CA 125, OPN, HGF, sFas, and immunological markers IL-8, IL-6, TNFα, and TGFβ. Significant differences between patients with metastatic and non-metastatic cancers were observed for TNFα and OPN (p = 0.0236 and p = 0.0323, respectively) (Tables 4 and 5).
Value distribution for measured parameters in breast cancer stages 1–4.
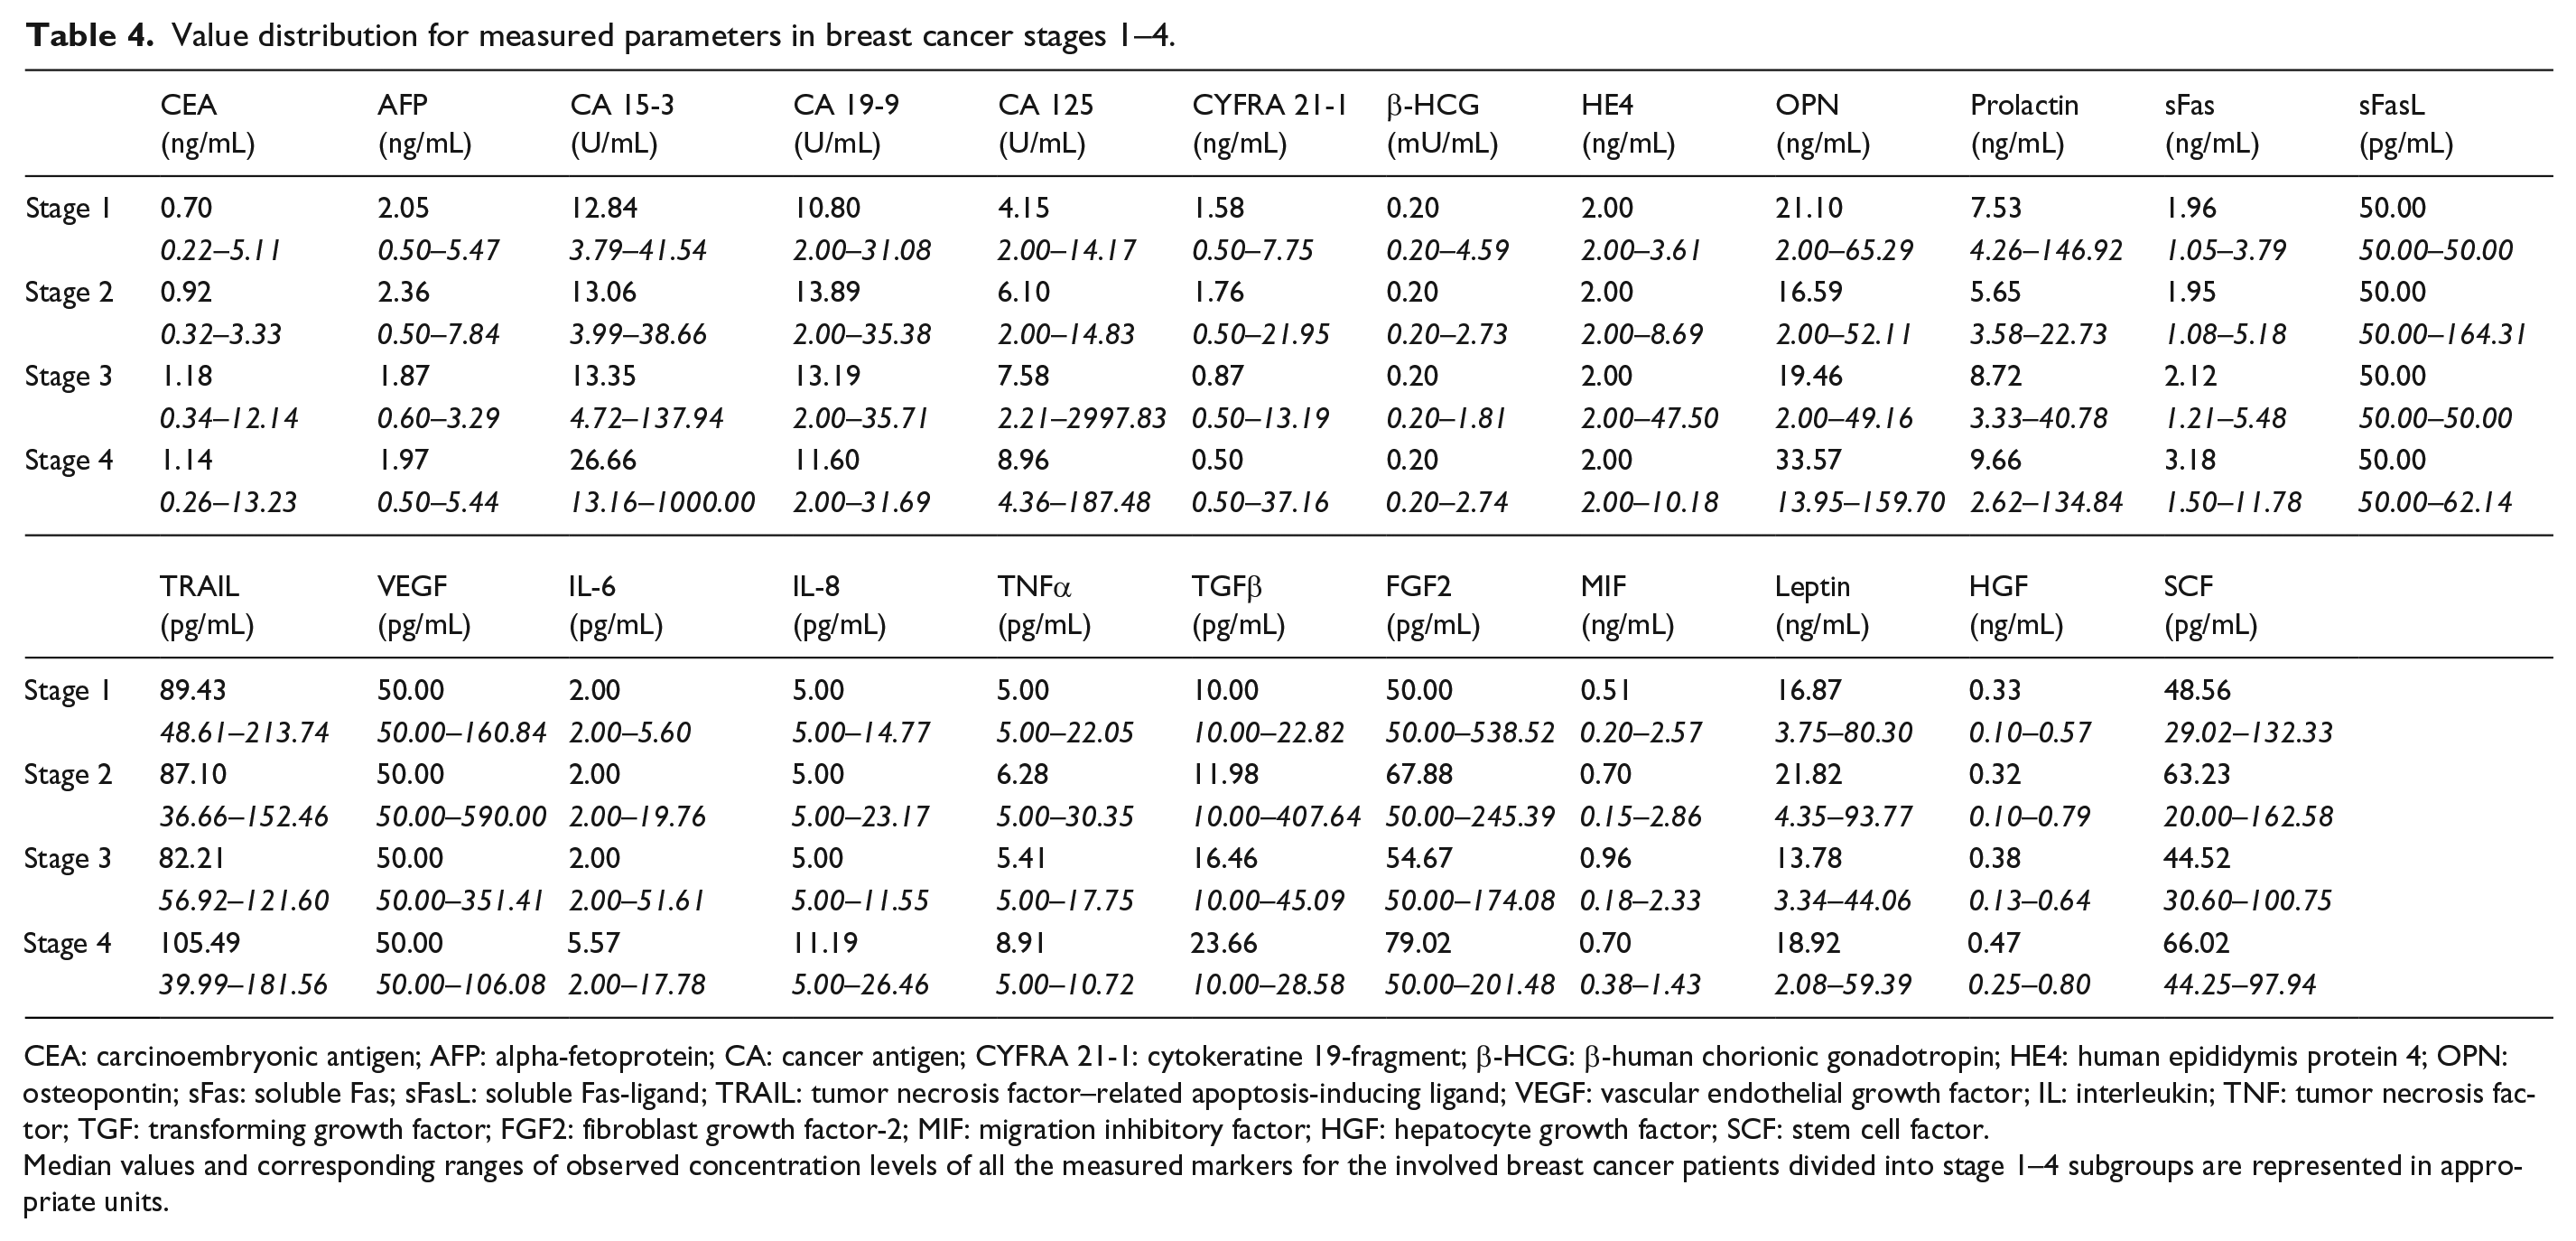
CEA: carcinoembryonic antigen; AFP: alpha-fetoprotein; CA: cancer antigen; CYFRA 21-1: cytokeratine 19-fragment; β-HCG: β-human chorionic gonadotropin; HE4: human epididymis protein 4; OPN: osteopontin; sFas: soluble Fas; sFasL: soluble Fas-ligand; TRAIL: tumor necrosis factor–related apoptosis-inducing ligand; VEGF: vascular endothelial growth factor; IL: interleukin; TNF: tumor necrosis factor; TGF: transforming growth factor; FGF2: fibroblast growth factor-2; MIF: migration inhibitory factor; HGF: hepatocyte growth factor; SCF: stem cell factor.
Median values and corresponding ranges of observed concentration levels of all the measured markers for the involved breast cancer patients divided into stage 1–4 subgroups are represented in appropriate units.
Discriminative power between non-metastatic (M0) and metastatic (M1) breast cancers.

CEA: carcinoembryonic antigen; AFP: alpha-fetoprotein; CA: cancer antigen; CYFRA 21-1: cytokeratine 19-fragment; β-HCG: β-human chorionic gonadotropin; HE4: human epididymis protein 4; OPN: osteopontin; sFas: soluble Fas; sFasL: soluble Fas-ligand; TRAIL: tumor necrosis factor–related apoptosis-inducing ligand; VEGF: vascular endothelial growth factor; IL: interleukin; TNF: tumor necrosis factor; TGF: transforming growth factor; FGF2: fibroblast growth factor-2; MIF: migration inhibitory factor; HGF: hepatocyte growth factor; SCF: stem cell factor.
p values indicate the discriminating power of measured parameters between the subgroups of non-metastatic (M0) and metastatic (M1) breast cancers. At a significance level of p ≤ 0.05, considerable results are presented in bold italic fonts.
Correlations between clinical relevant markers with correlation coefficients R > 0.5 were observed for the comparisons MIF/TNFα (R = 0.501), sFas/TNFα (R = 0.534), and SCF/TNFα (R = 0.651).
The power of discrimination between groups is indicated best by ROC curves and sensitivities at defined specificity. For the comparison between patients with breast cancer and healthy controls, best performance was obtained for HGF (AUC: 0.86; 95% confidence interval (CI): 0.79–0.92), MIF (AUC: 0.81; 95% CI: 0.73–0.89), and sFas (AUC: 0.80; 95% CI: 0.72–0.88). Combination of HGF and sFas improved the AUC to 0.91 (95% CI: 0.86–0.96). Sensitivity was 41.7% at 95% specificity and 75.0% at 90% specificity (Figure 3(a)). CA 15-3 yielded an AUC of 0.71 (95% CI: 0.61–0.81) and CEA an AUC of 0.77 (95% CI: 0.68–0.85).

Discriminative power of biomarkers between breast cancer and controls. Receiver operating characteristic (ROC) curves provide a sensitivity–specificity profile over the whole range of possible cutoffs for the discrimination between breast cancer and healthy controls for which the combination of (a) HGF and sFas yielded the best performance with an area under the curve (AUC) of 0.91 (95% CI: 0.86–0.96). For the comparison between breast cancer and benign breast disease, best performance was observed for (b) CA 15-3 with an AUC of 0.71 (95% CI: 0.61–0.81) followed by (c) CEA with an AUC of 0.64 (0.53–0.74). (d) Combination of both markers yielded an AUC of 0.72 (0.62–0.82).
For the differential diagnostically more relevant comparison between patients with breast cancer and patients with benign breast diseases, CA 15-3 showed the best performance with an AUC of 0.71 (95% CI: 0.61–0.81) in ROC curves and a sensitivity of 33.8% at 95% specificity followed by CEA with an AUC of 0.64 (95% CI: 0.53–0.74) and a sensitivity of 32.5% at 95% specificity. Combination of both markers slightly improved AUC to 0.72 (95% CI: 0.62–0.82) and sensitivity to 40.3% at 95% specificity (Figure 3(b)–(d)).
Discussion
One of the main clinical points to improve is the early diagnosis of cancer and appropriate differentiation between benign and malignant lesions in order to apply correct therapy options. There are a few established screening diagnostics for early detection of disease as, for instance, mammography, pap smear test, fecal occult blood test (FOBT) or fecal immunological hemoglobin test (FIT) and PSA test, which are definitely upgradeable still yielding false-positive and false-negative results. In breast cancer, established tumor markers CA 15-3 and CEA are frequently used for differential diagnosis in symptomatic patients and for monitoring the course of disease.16–18
Multiple clinical studies are working on the improvement of diagnostic methods by means of blood-based biomarker profiles including various analytes that are involved in pathways of breast cancer development and progression. Among others markers of proliferation, apoptosis, angiogenesis, metabolism, endocrine dysfunction, and inflammatory reactions of the tumor microenvironment have been investigated. 19 For example, HGF was proven to be a parameter for progression of breast cancer20,21 and to distinguish significantly between malignant and benign breast diseases. 22 Also, cytokines like TNFα, IL-6, and IL-8 presented elevated values in serum of breast cancer patients in comparison to those with negative biopsies. 23 Cell death markers such as cytokeratin-18 fragments M30 and M65 markers were increased in blood of breast cancer patients, 24 as was sFas. 25 As many of these and other oncological, cell death, angiogenesis, and immunological biomarkers were included in a recently released oncological multiplex immunoassay, we assessed here the diagnostic performance of this biomarker panel. Beside the many advantages in saving costs, time and sample volume, this approach offers an elegant possibility to enhance sensitivity and specificity by a combination of various markers. In a previous study, the methodical and pre-analytical accuracy of most biomarkers included in the panel was demonstrated 13 —an essential basis for further clinical testings.
The present clinical assessment revealed, in line with earlier reports, significantly higher levels of breast cancer–associated markers CA 15-3, CEA but also of other oncological biomarkers CA 125, CA19-9, and AFP as well as of cell death and immunological markers sFas, TNFα, SCF, HGF, OPN, and MIF in sera of breast cancer patients as compared with healthy controls. Best discrimination was obtained for HGF, sFas, and MIF with a further improvement by the combination of HGF and sFas. Even precancerous lesions (DCIS) could be significantly discriminated from healthy controls by AFP, MIF, and sFas. This finding is quite encouraging as these markers may be helpful in the early detection of malignant lesions. However, it is clear that more comprehensive studies are necessary to elucidate the relevance of these markers for population-based screening including an appropriate setting of a high number of asymptomatic individuals at defined ages who are controlled by other diagnostic means that are used to define the positive and negative predictive values of the new markers.
Unfortunately, many immunologic and cell death markers were elevated in benign breast diseases as well and therefore could not discriminate between benign and malignant lesions which is most relevant for differential diagnosis. Only the well-established breast cancer marker CA 15-3 showed significant discriminatory potential achieving an AUC of 0.71 in ROC curves and a sensitivity of 33.8% at 95% specificity. This is quite remarkable as most patients had only small and locally confined breast cancers. In metastatic cancers, even higher values for CA 15-3 and other markers were observed. While these results confirm the well-known high quality of CA 15-3 for differential diagnosis of breast cancer, there were no other significantly discriminating markers after Bonferroni correction for multiple testing in the panel, with CEA and CA 19-9 showing at least a discriminatory trend. By adding CEA to CA 15-3, there was only a slight improvement of the sensitivity at high specificity limiting the relevance of further markers for this indication. Earlier studies had reported an additive sensitivity by use of a combination of multiple tumor markers as compared with single marker measurements:26,27 for example, CA 125 complemented by HE4 in ovarian cancer diagnosis. 28 Also in other cancer entities, a higher diagnostic power of a marker combination was portended.29–31
As recommended by the guidelines of the European Group on Tumor Markers (EGTM), 32 this study included serum samples from all diagnostically relevant groups, that is, patients with breast cancer in various disease stages, with precancerous (DCIS) and benign lesions as well as healthy controls. Serum was collected by using predefined standards of transport, handling, and storage in the Biofluid Biobank Bonn. The multiplex assay was thoroughly tested on its methodical quality, on potentially influencing pre-analytical factors and finally on its relevance for clinical decision making. Quality controls were included in all analytical steps; measurement and statistical evaluation was done independently and by well trained individuals. To avoid any overestimation, results were corrected according to Bonferroni.
As this clinical study was considered as a first pilot study on a new test system, number of patients in each group was limited. From a technical point of view, it has to be pointed out that several biomarkers in the panel had many values in a very low concentration range with high imprecision such as β-HCG, HE4, sFasL, IL-6, IL-8, TGFβ, FGF2, and VEGF and could not be considered for clinical application. In addition, some markers that are clinically meaningful in various fields such as CYFRA 21-1 were associated with high imprecisions and had to be interpreted with caution. 13 Finally, considerable inter-individual heterogeneities of the biomarker values were observed in the cancer and also in the control group; however, we could not identify a clinical condition that explains, for example, the high levels of OPN and CYFRA 21-1 in some healthy individuals.
While the idea of combining various biomarker classes relevant for cancer development and progression in one immunoassay is striking and general potential for discrimination between breast cancer patients and healthy controls was shown for several oncological, cell death, and immunological markers, the important discrimination of patients with malignant and benign breast diseases was only achieved by the already established biomarker CA 15-3.
These findings underline the need of appropriate patient groups for clinical validation studies and the necessity to compare all potentially new biomarkers with established ones that are in clinical use. If the present assay is used for study purposes in breast cancer patients, the number of markers in the panel can be restricted to the methodical sound and most meaningful ones that then can be further evaluated in larger prospective trials.
Conclusion
The examined diversified cancer biomarker panel provided by Millipore is a great tool for research use in order to elaborate biomarker correlations with any clinical diagnosis, as multiple marker classes are included. In comparison to ELISA tests, multiplexing allows a cheap, quick, and less sample volume requiring detection of a respectable biomarker number simultaneously. Already established biomarker CA 15-3 showed the best diagnostic performance in breast cancer detection by significant differentiation between benign and malignant lesions. Several immunological and apoptotic markers are involved in any proliferative breast disease, being auspicious to form a marker profile in addition to conventional tumor markers. However, the pre-analytical stability of these newer biomarkers should be thoroughly approved before any implementation in clinical diagnostics.
Footnotes
Acknowledgements
This work is part of the doctoral thesis of Natalie Hermann. The authors acknowledge the excellent technical assistance of Mrs Makbule Kobilay.
Declaration of conflicting interests
The author(s) declared no potential conflicts of interest with respect to the research, authorship, and/or publication of this article.
Funding
The author(s) received no financial support for the research, authorship, and/or publication of this article.