
Abstract
Sirtuin 6, a member of sirtuin family, is generally regarded as a tumor suppressor as it participates in suppressing hypoxia-inducible factor 1α and MYC transcription activity by deacetylating H3K9 (histone H3 lysine 9) and H3K56 (histone H3 lysine) at promoters of target genes, leading to the aerobic glycolysis inhibition and cell growth suppression. However, its expression has recently been reported to be highly elevated in a series of tumors, including prostate cancer, breast cancer, and non–small cell lung cancer, indicating that sirtuin 6 plays dual roles in tumorigenicity in a cell/tumor type–specific manner. To our knowledge, the biological roles of sirtuin 6 in esophageal cancer cells have still been underestimated. In the study, data from quantitative reverse transcriptase polymerase chain reaction–based assays and immunohistochemical assays revealed that sirtuin 6 was remarkably overexpressed in esophageal squamous tumor tissues. Moreover, its upregulation was closely related with clinical features, such as gender, pathology, tumor–node–metastasis, and cell differentiation. Subsequently, the biological tests showed that it promoted cell proliferation and induced the expression of Bcl2, a key anti-apoptotic factor, in esophageal carcinoma cells. Moreover, using the ratio of LC3II/I, a widely recognized autophagy biomarker, we showed that it apparently induced cell autophagy, which was further confirmed by the autophagy flux assays. In addition, results from western blotting assays and immunoprecipitation assays displayed that sirtuin 6 specifically interacted with ULK1 and positively regulated its activity by inhibiting its upstream factor mammalian target of rapamycin activity. In summary, our studies shed insights into the crucial functions of sirtuin 6 in esophageal carcinoma cells and provide evidence supporting sirtuin 6–based personalized therapies in esophageal carcinoma cell patients.
Introduction
Esophageal carcinoma (EC) has poor prognosis and is regarded as a common malignant tumor, the mortality rate of which in China is much higher than other countries around the world, especially the squamous pathology. 1 The treatments of EC are mainly surgery, radiotherapy, and chemotherapy, and the 5-year survival rate is lower than 20%. 2 Nowadays, the precise treatment is a trend and novel idea for the clinical medication of malignancy. Therefore, exploring the risk factors of EC is very important and meaningful, especially for patients in China.
Sirtuin 6 (SIRT6), a member of the sirtuin family, is the adenosine diphosphate (ADP)-ribosyltransferase and nicotinamide adenine dinucleotide (NAD)-dependent histone deacetylase which can suppress hypoxia-inducible factor (HIF) 1α and MYC transcription activity by modifying histone H3 lysine 9 (H3K9) and histone H3 lysine (H3K56) at the promoter of target genes, resulting in inhibiting aerobic glycolysis, which is a trait of cancer metabolism, and impeding cell growth.3–5 In addition, it has been shown to be downregulated in a large amount of clinical samples, such as pancreatic cancer, colorectal cancer, and head and neck squamous cell carcinoma.4,6 Germline mutations of SIRT6 have been detected in renal cancer, non–small cell lung cancer (NSCLC), melanoma, and cervical cancer. 3 For the above reasons, SIRT6 has been regarded as a tumor suppressor for a long time. Contrarily, it has been reported that the expression of SIRT6 is dramatically increased in prostate cancer, 7 hepatocellular carcinoma, 8 and skin cancer. 9 Inhibition of SIRT6 has also been suggested to stimulate cell apoptosis in prostate cancer cells 7 and increase the chemosensitivity of breast cancer cells to paclitaxel and epirubicin by impairing the homologous recombination repair in response to DNA damaging agents, 10 indicating that SIRT6 acts as an oncogenic effector in specific cancer cells and is a potential target to enhance the therapeutic effects of chemotherapies. We speculate that the dual roles of SIRT6 in tumorigenesis are attributed to the specific tumor types and/or genetic conditions. To date, the expression and biological functions of SIRT6 in EC cells are still unclear and it is of great importance to elucidate its potential therapeutic roles in treating EC patients in China.
Autophagy (here referred to as macroautophagy) is an important metabolic process which wraps unnecessary intracellular components, such as lipids, misfolded proteins, and dysfunctional organelles, in double-membraned vesicles, defined as autophagosomes, which are then transported to lysosomes for degradation and recycling, thus maintaining essential cellular viability in response to diverse stresses.11–15 Autophagy exerts dual functions in cancers because it can either suppress tumorigenesis by degrading oncogenic and toxic proteins 16 or accelerate tumor development by minimizing the vulnerability of cancer cells to stresses and maintaining cancer metabolisms. 17 It is switched by different signaling pathways under certain pressure conditions, including phosphoinositide 3-kinase (PI3K)-AKT signaling pathway, 18 mitogen-activated protein kinase (MAPK)–extracellular signal–regulated protein kinases 1 and 2 (Erk1/2) signaling pathway, 19 AMP-activated protein kinase (AMPK)–mammalian target of rapamycin (mTOR) signaling pathway, 20 and P53/genotoxic stress pathway. 21 Previous studies have shown that mTOR can be inhibited by SIRT6 to promote autophagy in neuronal damage induced by oxidative stress. 22 Other groups have also demonstrated that SIRT6 induced autophagy by attenuating AKT/mTOR signal cascades in normal cells.22,23 Above all, it seems that SIRT6 positively regulates cell autophagy by targeting mTOR signaling pathway. Unfortunately, whether it functions similarly in EC cells remains underestimated.
In the study, using the quantitative polymerase chain reaction assay (qPCR) and immunohistochemical (IHC) assays, we found that SIRT6 was highly upregulated at both messenger RNA (mRNA) and protein levels. The following biological tests, colony formation assays, demonstrated that SIRT6 greatly promoted cell proliferation, further confirmed by the elevated expression of BCL2, a key anti-apoptotic oncogene, in SIRT6-overexpressed EC cells. Furthermore, results from autophagy-related assays, including the western blotting assays of autophagy biomarker, 24 LC3II/I, the autophagy flux assays, and immunoprecipitation (IP) assays, showed that SIRT6, specifically interacting with ULK1, positively participated in autophagy regulation by inhibiting mTOR activities and enhancing its downstream ULK1 activities. Above all, our studies first uncover the oncogenic roles of SIRT6 in EC cells and provide evidence to support the potential capabilities of SIRT6 as a target candidate in treating EC patients as well as other SIRT6-overexpressed tumors.
Materials and methods
Cell culture and rapamycin administration
In the study, 293T cells, the immortalized esophageal cell line HEEC and EC cell lines EC109, TE1, EC1, EC9706, and KYSE150 (K150) were all cultured in Dulbecco’s modified Eagle’s medium (DMEM) with high glucose, supplemented with 12% fetal bovine serum, 100 U/mL penicillin, and 100 U/mL streptomycin, and incubated at 37°C in humidified air with 5% CO2. Rapamycin (Sangon, Shanghai, China), a well-known mTOR inhibitor to stimulate autophagy, is used to treat EC cells with different concentrations for 12 h.
Small interfering RNAs and plasmids transfection
According to the manufacture’s instruction and our previous protocol, 25 the small interfering RNAs (siRNAs) and plasmids transfections were performed using Ribojuice™ siRNA Transfection Reagent (Novagen, Nellmapius Drive, Irene, Pretoria) and Lipofectamine 2000 (Invitrogen, California, USA), respectively. The following siRNA targeting sequences were used in the study—siSIRT6 #1: CTCACTTTGTTACTTGTTT, siSIRT6 #2: CCAAGTGTAAGACGCAGTA. The control siRNAs against non-specific sequence (siCon.) and siSIRT6 #1, #2 were commercially purchased from Sigma (St Louis, MO, USA). The SIRT6 Flag (Flag-SIRT6) was a gift from Eric Verdin (Addgene plasmid #13817).
Quantitative real-time PCR, IHC assay
Quantitative real-time polymerase chain reaction (qRT-PCR) was performed on total RNA isolated from paired esophageal tissue samples (n = 46), which were collected from EC patients who were diagnosed from January 2009 to December 2011 at the Department of Pathology, Anyang Tumor Hospital, Fourth Affiliated Hospital of Henan University of Science and Technology, using Trizol reagent (Invitrogen). Single-strand complementary DNA (cDNA) templates were transcribed from 1 µg RNA using the PrimeScript™ RT reagent Kit (TaKaRa, Dalian, China), which were then amplified using the KAPA SYBR® FAST Universal qPCR Kit (Kapa Biosystems, Massachusetts, USA) on an ABI 7900HT PCR sequencer (Applied Biosystems, Massachusetts, USA), in accordance with the manufacture’s protocol. Taking 18S ribosomal RNA (rRNA) as the internal calibrator, the relative expression of SIRT6 mRNA levels were quantified using the 2−ΔΔCT method. The threshold values set for upregulation and downregulation were ≥1.5-and ≤1.5-fold, respectively. The primers for SIRT6 used in the study are shown as follows: forward primer (5′CGACACCACCTTTGAGAGC3′) and reverse primer (5′CGTACTGCGTCTTACACTTGG3′).
To assess the protein levels of SIRT6 in EC tissues, IHC assays were performed as we previously described. 26 Moreover, the tissue microarrays (TMAs) composed of 100 paired esophageal tissues used in the study were similar with what we previously used.25,26 Unfortunately, due to the long-time storage, some spots of the tissues on the TMAs were damaged (n = 16), which were manually excluded during the analysis. Furthermore, the association of SIRT6 expression with clinical features of these patients, excluding four samples without detailed information, were analyzed (n = 80). Representative pictures were taken under a Leica inverted microscope with LAS V3.7 software at a scale bar of 100 µm.
Autophagy flux and confocal microscope assay
The stable EC109 cells infected with lentivirus mediating Stub-RFP-GFP-LC3 (GFP-RFP-LC3) were established as we previously reported. 27 In the study, the stable EC109 cells transfected with 2 µg Flag or Flag-SIRT6 plasmids were seeded into the 24-well plates with cover slides 48 h later. The next day, cells on the slides were fixed with 4% paraformaldehyde (Sigma, Darmstadt, Germany), perforated with 0.5% Triton X-100 (Sangon, Shanghai, China), blocked with 2% bovine serum albumin (BSA) and stained with 4′,6-diamidino-2-phenylindole (DAPI) in sequence. Finally, the slides were observed under the confocal fluorescence microscope (Zeiss, NLO&DuoScan, Germany) and the representative images were taken at a scale bar of 5 µm.
Western blotting assay and IP assay
After treatments, cells were lysed with radioimmunoprecipitation assay (RIPA) strong buffer (Beyotime, Shanghai) supplemented with protease inhibitors on ice. After quantification, 60 µg protein was loaded on the sodium dodecyl sulfate–polyacrylamide gel electrophoresis (SDS-PAGE) gel for separation and then transferred to nitrocellulose membranes (GE Healthcare, Illinois, USA), followed by the block with 5% BSA and incubation with indicated primary antibodies at 37°C for 1 h. Then the membranes were washed with Phosphate-buffered saline with Tween 20 (PBST) for three times and incubated with appropriate fluorescence-conjugated secondary antibodies (LI-COR Biosciences, Lincoln, NE, USA). Finally, the membranes were visualized on the Odyssey infrared imaging system (LI-COR Biosciences). The gray scale values of western blotting bands were obtained using the WCIF ImageJ software (Toronto, Canada).
In terms of IP assay, 293T cells transfected with Flag or Flag-SIRT6 for 48 h were lysed in NETN buffer (0.5% NP40, 1 M Tris HCl, 5 M NaCl, and 0.5 M ethylenediaminetetraacetic acid (EDTA)), supplemented with protease inhibitors. About 500 µg protein was incubated with 1 µg Flag antibody and 30 µL protein A/G plus-agarose (Santa Cruz, Texas, USA) at 4°C on the mute mixer (Suzhou Bing Lab Equipment CO., LTD, Jiangsu, China) overnight. Subsequently, the precipitated protein was washed with cold NETN buffer, denatured at 100°C, and finally subjected to western blotting analysis with the indicated antibodies. The primary antibodies specific for SIRT6, mTOR, mTOR (S2481/2448), BCL2, ULK1, and ULK1 (S556/758) were purchased from Merck Millipore; Flag, AMPKα, pAMTKα (T172), ATG13, pATG13(S355), and P62 were from Cell Signaling Technology; BECLIN-1, Histone H3 (H3), and Histone H3 (acetyl K9) (H3K9) were from Abcam; and the internal control glyceraldehyde 3-phosphate dehydrogenase (GAPDH) was from Tianjin Sungene Biotech.
High-throughput gene expression assay
For the high-throughput gene expression assay, total RNA extracted from EC109 cells transfected with Flag or Flag-SIRT6 was purified using QIAGEN RNeasy® Mini Kit and then transcribed to double strand cDNA, synthesized with biotin to form αRNA, which were further purified and fragmented. Afterward, the Affymetrix PrimeView™ Human Gene Expression Arrays were hybridized, washed, and stained according to the manufacture’s standard protocols. Finally, the arrays were scanned by the Affymetrix Scanner 3000 (Affymetrix, California, USA) and then the Affymetrix GeneChip Command Console (version 4.0, Affymetrix) was used to analyze the array images to obtain raw data, which were normalized with the RMA algorithm using the Genespring software (version 13.1; Agilent Technologies, California, USA). The threshold set for up- and downregulated genes was a fold change ≥1.5. Differentially expressed genes were then subjected to Gene Ontology (GO) analysis (molecular function) and Kyoto Encyclopedia of Genes and Genomes (KEGG) analysis.
Statistics
Data in the study were represented as mean ± standard deviation (SD) from three independent experiments. The two-tailed paired Student’s t-test was applied to analyze the significance of relative SIRT6 mRNA level between N and T tissues. And the two-tailed Student’s t-test was used to study the significance between two groups. Moreover, the Pearson chi-square test was used to analyze the results from IHC assays. *p < 0.05 and **p < 0.01 were used to determine the statistical significance.
Results
SIRT6 is overexpressed in clinical esophageal squamous cell carcinoma (ESCC) samples
According to previous studies, the expression of SIRT6 was quite different in different malignancies. For instance, the elevated expression of SIRT6 has been found in prostate cancer, 7 skin cancer, 9 and breast cancer, 10 whereas it is also downregulated in pancreatic, colorectal cancer, head and neck squamous cell carcinoma, and hepatocellular carcinoma.4,6,28,29 Up to now, reports on the expression of SIRT6 in EC tissues remain a vacancy. To grope for the roles of SIRT6 in EC cells, we tested the relative expression of SIRT6 mRNA levels in 46 paired esophageal samples at first. Results from qRT-PCR assays showed that SIRT6 was significantly upregulated in T tissues (*p = 0.013, Figure 1(a)). To further confirm the above data, we performed the IHC assays to examine the SIRT6 protein levels using TMA. According to the staining intensity of parenchyma cell nucleus, specimens were manually classified into three grades as negative (−), positive (+), and strong positive (++), as shown in Figure 1(b). The two-tailed Pearson chi-square test revealed that the expression of SIRT6 protein was highly overexpressed with strong intensity in T tissues (**p < 0.001, Figure 1(c)) and the representative pictures are shown in Figure 1(d) (scale bar, 100 µm).
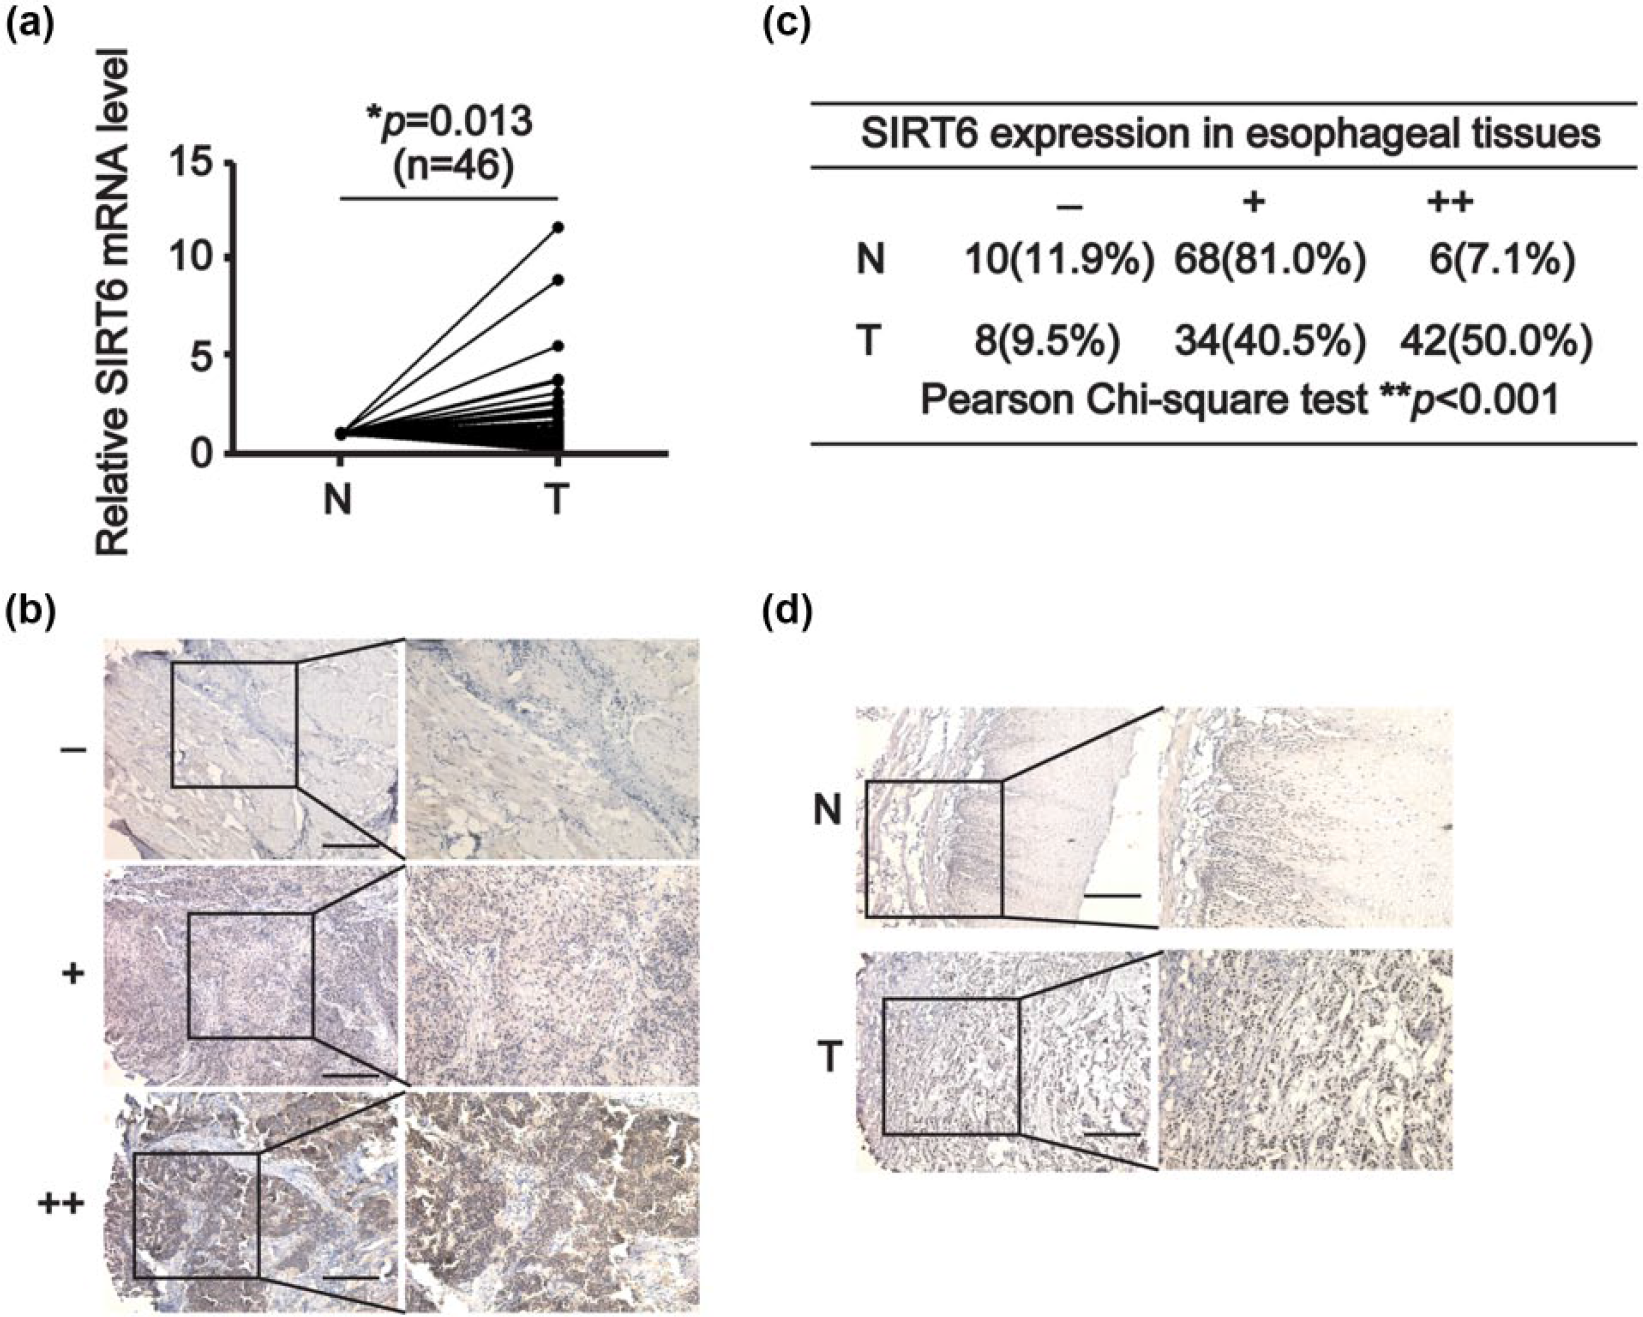
SIRT6 is highly upregulated in ESCC tissues. (a) The relative SIRT6 mRNA levels of paired normal (N) and tumor (T) esophageal tissues (n = 46) were analyzed using the quantitative polymerase chain reaction assays. The two-tailed paired Student’s t-test showed that *p = 0.013. (b) The scoring criteria for judging the expression of SIRT6 in esophageal tissue microarray (TMA) examined by the immunohistochemical assays. Scale bar is 100 µm. (c) The expression of SIRT6 protein in N and T tissues in the TMA was summarized and the Pearson chi-square test was used for statistical analysis (**p < 0.001). (d) Representative images from the IHC data are shown. Scale bar is 100 µm.
In addition, by analyzing the relationship between the level of SIRT6 with clinical properties, the Pearson chi-square test showed that SIRT6 was greatly overexpressed in tumor tissues, compared with that in normal tissues, without any associations with age, tumor size, and lymphatic metastasis. However, its overexpression was closely related with gender, tumor pathology, tumor node metastasis (TNM), and cell differentiation, for that its expression was only elevated in samples with the following characteristics: male, medullary and ulcerative pathology, TNM II and III, moderate and well differentiation. (Table 1), implicating a predictive role of SIRT6 in ESCC patients.
Association analysis between the expression of SIRT6 and the clinical features of ESCC patients.

SIRT6: sirtuin 6; TNM: tumor–node–metastasis.
SIRT6 plays an oncogenic role in the development of esophageal cancers
Accumulating reports showed that SIRT6 plays an important role in promoting cancer cell growth and inhibiting apoptosis in a large amount of tumors,6,7 but few studies have shown the biological functions of SIRT6 in EC cells by now. To clarify the point, we initially monitored the endogenous expression of SIRT6 in five EC cell lines (K150, EC109, EC9706, EC1, and TE1), and one human immortalized esophageal epithelial cell line HEEC using western blotting assays. Here, we found an interesting result that SIRT6 was not increased in EC cells in comparison with HEEC (Figure 2(a)), which might be attributed to the different pathologies and origins of these cells. Subsequently, EC109 and TE1 cells, which had relatively lower expression of SIRT6, were transfected with Flag or Flag-SIRT6 and subjected to colony formation assays. The results indicated that SIRT6 obviously promoted cell growth (**p = 0.005 for both EC109 and TE1, Figure 2(b)). In addition, the rest pellets from colony formation assays were subjected to western blotting assays to confirm the transfection efficiency and test the expression of BCL2, a product of oncogene which inhibits cell apoptosis by preventing the release of cytochrome C from mitochondrion. 30 As shown in Figure 2(c), BCL2 levels were significantly increased in Flag-SIRT6 transfected cells, molecularly supporting the oncogenic roles of SIRT6 in EC cells. Subsequently, data from Cell Counting Kit-8 (CCK-8) assays also revealed a significant growth increase in SIRT6 transfected EC109 cells, in comparison with Flag transfected cells (Figure 2(d), **p = 0.005 for day 3 and *p = 0.012 for day 4), confirming the role of SIRT6 in promoting proliferation of EC cells. Afterward, the flow cytometry analysis of cell cycle demonstrated that SIRT6 biologically participated in regulating G2M phase (Figure 2(e), *p = 0.033). Unexpectedly, data from flow cytometry assays demonstrated no statistical difference in SIRT6 overexpressed or knockdown EC cells (Figure S1), suggesting that SIRT6 was likely to regulate cell growth without interfering apoptosis in EC cells. Anyway, our above in vitro results sufficiently supported the oncogenic roles of SIRT6 in EC cells.

SIRT6 promotes cell proliferation and arrests cell cycle at G2M phase in esophageal cancer cells in vitro. (a) Western blotting assays were performed to detect endogenous expression of SIRT6 protein in five esophageal tumor cell lines (K150, TE1, EC9706, EC109, and EC1) and one immortalized epithelial esophageal cell line (HEEC). (b) Colony formation assays were employed to test the roles of SIRT6 in cell growth. The colonies (size = 80-infinity) were automatically counted using the WCIF ImageJ software, which were graphically shown in right panels. The two-tailed Student’s t-tests were used to analyze the significance. **p = 0.005 for both EC109 and TE1 cells. (c) The whole protein extracted from EC109 and TE1 cells transfected with Flag-SIRT6 or Flag for 48 h was subjected to western blotting assays for testing the indicated protein levels. (d) Cell survival analysis of EC109 cells transfected with SIRT6 using CCK-8 tests. (e) EC109 cells transfected with Flag or Flag-SIRT6 were subjected to cell cycle analysis using flow cytometry assays. Data from three independent experiments were represented as mean ± SD and graphically depicted (*p = 0.033).
SIRT6 is positively involved in regulating autophagy flux in EC cells
SIRT1, the most studied member of sirtuin family, has been confirmed to positively regulate autophagy via suppression of mTOR signal pathway and deacetylation of ATGs in embryonic stem cells, colorectal and cervical cancer cells.14,31 Besides, SIRT6 has also been suggested to induce autophagy by attenuating AKT/mTOR signal cascades in normal cells.22,23 Taking together, we supposed that SIRT6 was able to govern autophagy in EC cells. In order to prove our assumption, we first detected the ratio of LC3 II/LC3 I, which has been widely used as a biomarker to assess the level of autophagy, 24 and SIRT6 in rapamycin, an autophagy agonist, 32 treated EC109 cells. As shown in Figure 3(a) and (b), the relative protein change fold of LC3II/LC3I and SIRT6, taking untreated cells as a control, were both apparently increased in a concentration-associated manner, suggesting that SIRT6 might positively participate in autophagy.

SIRT6 induces autophagy flux in EC cells. (a and b) Immunostaining of total protein from EC109 cells, treated with different concentrations of rapamycin. (a) The gray values of these bands were obtained using WCIF Image J software. The relative protein levels were calculated taking GAPDH as a control, and the relative protein change fold was further evaluated taking untreated cells as a control, which was graphically depicted in (b). (c) Western blotting assays of LC3I/II levels in 293T, TE1 and EC109 cells, which were transfected with Flag or Flag-SIRT6 for 48 h. (d) Western blotting assays of protein from EC1 cells transfected with siCon. or siSIRT6 (#1, #2) with indicated antibodies. (e) The autophagy flux assays of stable EC109 cells infected with GFP-RFP-LC3 lentiviruses and transfected with Flag or Flag-SIRT6.
Next, SIRT6 was ectopically transfected into 293T, EC109, and TE1 cells to test the ratio of LC3 II/LC3 I using western blotting assays to further validate its roles in autophagy. In line with above hypothesis, SIRT6 significantly induced the expression of autophagy marker (Figure 3(c)). More importantly, transient inhibition of SIRT6 using siRNAs showed a remarkable reduction of LC3 II/LC3 I ratio in EC1 cells (Figure 3(d)). Regarding that quantities of autophagosomes rely on both generation rate and degradation rate, 33 the autophagy flux assays were used to exclude the possibility that the increase in LC3 II/LC3 I results from the inhibition of autophagosome–lysosome fusion. As shown in Figure 3(e), both GFP-LC3 puncta and RFP-LC3 puncta were significantly increased in the cytoplasm of SIRT6 transfected cells. Based on the results from above autophagy-related assays, we concluded that SIRT6 played a positive role in autophagy flux regulation in EC cells.
SIRT6 promotes autophagy flux by regulating mTOR-ULK1 signaling activities
Molecularly, we further explored the possible mechanisms of SIRT6 in modulating autophagy flux process. By testing a panel of autophagy-related proteins in SIRT6 transfected 293T and EC109 cells, including P62, BECLIN-1, ATG13, ATG13 (S355), AMPKα, AMPKα (T172), mTOR, mTOR (S2448/2481), ULK1, and ULK1 (S556/758), we found that the expression of above proteins, except for the inhibition of mTOR (S2448/2481) and the enhancement of ULK1 (S556/758), was not significantly changed by SIRT6 (Figure 4(a) and (b)), suggesting that it modulated autophagy flux by targeting mTOR-ULK1 signaling activities. Besides, to further consolidate the role of SIRT6, the histone H3 acetylation, indicated by H3K9, was examined in EC cells. As shown in Figure S2, the expression of H3K9 was significantly reduced in SIRT6 tranfected EC109 and TE1 cells, compared to that in the Flag transfected cells, suggesting that SIRT6 regulated the acetylation status in EC cells just as previously reported. 34 Subsequently, we attempted to clarify whether SIRT6 could interact with autophagy-associated proteins using IP assays. Interestingly, SIRT6 specifically bound with ULK1, with no interaction with ATG13 and AMPK (Figure 4(c)). In summary, we thought that SIRT6 activated ULK1 to induce autophagy by inhibiting its upstream factor mTOR activities.

SIRT6 promotes autophagy by regulating mTOR-ULK1 activities. Cell extracts from (a) 293T and (b) EC109 cells transfected with Flag or Flag-SIRT6 were applied for western blotting assays with indicated antibodies. (c) Cell extracts from 293T cells transfected with Flag or Flag-SIRT6 were applied for immunoprecipitation assays with Flag antibody, followed by western blotting assays with indicated antibodies.
For the sake of exploring the gene expression pattern modulated by SIRT6 in autophagy flux process, the high-throughput analysis using Affymetrix Human PrimeView Microarray was performed. Based on the criteria described in the “Materials and methods” section, we ultimately screened out 197 upregulated genes and 100 downregulated genes (data not shown). Afterward, these differentially expressed genes were subjected to GO enrichment analysis of molecular function and KEGG signaling pathways, and the top six entries were exhibited. As shown in Figure 5(a), those upregulated genes were mainly involved in glucuronosyl transferase activity, retinoic acid binding, enzyme inhibitor activity, enzyme binding, protein homodimerization activity, protein heterodimerization activity in molecular function category, and participated in ascorbate and aldarate metabolism, steroid hormone biosynthesis, pentose and glucuronate interconversions, metabolism of xenobiotics by cytochrome P450, starch and sucrose metabolism, porphyrin and chlorophyll metabolism in KEGG category, implicating that SIRT6 might function in these metabolic signaling pathways by positively regulating appropriate factors involving in above certain molecular functional categories to control the activities of mTOR-ULK1 signaling. In addition, those downregulated genes were mainly involved in phosphatase-regulator activity, calcium-dependent cysteine-type endopeptidase activity, protein binding, glycine transmembrane transporter activity, IgE binding and lipopolysaccharide receptor activity in molecular function category, and functioned in pertussis, peroxisome, proteoglycans in cancer, nuclear factor (NF)-κB signaling pathway, PI3K-AKT signaling pathway, and HF-1 signaling pathway in KEGG category (Figure 5(b)), suggesting that SIRT6 negatively regulated these molecular factors playing certain functions to inhibit above signaling pathways to induce autophagy and promote cell growth.

Prediction of SIRT6 participated functions and signaling pathways using high-throughput analysis. The molecular functions and KEGG signaling pathways of SIRT6 (a) induced- or (b) reduced genes analyzed using the GO enrichment database. The top six categories are shown.
Discussion
In this study, we reported for the first time that the expression of SIRT6 in ESCC tissues was significantly elevated not only at the mRNA levels but also at the protein levels. The clinical feature analysis of SIRT6 overexpression in EC tissues demonstrated that SIRT6 could be potentially used as a predictor for distinguishing the gender, clinical pathology, TNM, and cell differentiation for EC patients. Subsequently, upregulated SIRT6 in EC cells was shown to promote cell proliferation. In addition, results from autophagy-related assays and high-throughput analysis revealed that it induced autophagy flux and regulated the mTOR-ULK1 signaling activities in EC cells.
The role of SIRT6 in cancers has always been a controversial topic. Some studies have demonstrated that SIRT6 acts as a tumor suppressor in certain human cancers, due to the fact that deletion of SIRT6 promotes the glucose uptake and decomposition in a manner of glycolysis, a common cancer metabolism which is also called Warburg effect or aerobic glycolysis. 4 Similarly, Sebastián et al. 4 have demonstrated that SIRT6 deficiency stimulates aerobic glycolysis, accelerates tumor transformation and growth in colorectal cancer. SIRT6 has also been suggested to induce massive apoptosis in cancer cells, such as Hela cells and breast cancer cells. 35 On the contrary, SIRT6 overexpression has been demonstrated to be closely correlated with poor prognosis and chemoresistance in NSCLC patients. 36 In the study, we found that SIRT6, highly elevated in ESCC tissues, played a positive role in promoting EC cell proliferation and arresting cell cycle at G2M phase without interfering cell apoptosis. Taking together, we speculate that SIRT6 exerts its oncogenic or tumor suppressing roles depending on tumor types, therefore, researches of SIRT6 in specific tumors are of great value.
Dysfunction of autophagy, a highly conserved catabolic process, in a variety of tumors has caught increasing attention.37,38 SIRT1, a member of sirtuin family, has been identified to regulate PI3K/Beclin 1 and mTOR signaling pathways to induce autophagy by deacetylating transcription factors FOXO, NF-κB and a series of autophagy-associated genes in various cancers, thus leading to cancer progression and development.14,31,39 Recent studies have shown that SIRT6 plays a role in inducing autophagy by attenuating AKT/mTOR signal cascades in neuroblastoma cells and bronchial epithelial cells.22,23 Nevertheless, it is obscure whether it is engaged in regulating autophagy in EC cells. The following data from our autophagy-related assays support that SIRT6 indeed promotes autophagy flux in EC cells: (a) the expression of SIRT6 is increased in rapamycin-treated EC109 cells, similar to autophagy biomarker LC3 II/LC3 I; (b) overexpression of SIRT6 promotes the ratio between LC3 II and LC3 I, which is greatly reduced in SIRT6 deficiency EC cells; (c) the GFP-LC3 puncta, RFP-LC3 puncta, and the colocalization of GFP-RFP-LC3 puncta (shown as yellow puncta) in cytoplasm are significantly increased in SIRT6 transfected stable EC109 (GFP-RFP-LC3) cells in comparison with those in Flag transfected cells. Notably, the increase of SIRT6 in rapamycin-treated EC cells in a concentration-dependent manner further implicated a possible regulation of SIRT6 expression by autophagy. Consequently, we speculated a positive feedback between SIRT6 and autophagy, which would finally result in reinforcing the induction of autophagy in EC cells.
On the molecular level, we screened a majority of autophagy-related proteins in SIRT6 transfected 293T and EC109 cells using western blotting assays. Interestingly, we found that only the activities of mTOR and ULK1 significantly changed, other proteins, including the basic level of mTOR and ULK1, did not show a statistical change. Accumulating reports have shown that mTOR activities have a negative effect on the activities of ULK1, a kind of serine/threonine protein kinase in the mammalian cells, which has an important effect on the initial stage of autophagy. 20 Moreover, in neuroblastoma cells, SIRT6 has been shown to positively regulate autophagy by attenuating the Akt/mTOR signaling pathway. 40 Consistently, our data have shown that SIRT6 inhibits mTOR activities (shown by S2481 and S2448) and promotes ULK1 activities (indicated by S758 and S556). Taking all these discoveries into account, we speculated that SIRT6 was able to induce autophagy via the mTOR-ULK1 signaling pathway in EC cells. However, further rescue studies are needed to confirm our assumption.
ATG13 and FIP200 are essential to correctly locate ULK1 to the pre-autophagosome and maintain its stability. 41 In addition, ULK1 is activated by AMPK, which plays a critical role in regulating metabolism and energy homeostasis, to induce autophagy under glucose starvation condition. 20 As a result, we further carried out the IP assays to test the interaction of SIRT6 with ULK1, ATG13, and AMPK. Surprisingly, SIRT6 specifically interacted with ULK1 without any relationship with ATG13 and AMPK. Taking the fact that SIRT6 is a metabolic regulator into consideration, 4 we supposed that SIRT6 was involved in autophagy regulation by targeting mTOR-ULK1 activities via certain metabolism signals which are sensed by other metabolic factors except for AMPK signaling.
In order to systematically explore the probable mechanisms of SIRT6 in regulating cell growth and autophagy in EC cells, we investigated the molecular functions and signaling pathways of genes dysregulated by SIRT6 in EC109 cells using the Affymetrix PrimeView™ Human Gene Expression Array. We observed that those upregulated genes in SIRT6 transfected EC cells predominantly participated in the enzyme activity and glycometabolism regulation. SIRT6, a nuclear protein, is known as the class III histone deacetylase which can inhibit H3K9 acetylation at the promoters of key glycolytic genes, 5 leading to the inhibition of glycolysis. Previous studies have reported that mitogen-activated protein kinase 14 (MAPK14) inhibits glycolysis by stimulating the degradation of 6-phosphofructo-2-kinase/fructose-2,6-biphosphatase 3 (PFKFB3) to reduce reactive oxygen species (ROS) levels via glycolytic flux-dependent generation of nicotinamide adenine dinucleotide phosphate (NADPH), leading to mildly activation of autophagy. 42 Therefore, based on the high-throughput results, we infer that SIRT6 positively regulates certain factors, such as the hexokinase 1 (HK1) involving in regulating the glucokinase activity, the solute carrier family 2 member 1 (SLC2A1) participating in regulating the glucose transmembrane transporter activity, the podocalyxin like 2 (PODXL2) involving in controlling the glycosaminoglycan binding, to enhance some enzyme-mediated reduction of glycolysis or gluconeogenesis, resulting in the induction of autophagy in EC cells.
However, those downregulated genes in SIRT6 overexpressed EC cells mainly regulated the phosphatase-regulator activity, NF-κB signaling pathway, and PI3K-Akt signaling pathway. SIRT6 negatively regulates transcriptional activity of NF-κB through deacetylation of H3K9 at the promoter of NF-κB downstream factors, thus attenuating the NF-κB signaling pathway. 43 Recent studies have found that the prohibition of NF-κB stimulates the activation of JNK signaling pathway, thus promoting autophagy in porcine granulosa cells. 44 Consequently, results from Affymetrix analysis made us speculate that SIRT6 may functionally deacetylate certain downregulated genes, like toll like receptor 4 (TLR4), to repress NF-κB signaling pathways, leading to the induction of autophagy in EC cells. It is reported that the class III family of phosphatidylinositol-3-kinase (PI3KC3), an upstream molecule of AKT/mTOR pathway, promotes the activity of serine kinase AKT, which subsequently phosphorylates mTOR at Ser2448. 40 mTOR negatively regulates ULK1 kinase activity by directly phosphorylating ULK1 at Ser757, thus inhibiting autophagy initiation. 20 Previous study has shown that SIRT6 suppressed phosphorylation of AKT, attenuated PI3K-Akt signal pathway, and then obstructed mTOR activation, therefore facilitating autophagy process in neuroblastoma cells. 22 In the study, the expression of SIRT6 was significantly increased depending on the concentration of rapamycin. Therefore, we supposed that there was a feedback between mTOR and SIRT6 that rapamycin induced the expression of SIRT6 to suppress the activities of Akt, leading to the inhibition of mTOR activities and increase of autophagy. Moreover, we assumed that it downregulated certain genes, such as TLR4, tenascin C (TNC), kinase insert domain receptor (KDR), identified by the Affymetrix array to block the PI3K-AKT signaling cascades, leading to the inhibition of mTOR activity and the enhancement of it targeted ULK1 activity, which finally promotes autophagy in EC cells.
However, the detailed mechanisms for SIRT6 in regulating cell growth and autophagy predicted by the array are required to be explored in our future studies. Anyway, we have provided powerful evidence to support the roles of SIRT6 in promoting cell growth and autophagy in EC cells, which will potentially serve as a targeted candidate for the personalized diagnosis and therapy of EC patients.
Footnotes
Acknowledgements
N.H. and Z.L. equally contribute to this work.
Declaration of conflicting interests
The author(s) declared no potential conflicts of interest with respect to the research, authorship, and/or publication of this article.
Funding
The author(s) disclosed receipt of the following financial support for the research, authorship, and/or publication of this article: This study was funded by Shanghai Young Science and Technology Talents Sailing Program (15YF1409300), Natural Science Foundation of China (Grant NO. 81502425, 81572330, 81371913, 81472624, 81472124, 81502557) and Science and Technology Project of Panyu (2015-Z03-10).
References
Supplementary Material
Please find the following supplemental material available below.
For Open Access articles published under a Creative Commons License, all supplemental material carries the same license as the article it is associated with.
For non-Open Access articles published, all supplemental material carries a non-exclusive license, and permission requests for re-use of supplemental material or any part of supplemental material shall be sent directly to the copyright owner as specified in the copyright notice associated with the article.