
Abstract
Pancreatic cancer (PaC) is highly associated with diabetes mellitus (DM). However, the mechanisms are insufficient. The study aimed to uncover the underlying regulatory mechanism on diabetic PaC and find novel biomarkers for the disease prognosis. Two RNA-sequencing (RNA-seq) datasets, GSE74629 and GSE15932, as well as relevant data in TCGA were utilized. After pretreatment, differentially expressed genes (DEGs) or miRNAs (DEMs) or lncRNAs (DELs) between diabetic PaC and non-diabetic PaC patients were identified, and further examined for their correlations with clinical information. Prognostic RNAs were selected using KM curve. Optimal gene set for classification of different samples were recognized by support vector machine. Protein-protein interaction (PPI) network was constructed for DEGs based on protein databases. Interactions among three kinds of RNAs were revealed in the ‘lncRNA-miRNA-mRNA’ competing endogenous RNA (ceRNA) network. A group of 32 feature genes were identified that could classify diabetic PaC from non-diabetic PaC, such as CCDC33, CTLA4 and MAP4K1. This classifier had a high accuracy on the prediction. Seven lncRNAs were tied up with prognosis of diabetic PaC, especially UCA1. In addition, crucial DEMs were selected, such as hsa-miR-214 (predicted targets: MAP4K1 and CCDC33) and hsa-miR-429 (predicted targets: CTLA4). Notably, interactions of ‘HOTAIR-hsa-miR-214-CCDC33’ and ‘CECR7-hsa-miR-429-CTLA4’ were highlighted in the ceRNA network. Several biomarkers were identified for diagnosis of diabetic PaC, such as HOTAIR, CECR7, UCA1, hsa-miR-214, hsa-miR-429, CCDC33 and CTLA4. ‘HOTAIR-hsa-miR-214-CCDC33’ and ‘CECR7-hsa-miR-429-CTLA4’ regulations might be two important mechanisms for the disease progression.
Introduction
Pancreatic cancer (PaC) is one of lethal diseases with high mortality. 1 Due to late onset of symptoms, the 5-year overall survival rate of PaC is very poor (less than 5%). 2 Diabetes mellitus (DM) is another cause of healthy challenge worldwide because there is insufficient data to monitor and inspect the disease progression. 3 Notably, prevalence of DM, especially new-onset DM, is found very high among PaC patients. 4 As recorded in a study, more PaC cases meet the criteria for DM diagnosis (40.2% vs 19.2%), compared with control. 5 Previously, a meta-analysis indicated DM was tightly related to increased risk of PaC. 6 These suggest DM is highly associated with PaC and the identification of specific biomarkers for diabetic PaC could be useful for the detection and prevention of PaC.
Currently, several relevant biomarkers have been identified. Glucagon/insulin ratio is supposed as a candidate biomarker for PaC in new-onset DM patients. 7 Serum thrombospondin-1 level is found decreased in PaC patients and the level is associated with DM. 8 In addition, VNN1 accounts for paraneoplastic islet dysfunction in PaC with new-onset DM, and thus is identified as a potential biomarker. 9 MicroRNAs (miRNAs/miRs) are a class of small RNAs important for the control of cellular process and activity via down-regulating gene expressions. Circulating miR-25 is recognized as a candidate biomarker for PaC. 10 MiR-200 and miR-196 are significantly increased in PaC patients compared with control; however, their expressions are not different between diabetic PaC and non-diabetic PaC patients. 11 These collectively suggest that alteration of miRNAs might not tie up with diabetic PaC, or there might be other complicated regulatory mechanisms. Long non-coding RNAs (lncRNAs) belong to RNA species larger than 200 nt length and are defined as non-protein-coding RNA transcripts. They are novel regulators for gene expression, protein function and chromatin modification.12,13 Reportedly, the lncRNA might serve as a competing endogenous RNA (ceRNA) in the control of miRNA level and function, suggesting it has a negative correlation with miRNA’s expression. 14 Overexpressed lncRNA MALAT1 is implicated with poor prognosis of PaC, 15 and increased HOTTIP is found to promote PaC progression via enhancing cell proliferation and survival. 16 However, rare studies have been reported regarding to the lncRNA alterations between diabetic PaC and non-diabetic PaC patients, nor miRNA changes modulated by lncRNA. Thus, there is a need to reveal underlying mechanisms on molecular process in diabetic PaC patients.
Therefore, we utilized two RNA-sequencing (RNA-seq) datasets deposited in Gene Expression Omnibus (GEO) database and the relevant data in The Cancer Genome Atlas (TCGA) database, to select relevant gene, miRNA and lncRNA markers for diabetic PaC detection and try to explore their regulatory relationships. Via these efforts, we expected to lay a foundation of regulatory mechanism on diabetic PaC and find novel biomarkers for the prognosis.
Data and methods
Data resources and pretreatment
The relevant data about PaC were downloaded from TCGA (https://gdc-portal.nci.nih.gov/) database. Selection criteria of the samples were: (1) they were PaC tissues; (2) the diabetes information of the patients was provided; (3) samples with paired mRNA and miRNA interactions were obtained. In total, 135 samples were acquired, including 99 diabetic PaC patients and 36 non-diabetic PaC patients.
The microarray dataset GSE74629 was downloaded from the GEO (http://www.ncbi.nlm.nih.gov/geo) database on the Illumina platform (Illumina, San Diego, California, USA), which contained 36 PaC patients: 14 were complicated with diabetes and 22 were not. 17 The annotation files were also downloaded. Probe values were converted into gene expressions. If multiple probes were corresponded to the same gene symbol, their probe values were averaged to calculate the gene expression. Gene expressions were subjected to logarithmic normalization to reach an approximately normal distribution, and then were further normalized using the Linear Models for Microarray Analysis (http://www.bioconductor.org/packages/release/bioc/html/limma.html) limma package. 18
Another dataset GSE15932 was also downloaded from the GEO database, based on the Affy platform (Affymetrix Inc., Santa Clara, California, USA). There were16 PaC patients: 8 were diabetic and 8 were non-diabetic. 2 After raw data in CEL format were downloaded, they were underwent background correction and normalization using Microarray Suite (MAS) and quantiles methods implemented in the oligo (http://www.bioconductor.org/packages/release/bioc/html/oligo.html) package.
RNA-seq data and differential analysis
Based on the HUGO Gene Nomenclature Committee (HGNC, http://www.genenames.org/) database, which includes 2,775 lncRNAs and 19,004 protein coding genes annotation information, 19 relevant lncRNAs and mRNAs seq data in the above TCGA database were identified. Differential analyses of the mRNA and miRNAs among these RNA-seq data were performed using edgeR package (version 3.0.1). 20 Two criteria, false discovery rate (FDR) < 0.05 and |fold change (FC)| > 1.5, were set as thresholds for the selection of differentially expressed genes (DEGs) or miRNAs (DEMs) between diabetic PaC patients and non-diabetic PaC patients.
Relationship between DEGs, DEMs or DELs and clinical features
Clinical information of all the samples was extracted from above databases or datasets, and the samples were classified into different groups based on following dichotomous variables: age (≥ 60 vs < 60), gender (female vs male), alcohol history (Yes vs No), clinical M (M0 vs MX), N (N3+N2 vs N0+N1), T (T3 + T4 vs T1 + T2), clinical stage (III+IV vs I+II), neoplasm histologic grade (G1+G2 vs G3+G4) and new tumor (Yes vs No). RNA (mRNA, miRNA and lncRNA) expressions that associated with the above clinical information were selected using edgeR package. Likewise, the cut-off values were FDR < 0.05 and |FC| > 1.5.
Selection of prognostic mRNAs, miRNAs and lncRNAs
Following selection of DEGs, DEMs and differentially expressed lncRNAs (DELs) between diabetic PaC patients and non-diabetic PaC patients, the survival information in each sample was extracted to perform cox analysis by the survival package. 21 Kaplan-Meier (KM) curve was used to visually display the survival result.
Consistency analysis of the DEGs
Protein-protein interaction network of the DEGs
By integrating protein information in three databases, BioGRID (http://thebiogrid.org/), HPRD (http://www.hprd.org/) and DIP (http://dip.doe-mbi.ucla.edu/), potential interactions of these DEGs at protein level were selected to build a protein-protein interaction (PPI) network, which was visualized by the Cytoscape (http://cytoscape.org/) software.
Optimizing feature genes based on network betweenness centrality
After PPI network construction of the DEGs, topological structure of the network was analyzed based on the node’s degree and betweenness centrality (BC) algorithm, using the following formula:
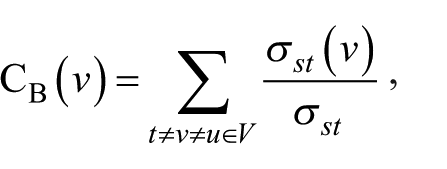
where
Selection of the optimal feature gene sets
In order to optimize and identify the representative and remarkable genes that could be used for clinical prognosis and model construction, the top 100 genes were further performed with the optimal combination selection, using recursive feature elimination (RFE) algorithm. 22 Efficacy of the classification for different samples was evaluated to obtain the optimal feature gene sets, by iterative and random combination of the feature genes.
Construction of support vector machine classifier utilizing the feature gene sets
Once the optimal feature gene sets were identified, was the support vector machine (SVM) classifier model built based on these gene expressions in each sample. 23 Probability of each sample belonging to a certain classification was determined by expression of these feature genes in each sample, to predict and distinguish different kinds of PaC patients.
Independent validation and assessment of SVM classifier performance
To verify the stability and reproducibility of the SVM classifier, two datasets of GSE15932 and GSE74629 were used as the validation sets. Five indicators: sensitivity, specificity, positive predictive value (PPV), negative predictive value (NPV) and area under the curve (AUC) of the receiver operating characteristic (ROC) curve were used to assess the classifier performance.
Prediction of lncRNAs targeted by miRNAs
Relevant miRNAs and lncRNAs information was integrated according to miRcode (http://www.mircode.org/) and starBase databases,24,25 to predict the interplayed lncRNA-miRNA interactions, combining with the selected DEMs information.
Prediction of targets genes of miRNAs
The miRTarBase (http://mirtarbase.mbc.nctu.edu.tw) is a database that provides the latest and extensive validated miRNA-target interaction information. 26 This database (release 6.0) was used to search potential target genes of the identified miRNAs in the present study. Then a miRNA-target gene network was established by integrating DEGs in the PPI network. The Cytoscape software was utilized to draw this network.
Construction of ceRNA regulatory network and function and pathway enrichment analysis
Combining lncRNA-miRNA interactions with miRNA-target gene interactions, a ceRNA network, lncRNA-miRNA-mRNA regulatory network was established.
Enrichment analysis of the candidate feature genes in this network was performed by the fisher’s extract test, based on Gene Ontology (GO, http://www.geneontology.org/) and Kyoto Encyclopedia of Genes and Genomes (KEGG, http://www.genome.jp/kegg/pathway.html) databases, to identify these genes’ functions and pathways relating to diabetic PaC. Detailed fisher’s extract test algorithm was as the following formula:
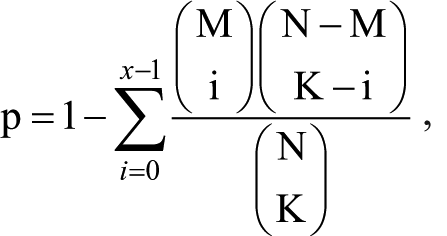
where N represents total gene counts in the whole genome, M stands for gene counts in the pathway, K denotes counts of the differentially expressed genes, and p represents the possibility that at least “x” of “k” genes enriched in a specific function or pathway term.
Results
Selection of disease-specific lncRNAs, miRNAs and mRNAs
Based on aforementioned identification of different RNA types, we identified a total of 841 lncRNAs, 18,713 protein coding mRNAs and 1,046 human miRNAs among the RNA-seq data. Firstly, low abundant mRNAs, lncRNAs and miRNAs were filtered out. The thresholds for low abundance of the three kinds of RNAs were 1, 5 and 5, respectively. Under the selection criteria, 232 lncRNAs, 186 miRNAs and 12,633 mRNAs were remained. Expression density distribution was presented in Figure 1. From this figure, it is indicated that after the filtration of low expressed genes, the peaks of expression density of the three kinds of RNAs were apparently increased. Notably, lncRNA expressions were obviously lower than mRNA and miRNA.
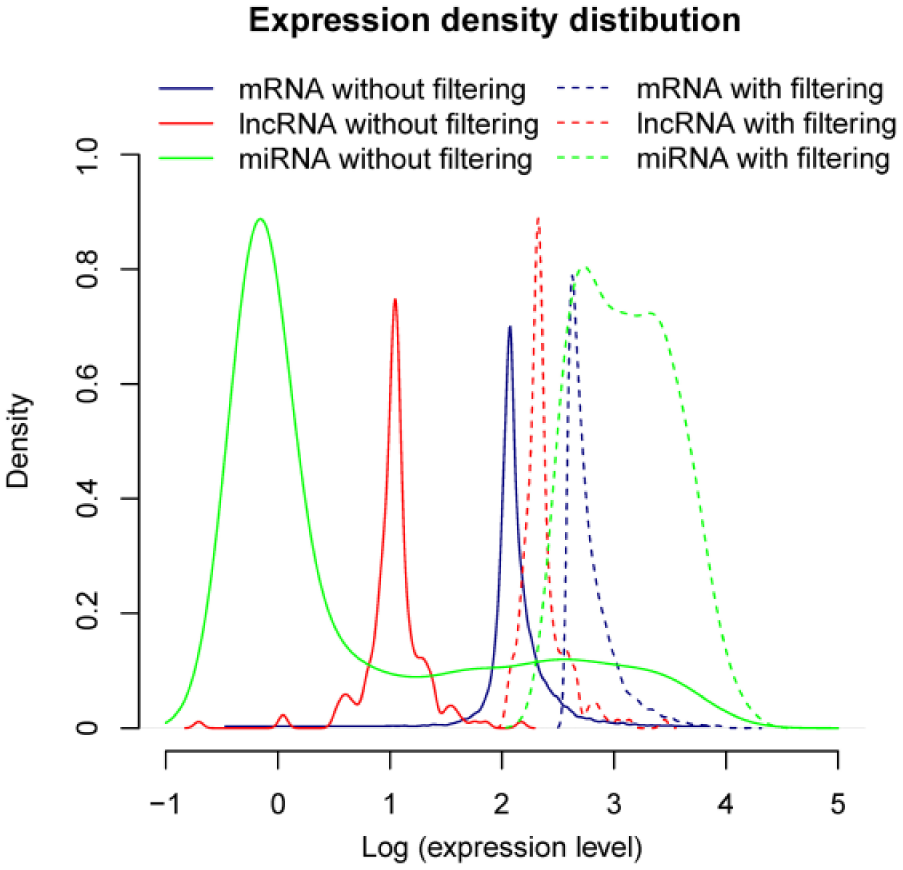
Expression density distribution of mRNAs, miRNAs and lncRNAs.
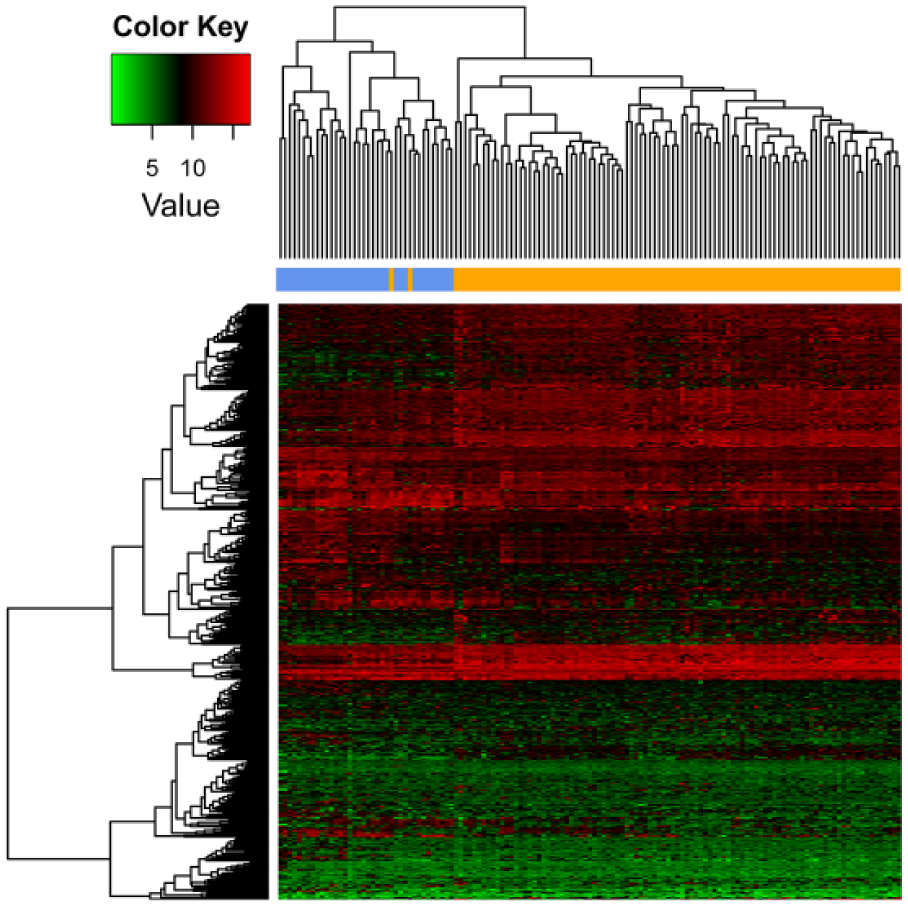
Via differential analysis, there identified a total of 600 significant DEGs and 33 significant DELs among the mRNA-seq data; and 28 DEMs among the miRNA-seq data. Heat map of clustering analysis of these RNAs are presented in Figures 2–4, which show us the three kinds of RNAs could well distinguish the diabetic PaC patients from the non-diabetes PaC.

Expressions of differentially expressed lncRNAs in different samples. X-axis represents samples, blue denotes non-diabetic pancreatic cancer patients, and yellow denotes diabetic pancreatic cancer patients. Y-axis represents lncRNAs, red stands for up-regulations and green stands for down-regulations.

Expressions of differentially expressed miRNAs in different samples. X-axis represents samples, blue denotes non-diabetic pancreatic cancer patients, and yellow denotes diabetic pancreatic cancer patients. Y-axis represents miRNAs, red stands for up-regulations and green stands for down-regulations.
Expressions of differentially expressed mRNAs in different samples. X-axis represents samples, blue denotes non-diabetic pancreatic cancer patients, and yellow denotes diabetic pancreatic cancer patients. Y-axis represents mRNAs, red stands for up-regulations and green stands for down-regulations.
Association between DEGs and clinical features
Based on aforementioned method, the samples were divided into different groups by nine dichotomous variables that indicated clinical features. Then, dysregulated miRNAs, mRNAs or lncRNAs in each comparison were identified (Supplementary Table 1-3).
Important RNAs relevant to prognosis
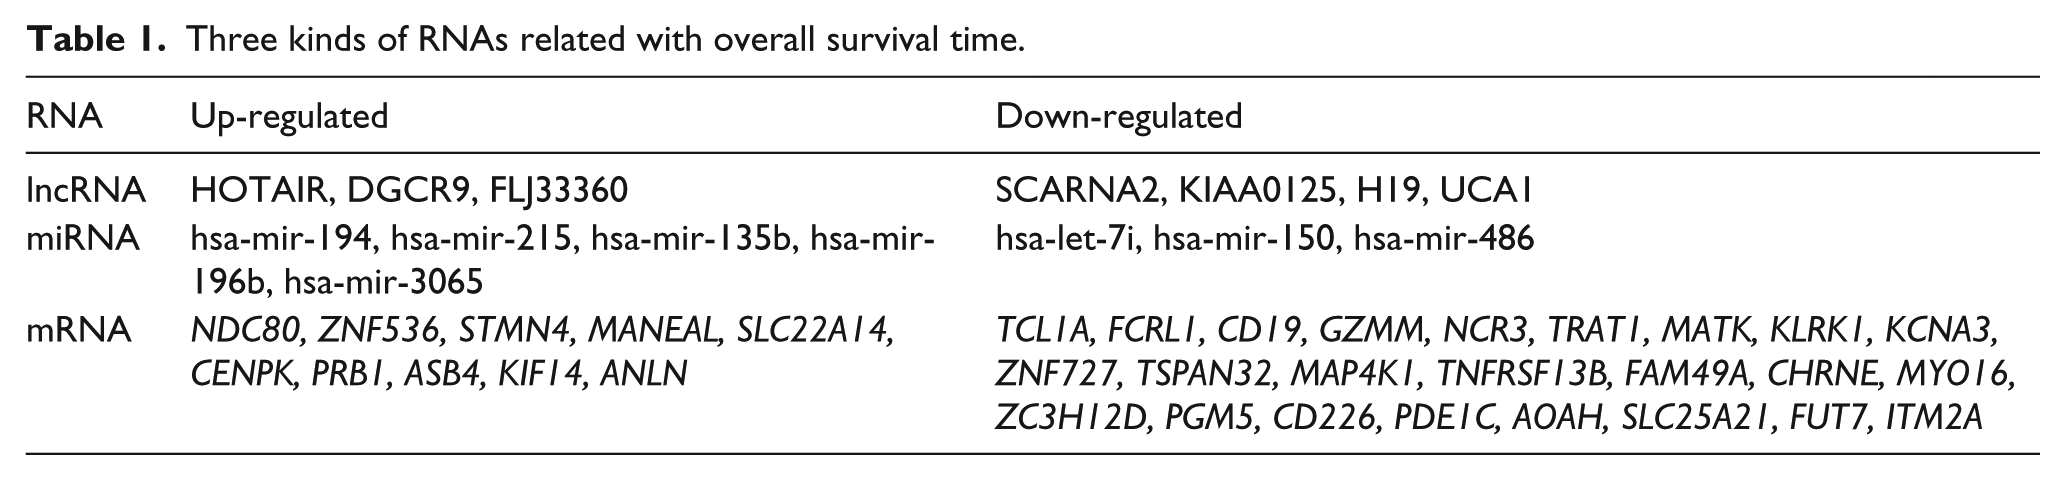
By calculating the three kinds of RNAs’ expression value and performing prognosis analyses (e.g. overall survival time) based on cox analysis, mRNAs, miRNAs and lncRNAs correlating with prognosis were identified (Table 1). Notably, seven lncRNAs were identified tied up with prognosis, such as HOTAIR, DGCR9, FLJ33360, SCARNA2, KIAA0125, H19 and UCA1. Medium expression value of these lncRNAs was used as the boundary for samples with up-regulated genes and those with down-regulated genes, and KM survival analysis was performed. As shown in Figure 5, we found most of the lncRNAs, especially UCA1, could well distinguish two kinds of the samples that relating to high or low survival ratio. This suggested the seven lncRNAs could be used as prognostic predictors in diabetic PaC patients.
Three kinds of RNAs related with overall survival time.

Kaplan-Meier survival curve of differentially expressed lncRNAs in diabetic pancreatic cancer patients.
Consistency analysis of the DEGs
PPI network of the DEGs
According to aforementioned selection criteria and information in three protein databases, a PPI network was constructed. In this network, in addition to the DEGs, other expanded genes were also contained, which were defined as genes having more than ten nodes interacted with the DEGs. In summary, the PPI network consisted of 215 nodes (including 201 DEGs and 14 expanded genes) and 306 edges, namely the interaction numbers among these genes (Figure 6). Five predominant nodes in the PPI network were APP (degree = 37), ELAVL1 (degree = 23), HSP90AA1 (degree = 22), FYN (degree = 21) and EGFR (degree = 17).
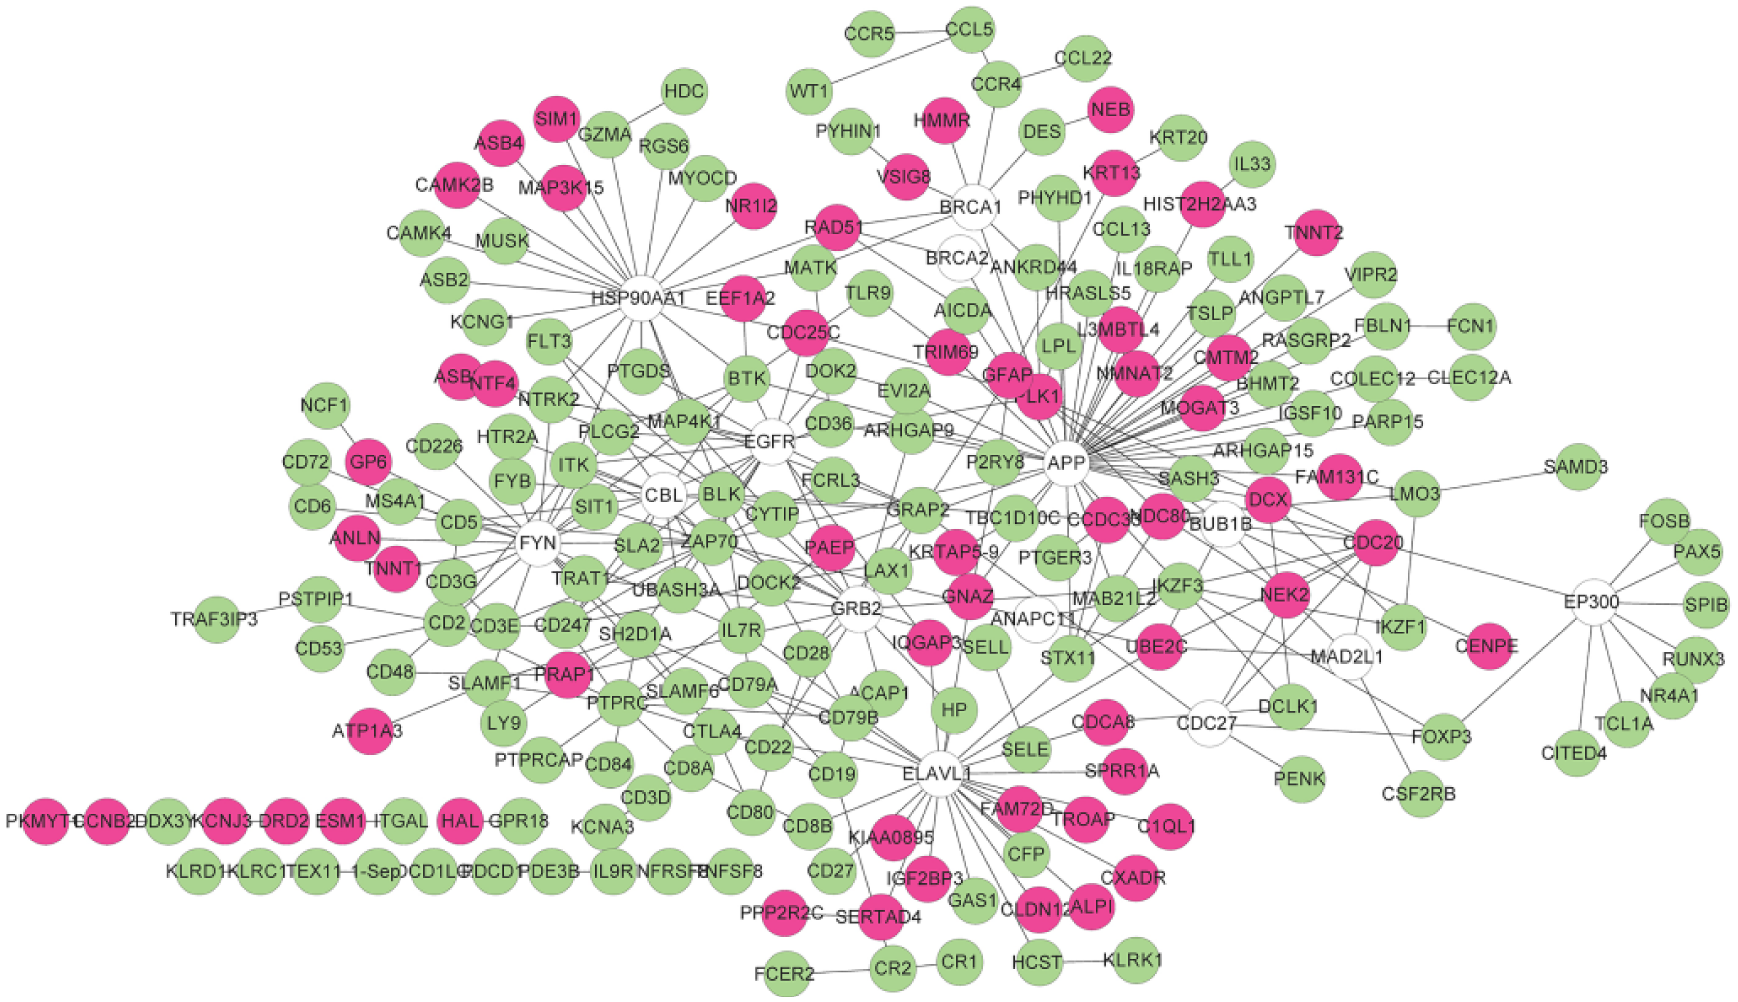
Protein-protein interaction network of the differentially genes. Red stands for up-regulated genes, green represents down-regulated genes and no color represents expanded genes.
SVM classifiers and the verification
As mentioned in the method section, we selected the top 100 gene nodes ranked by their BC values, including 86 DEGs and 14 expanded genes. Then, combining with the RFE algorithm, 32 feature genes that could classify the samples were identified, such as CCDC33, CTLA4, GFAP, MAP4K1 and P2RY8 (Table 2); and this gene set had the most accurate prediction, 94.1%, compared with others (Figure 7).
Gene list of 32 genes in the optimal gene set that was identified by support vector machine classifier.

BC: betweenness centrality; FC: fold change; FDR: false discovery rate.

Identification of the optimal gene set using recursive feature elimination algorithm. a: Node degree distribution in the protein-protein interaction network; b: Accuracy for sample classification by different feature gene combinations.
GSE15932 and GSE74629 were used as two validation datasets, and their normalized data were utilized to test the accuracy of the SVM classifier with 32 feature genes. As a result, this SVM classifier could exactly classify 14 samples of GSE15932 into two groups (7 diabetic and 7 non-diabetic PaC samples), and the accuracy was as high as 87.5%; for GSE74629 dataset, the SVM classifier could distinguish 36 samples (14 diabetic and 22 non-diabetic PaC samples) with an accuracy of 86.1%. Scatter plot of samples in the two datasets based on this SVM classifier was presented in Figure 8(b) and (c)). Evaluation of performance of this SVM classifier indicated it had a high accuracy with high sensitivity and specificity (0.75-0.9, Table 3). Notably, this SVM classifier had a high AUC value in both of the training dataset and the validation dataset (> 0.9, Table 3, Figure 9).
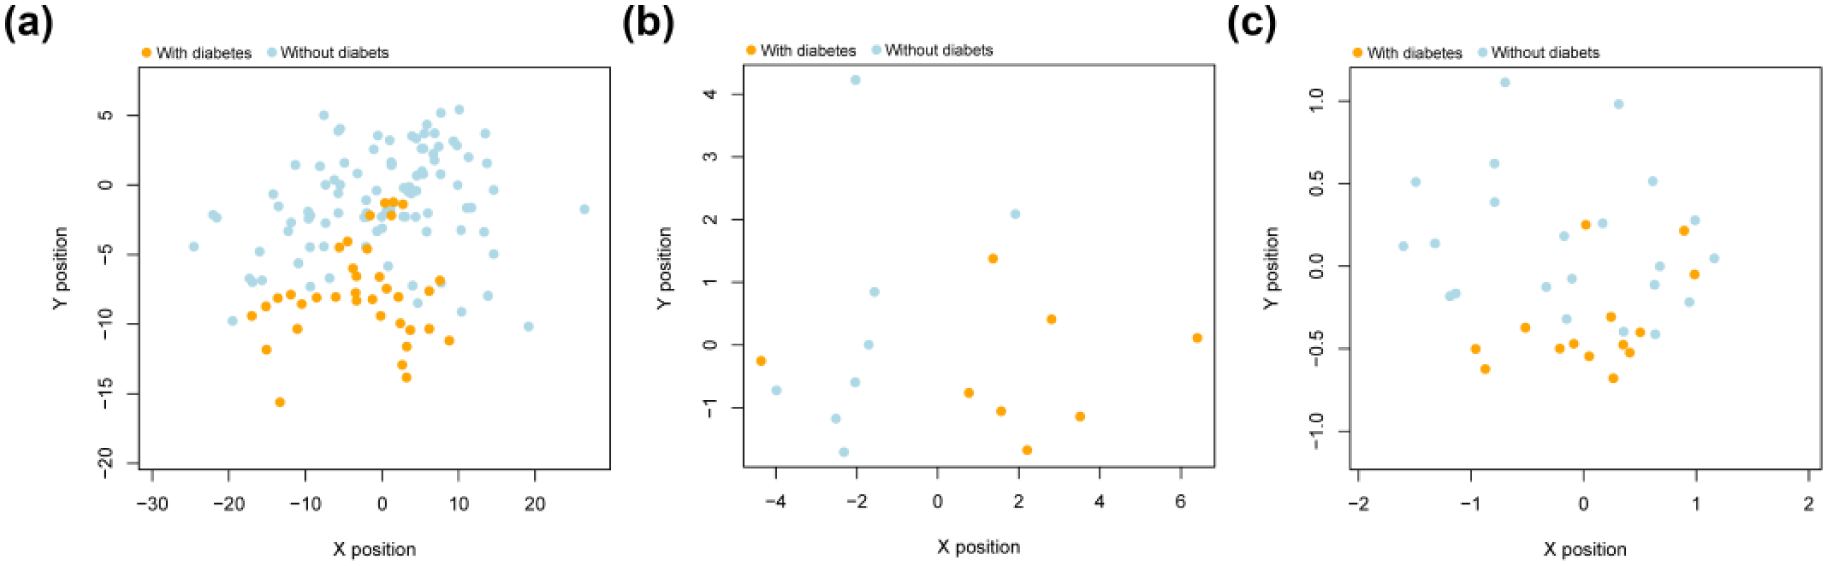
Scatter plot of samples in validation datasets using the identified support vector machine classifier. a: TCGA training dataset; b: GSE15932 validation dataset; c: GSE74629 validation dataset.
Performance evaluation of the SVM classifier in training dataset and validation dataset.

TCGA: The Cancer Genome Atlas; PPV: positive predictive value; NPV: negative predictive value; AUC: area under the curve of the receiver operating characteristic curve.

AUC of the receiver operating characteristic curve in different datasets. a: TCGA training dataset; b: GSE15932 validation dataset; c: GSE74629 validation dataset. AUC: area under the curve; TCGA: The Cancer Genome Atlas.
Prediction of interplayed lncRNA-miRNA regulations
By integrating information in miRcode and starBase databases, a total of 492 lncRNA-miRNA interactions were selected. Then combined with DEMs and DELs, 53 lncRNA-miRNA interactions were further extracted, including 17 DELs and 13 DEMs, such as HOTAIR (interplayed miRNAs: miR-214, miR-150, miR-146a and miR-194, Figure 10) and UCA1 (interplayed miRNAs: miR-135b and miR-214, Figure 10).
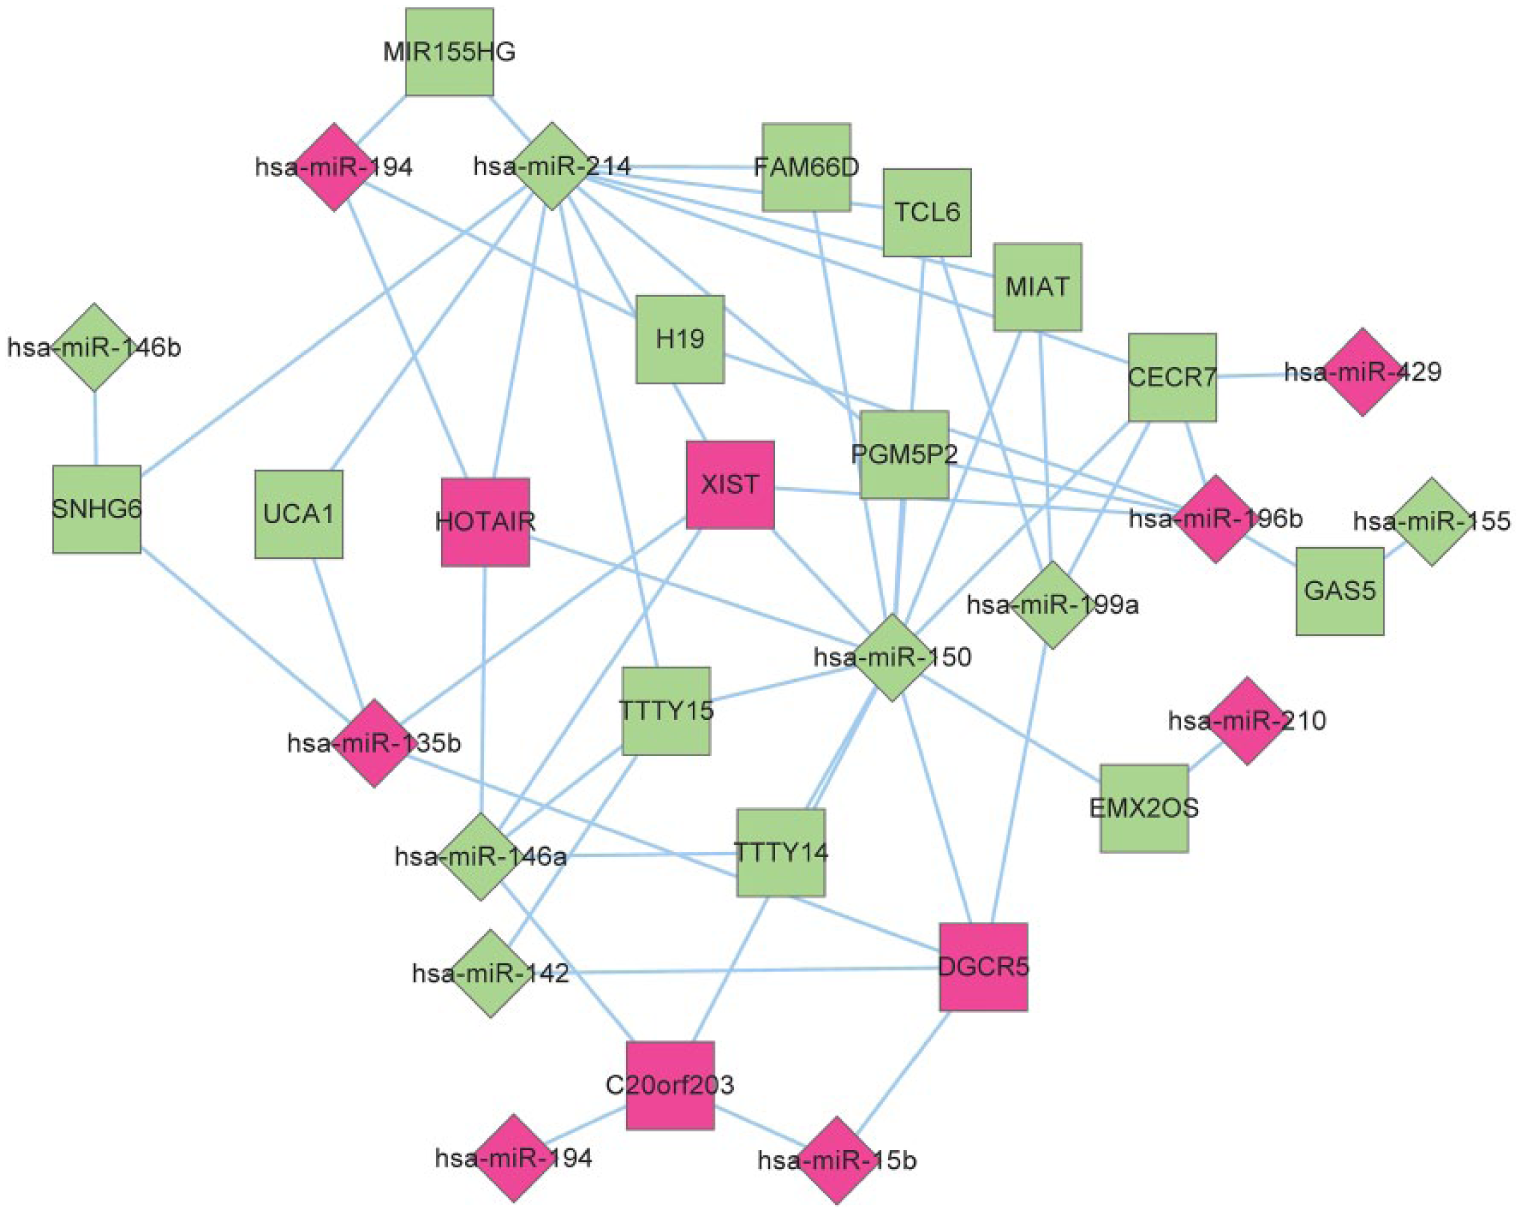
DEL-DEM regulatory network. Diamond denotes miRNA and square stands for lncRNA. Red represents up-regulation and green represents down-regulation. DEL: Differentially expressed lncRNA; DEM: Differentially expressed miRNA.
Prediction of miRNA-regulated targets
The 13 DEMs identified in the above step were mapped into the miRTarBase database to explore their targets. Then, these potential target genes were compared with the DEGs. Finally, targets of 10 DEMs were identified, such as hsa-miR-135b, hsa-miR-146a, hsa-miR-150, hsa-miR-155, hsa-miR-15b, hsa-miR-194, hsa-miR-196b, hsa-miR-210, hsa-miR-214 (targets: MAP4K1, P2RY8 and CCDC33) and hsa-miR-429 (predicted targets: GFAP, CTLA4). The DEM-DEG regulatory network was exhibited in Figure 11.

DEM-DEG regulatory network. Diamond denotes miRNAs, round represents target genes and larger round shape represents the gene belongs to the optimal gene set. Red stands for up-regulation and green stands for down-regulation.
Construction of ceRNA network
Integrated ceRNA network and enrichment analysis of the target genes
Combining the lncRNA-miRNA interactions with the miRNA-mRNA interactions, an integrated lncRNA-miRNA-mRNA network was established, consisting of 394 molecules and 824 interactions. Among them, these interactions were highlighted such as ‘HOTAIR-hsa-miR-214-CCDC33’ and ‘CECR7-hsa-miR-429-CTLA4’ (Figure 12).
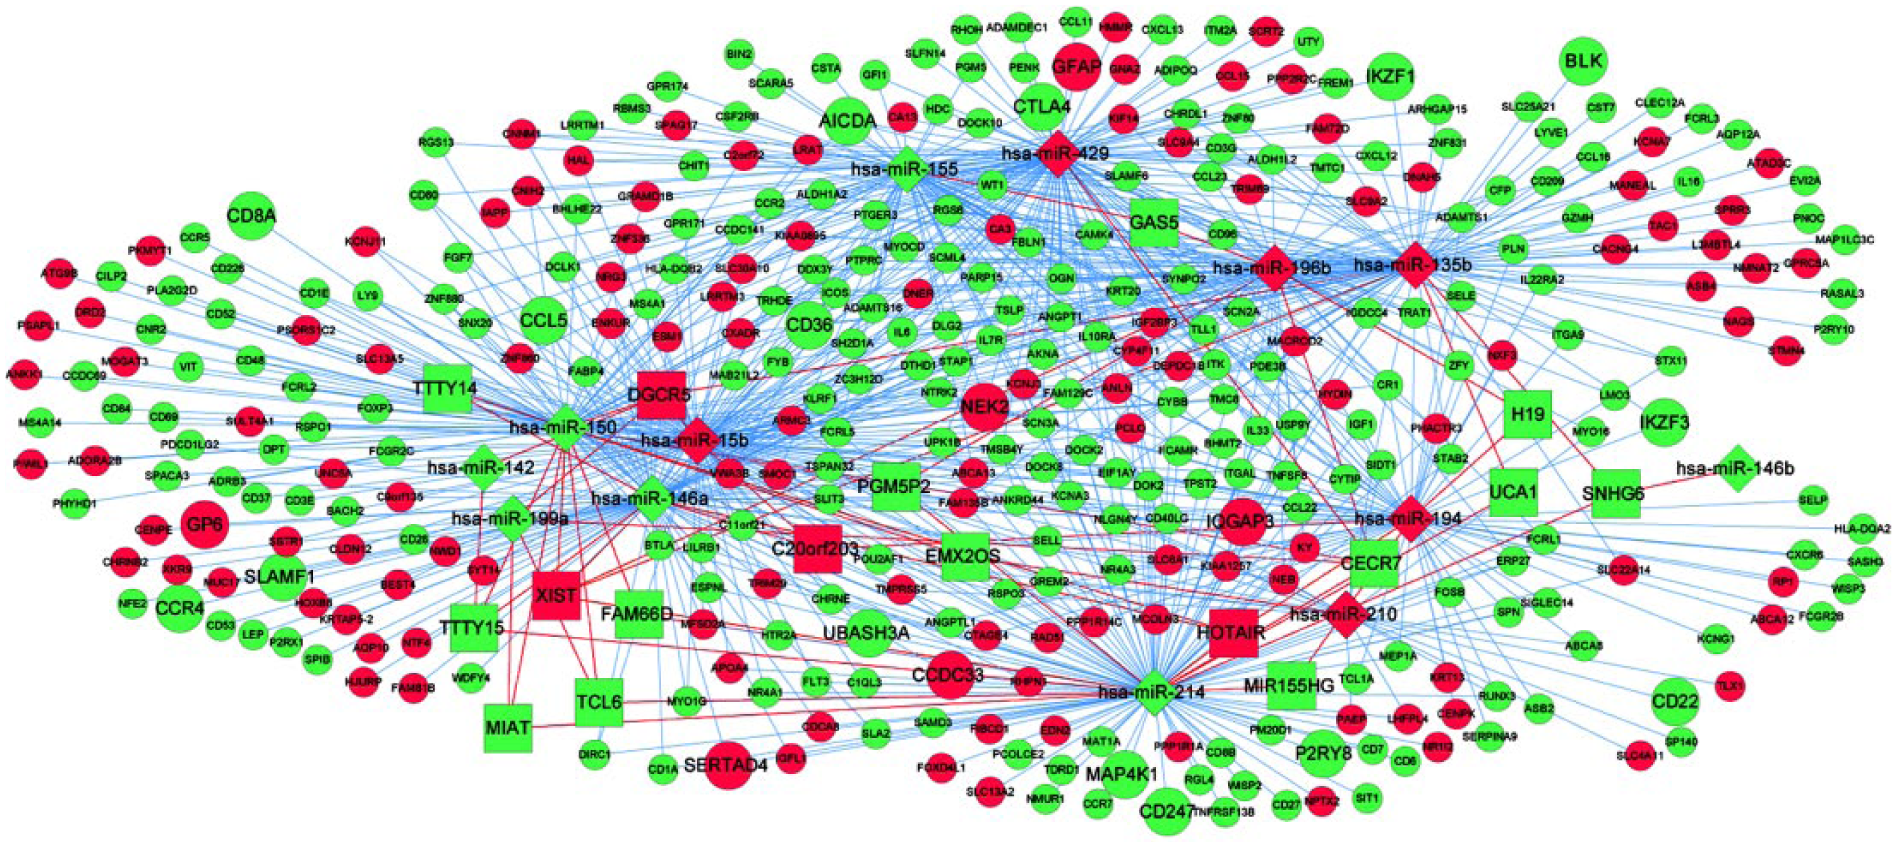
CeRNA regulatory network. Diamond denotes miRNAs, square represents lncRNAs, round represents target genes and larger round shape represents the gene belongs to the optimal gene set. All shape in red stands for up-regulation and in green stands for down-regulation. Red lines denote lncRNA-miRNA interactions, and blue lines denote miRNA-target gene interactions.
Based on enrichment analysis for the network, we found the target genes were highly associated with 11 KEGG pathways, like ‘cell adhesion molecules (CAMs’), ‘cytokine-cytokine receptor interaction’ and ‘hematopoietic cell lineage’; and 26 function categories, such as ‘positive regulation of immune system process’, ‘cellular homeostasis’, ‘leukocyte activation’, ‘defense response’ and ‘immune response’ (Figure 13).

Enriched pathway and functions of target genes in the ceRNA network. a: Enriched functions of the target genes; b: Enriched pathways of the target genes.
ceRNA network of transcription factors
Relevant human transcription factors (TFs) were extracted from two databases: Transcription Regulatory Regions Database (TRRD, http://wwwmgs.bionet.nsc.ru/mgs/gnw/trrd/) and JASPAR (http://jaspar.genereg.net/). Then, combining them with the established ceRNA network, the sub ceRNA network specific to TFs was extracted, in which two TFs, RUNX3 and NFE2 were highlighted. Notably, they also belonged to the optimal feature gene set that could well classify different samples. In addition, RUNX3 was regulated by hsa-miR-214 and hsa-miR-194; while NFE2 was targeted by hsa-miR-146a (Figure 14).

CeRNA network of transcription factors (TFs). Diamond denotes miRNAs, square represents lncRNAs and triangle represents TFs. All shape in red stands for up-regulation and in green stands for down-regulation. Red lines denote lncRNA-miRNA interactions, and blue lines denote miRNA-TF interactions.
Discussion
In the present study, based on RNA-seq data in two datasets and the TCGA database, we identified 32 feature genes that could classify diabetic PaC patients from non-diabetic PaC, such as CCDC33, CTLA4 and MAP4K1. Importantly, this SVM classifier had a quite high accuracy on the prediction. Seven lncRNAs relating to the prognosis of diabetic PaC were also identified, especially UCA1. In addition, crucial DEMs were selected, such as hsa-miR-214 (predicted targets: MAP4K1 and CCDC33) and hsa-miR-429 (predicted targets: CTLA4). Notably, interactions of ‘HOTAIR-hsa-miR-214-CCDC33’ and ‘CECR7-hsa-miR-429-CTLA4’ were highlighted in the ceRNA network.
HOX Transcript Antisense RNA (HOTAIR) is a 2158 bp lncRNA co-expressed with HOXC genes. In PaC, HOTAIR is reported to uniquely repress interferon- or tumor cell cycle-related genes, thus overexpression of this lncRNA promotes PaC progression and is considered as a negative prognostic factor. 27 Aberrant miR-214 is discovered in PaC, and up-regulation of miR-214 reduces the BxCP-3cell sensitive to gemcitabine, a drug which has a pro-apoptotic effect, 28 suggesting overexpressed miR-214 might protect against apoptosis. In addition, miR-214 inhibits cell growth and migration in other cancers by targeting oncogenic genes like CD44 and CDK1. 29 Unfortunately, there is rare information about the relationship between miR-214 and diabetes or diabetic PaC. In the present study, however, miR-214 was downloaded and targeted by the lncRNA HOTAIR, on this basis, it could be speculated that HOTAIR might have a pro-oncologic effect via suppressing miR-214’s expression in diabetic PaC patients. The protein encoded by coiled-coil domain containing 33 (CCDC33) is a cancer/testis antigen. 30 Dysregulation of this gene is detected in prostate cancer compared with benign prostatic hyperplasia. 31 However, no correlation between this gene and PaC or diabetes have been reported yet, nor the regulation interactions with miRNAs. Based on our study, CCDC33 was predicted as a target of miR-214 and up-regulated in diabetic PaC patients, suggesting this gene might serve as an oncogene during the disease progression. Combining the lncRNA targeting information, we suppose that overexpressed HOTAIR represses miR-214 expression, which results in up-regulation of CCDC33. This might be one of the mechanisms accounting for diabetic PaC progression.
Mitogen-Activated Protein Kinase Kinase Kinase Kinase 1 (MAP4K1), also known as HPK1, regulates proliferation in hematopoietic cells. In pancreatic ductal adenocarcinomas (PDA), deficiency of HPK1 protein is significantly associated with PDA invasion. 32 In our study, MAP4K1 was predicted as another target of miR-214, implying miR-214-targeted MAP4K1 expression has an important role in diabetic PaC development.
Cat Eye Syndrome Chromosome Region, Candidate 7 (CECR7) is a potential lncRNA correlating with Cat Eye Syndrome. Based on limited literature information, increased CECR7 is significantly associated with low overall survival in hepatocellular carcinoma. 33 However, in our study, down-regulation of CECR7 was detected in diabetic PaC, suggesting this lncRNA might have different expression patterns in different cancer types, and its expression should be validated via substantial experiments. miR-429 is differentially expressed in PaC, compared with control. 34 Cytotoxic T-Lymphocyte Associated Protein 4 (CTLA4) is a gene belonging to immunoglobulin superfamily. Its encoded protein is responsible for transporting an inhibitory signal to T cells. CTLA4 is supposed to participate in PaC-induced immune suppression,35,36 implying this gene is tied up with immune response stimulated by PaC. Nonetheless, none of the above molecules is mentioned relating with diabetic PaC. In our study, miR-429 was targeted by lncRNA CECR7, while CTLA4 was targeted by miR-429 in the ceRNA network. These predictions suggested this ‘CECR7-miR-429-CTLA4’ integrated regulation might be an important mechanism for development of diabetic PaC. In addition, a previous bioinformatics analysis predicted miR-429 was a central molecule in both of the TF-miRNA-mRNA and lncRNA-miRNA-mRNA ceRNA networks in PaC. 37 Our findings indicated that runt related transcription factor 3 (RUNX3) was regulated by hsa-miR-214 in the TF-miRNA-mRNA network. RUNX3 is a TF containing runt domain. Abnormal expression of RUNX3 is detected in metastatic PDA, and this TF has been linked to pathogenesis of metastatic PDA. 38 Based on our findings, hsa-miR-214 targeted RUNX3 might be another crucial mechanism for diabetic PaC etiology.
UCA1 is a lncRNA overexpressed in many cancer types, such as colorectal cancer, gastric cancer and bladder cancer, via influencing cell proliferation, apoptosis and cell cycle distribution; and regulating Wnt signaling pathway.39,40 In this study, UCA1 was identified as the most predominant lncRNA correlating with prognosis of diabetic PaC, suggesting in addition to other cancers, UCA1 might also be an important predictor for diabetic PaC.
The above molecules and their predicted interactions might unveil the mechanisms of diabetic PaC and provide novel biomarkers for identification and prognosis of diabetic PaC. More importantly, the SVM classifier using these feature genes was highly accurate. Despite these obvious advantages, there is a limitation that all these genes and RNAs’ expressions as well as their predicted interactions are needed to be validated by substantial experiments. In the follow-up studies, we will conduct substantial experiments in vitro and in vivo to confirm the above predictions.
In conclusion, ‘HOTAIR-hsa-miR-214-CCDC33’ and ‘CECR7-hsa-miR-429-CTLA4’ regulations might be two critical mechanisms for the development of diabetic PaC. In addition to these molecules, the lncRNA UCA1 might be a novel biomarker for the prognosis of diabetic PaC.
Footnotes
Acknowledgements
KYY and QW participated in the design of this study, and they both performed the statistical analysis. JHJ and HPZ carried out the study and collected important background information. HPZ drafted the manuscript. All authors read and approved the final manuscript. K.Y. and Q.W. contributed equally to this work.
Availability of data and material
The raw data were collected and analyzed by the Authors, and are not ready to share their data because the data have not been published.
Declaration of conflicting interests
The author(s) declared no potential conflicts of interest with respect to the research, authorship, and/or publication of this article.
Funding
The author(s) received no financial support for the research, authorship, and/or publication of this article.
References
Supplementary Material
Please find the following supplemental material available below.
For Open Access articles published under a Creative Commons License, all supplemental material carries the same license as the article it is associated with.
For non-Open Access articles published, all supplemental material carries a non-exclusive license, and permission requests for re-use of supplemental material or any part of supplemental material shall be sent directly to the copyright owner as specified in the copyright notice associated with the article.