
Abstract
In cancer biology, the architectural concept “form follows function” is reflected by cell morphology, migration, and epithelial–mesenchymal transition protein pattern. In vivo, features of epithelial–mesenchymal transition have been associated with tumor budding, which correlates significantly with patient outcome. Hereby, the majority of tumor buds are not truly detached but still connected to a major tumor mass. For detailed insights into the different tumor bud types and the process of tumor budding, we quantified tumor cells according to histomorphological and immunohistological epithelial–mesenchymal transition characteristics. Three-dimensional reconstruction from adenocarcinomas (pancreatic, colorectal, lung, and ductal breast cancers) was performed as published. Tumor cell morphology and epithelial–mesenchymal transition characteristics (represented by zinc finger E-box-binding homeobox 1 and E-Cadherin) were analyzed qualitatively and quantitatively in a three-dimensional context. Tumor buds were classified into main tumor mass, connected tumor bud, and isolated tumor bud. Cell morphology and epithelial–mesenchymal transition marker expression were assessed for each tumor cell. Epithelial–mesenchymal transition characteristics between isolated tumor bud and connected tumor bud demonstrated no significant differences or trends. Tumor cell count correlated significantly with epithelial–mesenchymal transition and histomorphological characteristics. Regression curve analysis revealed initially a loss of membranous E-Cadherin, followed by expression of cytoplasmic E-Cadherin and subsequent expression of nuclear zinc finger E-box-binding homeobox 1. Morphologic changes followed later in this sequence. Our data demonstrate that connected and isolated tumor buds are equal concerning immunohistochemical epithelial–mesenchymal transition characteristics and histomorphology. Our data also give an insight in the process of tumor budding. While there is a notion that the epithelial–mesenchymal transition zinc finger E-box-binding homeobox 1–E-Cadherin cascade is initiated by zinc finger E-box-binding homeobox 1, our results are contrary and outline other possible pathways influencing the regulation of E-Cadherin.
Introduction
The architectural concept “form follows function” requires an object’s shape to be based upon its function. In cancer cell biology, this concept is reflected by cell morphology (polarized, amoeboid/rounded, or mesenchymal/spindle shaped), migration (individual, loosely connected, or collective), and protein expression pattern. In the process of epithelial–mesenchymal transition (EMT), epithelial cells lose polarity and intercellular cohesion to adopt a mesenchymal, fibroblast-like, single-cell migratory phenotype.1,2 EMT is regulated by various epithelial (e.g. E-Cadherin and β-Catenin)3,4 and mesenchymal (e.g. Vimentin and N-Cadherin)5,6 effectors as well as their transcriptional regulators (ZEB1 and 2, SNAIL, SLUG, TWIST, and SOX2).7–10 In vivo features of EMT have been associated with tumor budding, which correlates significantly with tumor aggressiveness and consequently with patient overall survival.11–15 According to conventional two-dimensional histology, tumor buds appear as isolated small-cell clusters of up to five cells at the invasive front. 16 Nevertheless, we previously described that the majority of tumor buds are not truly detached/isolated tumor cell groups, but rather protrusions still connected to a major tumor mass. These observations are compatible with collective migration associated with partial EMT at the invasive front. 17
Interestingly, spatial aspects of EMT, especially in tumor buds have rarely been quantified and described before. This study aimed to validate the tumor bud concept by a detailed quantitative analysis of immunohistological (ZEB1 and E-Cadherin expression) and morphological (polarized, amoeboid/rounded, or mesenchymal/spindle shaped) features of EMT at the invasive front. Using this approach, we compared connected tumor bud (CTB) and isolated tumor bud (ITB) according to morphology and EMT activity and investigated the effects of tumor subdivision and EMT activity in three-dimensional (3D) space.
Material and methods
Data annotation and extraction
Three tissue specimens from a total of 12 patients with pancreatic ductal adenocarcinoma (PDAC, three cases), invasive ductal breast cancer (IDBC, three cases), lung adenocarcinoma (LAC, three cases), and colorectal cancer (CRC, three cases) from our previously published study “Cancer cell invasion and EMT marker expression: a three-dimensional study of the human cancer-host interface” 17 were included. The study is in accordance with the ethics guidelines of the Declaration of Helsinki. Ethical approval was obtained from the local ethics committee of the University Medical Center Freiburg (REF: 10012/16). The 3D reconstruction was performed as described before. 17 Briefly, per tumor, serially prepared 5-µm-thick tissue slices from paraffin-embedded formalin-fixed specimens were immunohistochemically stained for Cytokeratin AE1/3, ZEB1, and E-Cadherin. Heat-induced antigen retrieval was performed in pH 9.0 antigen retrieval buffer (S2368; Dako, Hamburg, Germany) at 95°C for 40 min. Primary antibodies for Pan-Cytokeratin (PCK, IR053; Dako) and E-Cadherin (E-Cad, IR059; Dako) with LINKER reagent (K8021; Dako) were used on an autostainer LINK 48 (Dako) device. For the Streptavidin–biotin peroxidase detection, EnVision® Flex Peroxidase-Blocking Reagents (SM801, Dako), EnVision Flex+ Rabbit (LINKER, K8019; Dako), or EnVision Flex+ Mouse (LINKER, K8021; Dako) and EnVision Flex/HRP (SM802, Dako) were used. For ZEB1, incubation with anti-ZEB1 antibody (HPA027524, 1:800 in phosphate-buffered saline (PBS); Sigma) at room temperature overnight was followed by staining with Dako REAL™ Detection System (K5001; Dako).
Counterstaining was performed with hematoxylin before adding a coverslip. For tumor cells, immunohistochemistry was considered positive when an appropriate brown staining reaction was observed cytoplasmatically for PCK, at the plasma membrane for E-Cadherin, and in the nucleus for ZEB1. Omission of primary antibodies served as negative controls. As internal positive controls for PCK and E-Cadherin, physiological epithelia were used. Smooth muscle cells of blood vessels were used for ZEB1-positive control. All slides were digitalized using the Pannoramic SCAN® device. Pictures were taken from two independent hot spot areas with a high tumor density and subjected to Free-D Software 1.09. 18 Boundaries of all tumor cell clusters were followed from every digitalized picture and labeled as follows: clusters with more than five tumor cells were defined as main tumor branches (MTB). Tumor buds defined as up to five cohesive tumor cells 16 were subdivided into ITB without any traceable connection to MTB and CTB with connection to the MTB. Tumor buds whose contact was represented to the margins of the 3D reconstructed volumes were defined as outside tumor bud (OTB). Next, pictures were transferred following the primary sequential organization into Microsoft PowerPoint® 2010 (MPP) for manual tumor complex annotation. Additionally, for tumor complex annotation, the tumor mass with the greatest coherent expansion was chosen manually and labeled in each MPP slide as tumor cells from the origin mass (ORG). In case of ORG segmentation, numbering of the tumor mass with the greatest coherent expansion was continued as ORG, and the tumor mass with the smaller coherent expansion was serially numbered according to their subdivision into branches (B) of increasing order (B1–B4). More details are given in Figure 1(a) and (b). Annotated numbering was exported from each Microsoft Power Point (MPP) slide-compromising file to Microsoft Excel by an MPP-macro-based script.

(a) Tumor segmentation scheme. MTB segmentation scheme. Numbered tumor mass with the greatest coherent expansion (e.g. 1), serial crotched but affiliated tumor masses with a smaller coherent expansion were continuously serially numbered (e.g. 11, 111, 112, and 1111). For statistical analyses, tumor cells from the origin were marked as ORG, first-order branches B1, second-order branches B2, and third-order branches B4. (b) Histological annotation. Serial annotated slices of a ductal pancreatic adenocarcinoma. 1b1-annotated area from CK AE1/3-stained slide, 1b2-annotated area from an E-Cadherin stained slide, and 1b3-annotated area from a ZEB1 stained slide. All pictures are taken at 200-fold magnification.
Assessment of morphology and staining pattern after 3D reconstruction
Tumor cell morphology was qualified as spindle-like or rounded according to Friedl et al.1,19 In short, morphology was graded as spindle-like when exhibiting a longitudinally stretched mesenchymal-like form. Rounded cell shape was assigned to cells without clearly polarized (cuboidal or prismatic) appearance (Figure 2).
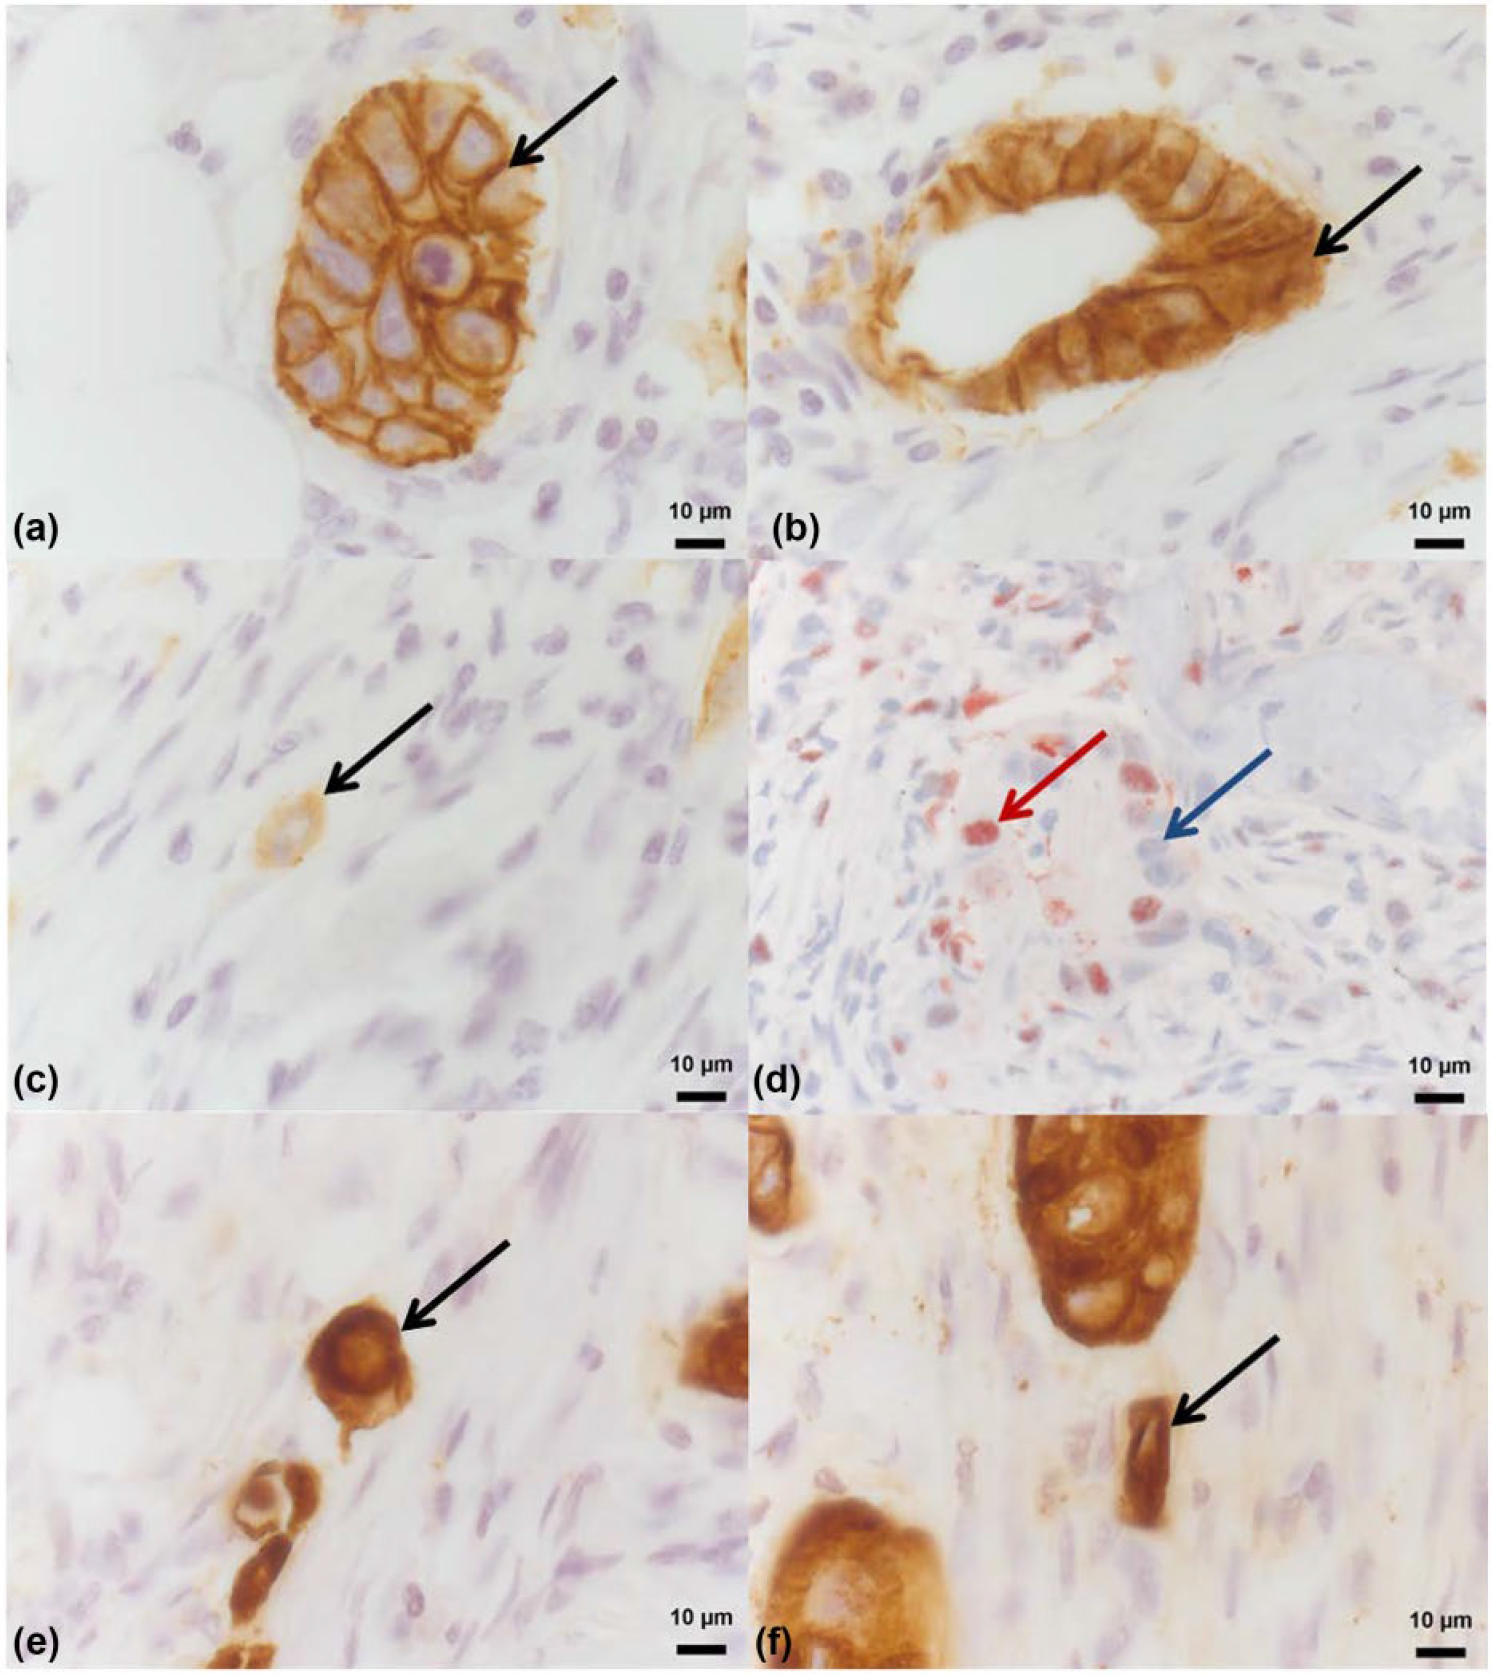
Histological and morphological quantification. Immunohistological EMT analyses for E-Cadherin (a = membranous; b = cytoplasmatic; c = aberrant, black arrow labeled) and ZEB1 (d = positive, red arrow labeled and negative, blue arrow labeled). CK AE1/3-stained tumor cells with a histomorphological amoeboid (e, black arrow labeled) and mesenchymal (f, black arrow labeled) configuration.
EMT was represented using E-Cadherin as effector and ZEB1 as EMT inductor. For E-Cadherin, overall staining intensity of the respective cell cluster was graded as aberrant (0) or positive (1). The predominant subcellular E-Cadherin location was described as membranous, cytoplasmic, or aberrant. Tumor cells were considered ZEB1 positive if nuclear positive staining was detectable (Figure 2).
All parameters described above were quantified in each alternating MPP slide. Altogether, the total number of tumor cells in each annotated cluster of each slide was counted separately and evaluated for cell morphology and EMT marker expression for each 3D model. Only cells with a clearly definable nucleus were included into the evaluation.
Statistics
Statistical calculations were performed with MedCalc Statistical Software version 15.8 (2015; MedCalc Software BVBA, Ostend, Belgium). Immunohistochemical and morphological parameters were assessed as absolute and relative proportions. Statistical comparison of frequencies between different groups of cells was performed as meta-analyses across all tumors,20,21 using a fixed effects model when no heterogeneity was detected by Cohan’s Q test and a random effects model in case of heterogeneity. 22 Regression curve analysis was performed using an inverse correlation function (y = a/x + c) with estimates derived for coefficients a and c.
Results
From each patient, 48 serial vision fields of 200-fold magnification (high power field (HPF)) were examined and assessed according to the following segmentation scheme (Figure 1(a)). Tumor cells from the ORG were pooled and compared to the pooled cells from first-order branches (B1). B1 was compared to second-order branches (B2) and B2 to third-order branches (B3).
The median frequency for the original tumor mass (ORG) per field of vision in 200-fold magnification was n = 4 (range 0–18), n = 3 for B1 (range 0–15), n = 2 for B2 (range 0–17), and n = 1 for B3 (range 0–14). In total, per individual tumor, 89–476 ORG, 112–398 B1, 55–370 B2, and 12–363 B3 were manually labeled and connected. Quantitative results of amoeboid and mesenchymal morphology as well as ZEB1 and E-Cadherin expression are shown in Table 1.
Comparison of connected tumor buds, isolated tumor buds, and tumor buds from outside the model.

PDAC: pancreatic ductal adenocarcinoma; CRC: colorectal cancer; LCA: lung adenocarcinoma; IDBC: invasive ductal breast cancer; ZEB1: zinc finger E-box binding homeobox 1; E-Cad: E-Cadherin; MTB: main tumor branches; CTB: connected tumor buds; ITB: isolated tumor buds; OTB: outside tumor buds.
Quantitative results of amoeboid and mesenchymal morphology as well as ZEB1 and E-Cadherin expression in main tumor branches, connected tumor buds, isolated tumor buds, and outside tumor buds of pancreatic ductal adenocarcinoma, colorectal cancer, lung adenocarcinoma, and invasive ductal breast cancer.
CTBs do not differ from ITBs
Across all tumors, 2764 CTBs and 269 ITBs were identified. Morphology (amoeboid/mesenchymal) and EMT marker expression (E-Cad/ZEB1) were compared between ITB and CTB. There were no differences neither for immunohistological E-Cadherin and ZEB1 expression patterns nor for tumor cell morphology (Table 2). The proportion of ITB in the current dataset is 8% (4%–13%). These results highlight the fact that most tumor buds are connected and not—as postulated—isolated from the original tumor mass. Rounded and spindle-shaped cells were more frequent in ITBs and CTBs. According to the EMT model, membranous E-Cadherin decreased significantly, while cytoplasmic/aberrant E-Cadherin and ZEB1 expression significantly increased in CTB and ITB in relation to the main tumor mass (MTM; p < 0.001 in meta-analysis across all tumors). Taken together, our results demonstrate that CTBs and ITBs are alike regarding the observed EMT characteristics.
Comparison of EMT marker expression and cell morphology in isolated versus connected tumor buds.
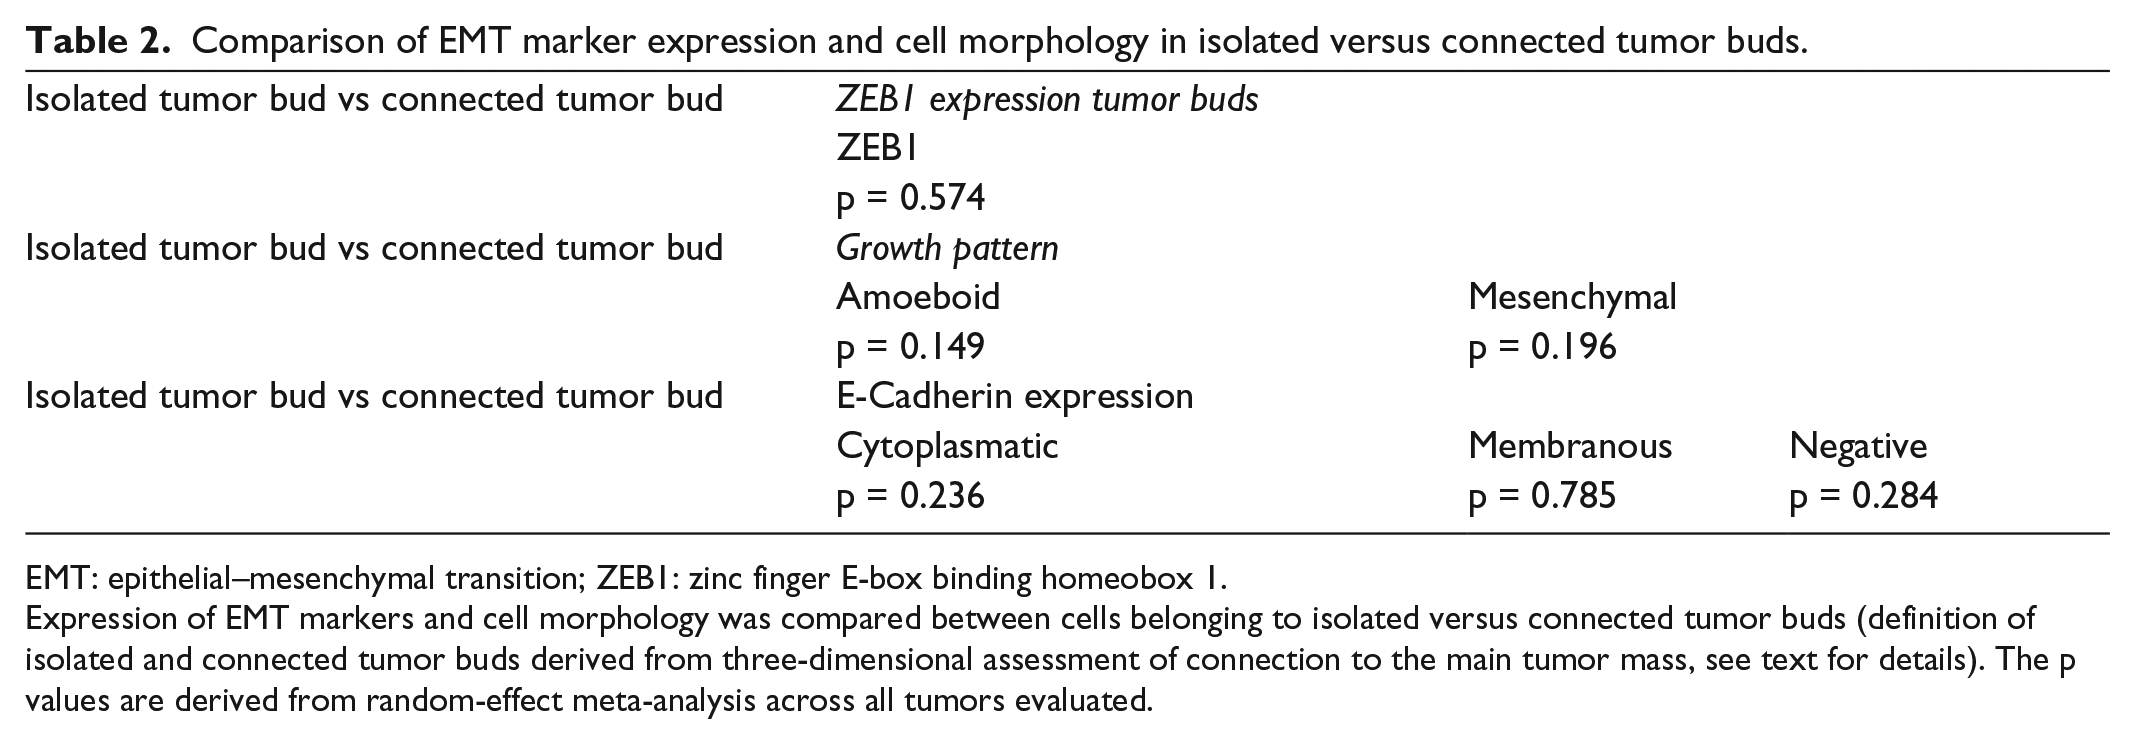
EMT: epithelial–mesenchymal transition; ZEB1: zinc finger E-box binding homeobox 1.
Expression of EMT markers and cell morphology was compared between cells belonging to isolated versus connected tumor buds (definition of isolated and connected tumor buds derived from three-dimensional assessment of connection to the main tumor mass, see text for details). The p values are derived from random-effect meta-analysis across all tumors evaluated.
Analysis according to the branching model shows no consistent pattern of EMT marker expression or tumor cell morphology along the tumor branching tree
To evaluate changes in marker expression and tumor cell morphology, we performed stepwise comparison along the tumor branching tree, starting from the defined origin cell mass along the branches. The proportion of clusters fulfilling the tumor bud definition increases slightly with higher distance from the ORG/order of branches (B1: 39%, B2: 37%, and B3: 47%) and mean cell cluster size decreases (B1: 44, B2: 32, and B3: 18 cells per cluster on average).
E-Cadherin expression did not change significantly from ORG to B1 or B1 to B2. Only from B2 to B3, a significant decrease in membranous E-Cadherin staining, accompanied by an increased cytoplasmic staining, was observed. Inconsistent with this observation, a significant increase in nuclear ZEB1 expression was only revealed when comparing B1 and B2 (higher in B2; p = 0.013; Table 3). The cell morphology displayed a similar inconsistency along the branching tree, with significant increases in the percentage of mesenchymal-like and rounded cells existent only from ORG to B1 and B2 to B3. Nevertheless, comparing ORG cells with B3 cells, a consistent pattern of decrease in membranous E-Cadherin expression and increase in cytoplasmic E-Cadherin, nuclear ZEB1, and rounded and mesenchymal cell shape was noted. In summary, our meta-analysis across all tumors disclosed heterogeneous results considering immunohistochemistry and histomorphology (Table 3).
Comparison of EMT marker expression and cell morphology in tumor branch categories.

EMT: epithelial–mesenchymal transition; B1–3: tumor branches of first/second/third order; ORG: origin mass; ZEB1: zinc finger E-box binding homeobox 1.
Cross-tabular comparison of expression of EMT markers and cell morphology between cells belonging to the distinct categories of tumor branches (definition of tumor branch categories derived from three-dimensional assessment of the tumor branching structure, see text and Figure 1 for details). The p values are derived from random-effect meta-analysis across all tumors evaluated.
Cell numbers in tumor cell clusters correlate with EMT marker expression and morphology
Given the results outlined above, we hypothesized that marker expression and morphology correlate with the size of the tumor cell groups rather than a branching model. The tumor cell clusters, as assessed two-dimensionally, were categorized as containing only 1 (unicellular tumor bud, 1TB), 2–5 (oligocellular tumor bud, 5TB), 6–50 (poly-cellular tumor cell group, 50TG), and more than 50 tumor cells (MTM). Cells from 1TB, 5TB, 50TG, and MTM were pooled for each tumor and compared for marker expression and morphology. Meta-analysis across all tumors disclosed highly significant differences between each of these categories with regard to E-Cadherin and ZEB1 expression as well as morphology (Table 4). A lower cell number per cluster correlated with a decrease in membranous E-Cadherin staining and an increase in cytoplasmic E-Cadherin and nuclear ZEB1 staining. In addition, a decrease in cells per cluster correlated with an increase in rounded and mesenchymal cell morphology. Also, omission of 50TG clusters revealed equivalent results (Table Supplement 1). Quantitatively speaking, during a quantitative decrease of cells, our results demonstrate a subsequent increase in the EMT activity.
Comparison of EMT marker expression and cell morphology in tumor branch categories.

EMT: epithelial–mesenchymal transition; tumor bud: tumor bud composed of up to five cells (standard definition); one tumor cell: tumor bud consisting of only one tumor cell; 50TG: tumor bud composed of up to 50 cells; ZEB1: zinc finger E-box binding homeobox 1.
Cross-tabular comparison of expression of EMT markers and cell morphology between cells belonging to the distinct size categories of tumor buds and the main tumor mass (definition of tumor bud size categories derived from two-dimensional assessment of cell cluster size, see text for details). The p values are derived from random-effect meta-analysis across all tumors evaluated.
Regression curve analysis suggests a sequence of events at the invasive front
To further substantiate the finding that cell number per cluster was the most important factor associated with changes in morphology and EMT marker expression, scatter plots were constructed from pooled data of all tumors. Plotting the cell number per cluster versus the percentage of cells with mesenchymal or rounded morphology, membranous and cytoplasmic E-Cadherin expression as well as nuclear ZEB1 expression suggested an inverse (1/x) correlation between these events and cell number per cluster. By calculation of cutoffs for cluster cell numbers (Figure 3), a sequence of events was reconstructed (Table 5). The first event observed during reduced cell cluster size was the loss of membranous E-Cadherin (cutoff at 9 cells per cluster), followed by the expression of cytoplasmic E-Cadherin (cutoff at 8 cells per cluster), and finally the expression of nuclear ZEB1 (cutoff at 7 cells per cluster). Morphologic changes followed subsequently in this sequence, with an increase in rounded cell morphology (cutoff at 4 cells per cluster) followed by a rise in mesenchymal-like cell morphology (cutoff at 2 cells per cluster; Figure 4). This characteristic sequence of events was independent of the tumor origin.

Mathematical framework for the relationship of EMT marker expression, cell morphology, and cell cluster size. Immunohistochemical marker expression and morphologic parameters evaluated in the cell clusters were plotted on the y-axis against cell cluster size as assessed in light microscopy (two-dimensional) on the x-axis. (a) Inverse regression curves were fitted (regression model following the formula y = c/x + k) and cutoff cell number defined as the cell cluster size where the tangent to the regression curve reaches a slope of 45° to the x-axis. (b–f) Scatter plot and regression curve for nuclear (b) ZEB1, (c) membranous E-Cadherin, (d) cytoplasmic E-Cadherin, (e) rounded cell morphology and (f) spindle-like/mesenchymal morphology. Note the decrease in membranous E-Cadherin as opposed to the increase in the other parameters with decreasing cell cluster size.
Cutoffs of cell cluster size for the assessed changes in EMT marker expression and cell morphology, as calculated from the fitted regression curves.

ZEB1: zinc finger E-box binding homeobox 1; PDAC: pancreatic ductal adenocarcinoma; CRC: colorectal cancer; LAC: lung adenocarcinoma; IDBC: invasive ductal breast cancer; SD: standard deviation.
Cutoffs for the observed changes in marker expression and morphology depending on cell cluster size were calculated from the regression curve coefficients (for details, see text and Figure 3) for the distinct tumor entities and summarized by mean and standard deviation.

Schematic diagram comprising quantitative histomorphological results. Schematic diagram comprising cell count number and quantitative histomorphological as well as immunohistological findings in connected and isolated tumor buds. A decrease in membranous and a concomitant increase in cytoplasmic E-Cadherin staining as well as an increase in nuclear ZEB1 staining and furthermore an increase in rounded and mesenchymal morphology are shown.
Discussion
E-Cadherin, ZEB1, and tumor cell morphology cannot identify “real” tumor buds
Contrary to previous belief, so-called tumor buds remain predominantly connected to the MTM. 17 Here, we demonstrate that tumor buds connected to the MTM also present similar morphological and immunohistological characteristics concerning EMT, compared to non-connected ITBs (Figure 4). Regarding tumor biology, this raises the question whether tumor buds are responsible for tumor invasion or whether they merely represent a concomitant phenomenon.
Tumor branching and EMT are not consistently spatially correlated
According to the tumor segmentation scheme, the only consistent EMT marker and tumor cell morphology pattern change was detectable between ORG and B3. Of note, greater order of branching is associated with reduced tumor cell number per cell cluster. Consequently, our data show an increase in EMT markers with decreasing cell number per cell cluster. This could indicate the fact that not segmentation but the degree of dispersion of tumor cells into small clusters is associated with EMT.
An EMT cascade defines tumor buds and culminates in tumor cell morphology
Nevertheless, there is a considerable lack of knowledge about the in vivo role of EMT and its relation to tumor budding activity. In literature, a generally accepted cutoff in the tumor bud definition (up to five cohesive tumor cells) was never quantitatively validated, neither by conventional histology nor by immunohistochemistry.
Our data show quantitatively that the EMT cascade is initiated by a loss of membranous E-Cadherin at an average tumor cell count of nine adherent tumor cells per cell cluster. Subsequently, a shift from membranous to cytoplasmic E-Cadherin staining is detectable at an average tumor cell count of eight adherent tumor cells. A significant increase in nuclear ZEB1 can only be detected at a tumor cell count of seven adherent tumor cells. In contrast to experimental models suggesting a sequence of EMT induction by ZEB1 followed by loss of membranous E-Cadherin,23,24 our data challenge this concept and hint toward an inverse order of these events.
Our findings support a role of E-Cadherin in EMT which has been suggested before but is far from current EMT models. Liu et al. 25 presented the loss of E-Cadherin as a cause and not a consequence of EMT and suggest that the expression of E-Cadherin does not predict either invasive behavior or metastatic phenotype. Si et al. 26 discuss that a decrease or loss of E-Cadherin expression is associated with CpG island methylation in the promoter region of the E-Cadherin gene.
Considering the EMT ZEB1–E-Cadherin axis, it is also possible that the loss of membranous E-Cadherin induces ZEB1 in a self-reinforcing loop to maintain a mesenchymal state. 27 Onder et al. 27 demonstrated that E-Cadherin loss by knockdown or expression of a dominant negative form results in profound changes of the transcriptome of epithelial cells, at least in part resulting from regulation of multiple transcription factors, including upregulation of ZEB1 and translocation of β-Catenin from the membrane to the nucleus. Another study showed that E-Cadherin regulated the expression of over 2000 genes in embryonic stem cells. Apart from its interaction with β-Catenin of the canonical Wnt signaling pathway, E-Cadherin has also been shown to be involved in complex interactions with receptor tyrosine kinase (epidermal growth factor receptor (EGFR) and fibroblast growth factor receptor (FGFR)) and small GTPases (Rho, Rac, and Cdc42) pathways. 28 Taken together, there is a cumulative evidence that E-Cadherin expression may contribute itself to play a major regulatory role in transcriptional regulation, growth factor signaling, EMT, and metastasis. This is compatible with our observation that changes in E-Cadherin expression were the first of the observed EMT events in cancer cells.
In summary, the idea of “form follows function” is transferable onto the histomorphological aspects of migration—form—and the concept of EMT—function—for several of the discussed aspects. Tumor buds connected and disconnected with the MTM are similar in form. Translated to function, EMT marker expression and tumor cell phenotype do not differ in both types of tumor buds (Figure 4). Furthermore, tumor cell number in tumor cell clusters correlates consistently with EMT marker expression and morphology.
As a drawback, the tumor segmentation scheme, a self-developed analytical tool for statistical marker analyses of 3D models, did not obtain the expected results. As an explanation, tumor cell number in the B3 branches is not low enough for statistical significances.
Additional studies are required to understand the molecular cascades controlling the E-Cadherin/ZEB1 axis effecting tumor cell morphology. Spatial 3D reconstruction can currently only be performed using formalin-fixed paraffin-embedded tissue specimens limiting the extent for spatial molecular analyses. Nevertheless, our findings show first important aspects of the different processes of EMT and tumor budding.
Footnotes
Acknowledgements
The authors want to thank Markus Kühs for his excellent technical support. K.E.A. is involved in 3D reconstruction, data collection, literature research, and writing of manuscript; M.B. participated in data collection, literature research, diagrams, and writing of the manuscript; T.D.A. and A.C. participated in 3D reconstruction and data collection; K.F. contributed MPP and Excel programming; S.T. and M.W. have done data collection and critical review of the manuscript; B.K., J.H., T.K., and E.S. participated in operations, literature research, and critical review of the manuscript; J.M., P.R., and O.S. have done literature research and critical review of the manuscript; T.B. is responsible for ZEB1 staining critical review of the manuscript; U.F.W. is involved in PB study design, statistics and data interpretation, and writing and critical review of the manuscript. K.E.-A. and M.B. contributed equally and share first authorship. P.B. and U.F.W. contributed equally and share senior authorship.
Declaration of conflicting interests
The author(s) declared no potential conflicts of interest with respect to the research, authorship, and/or publication of this article.
Funding
The author(s) disclosed receipt of the following financial support for the research, authorship, and/or publication of this article: O.S. is supported by grants of the Deutsche Forschungsgemeinschaft (DFG; SCHI 871/2, SCHI 871/5, SCHI 871/6, GR 1748/6, and INST 39/900-1) and the SFB850 (Project B8), a starting grant of the European Research Council (Programme “Ideas”—Call identifier: ERC-2011-StG 282111-ProteaSys), and the Excellence Initiative of the German Federal and State Governments (EXC 294, BIOSS). The article processing charge was funded by the German Cancer Foundation (DFG) and the Alberts Ludwigs University Freiburg in the funding programme Open Access Publishing.
References
Supplementary Material
Please find the following supplemental material available below.
For Open Access articles published under a Creative Commons License, all supplemental material carries the same license as the article it is associated with.
For non-Open Access articles published, all supplemental material carries a non-exclusive license, and permission requests for re-use of supplemental material or any part of supplemental material shall be sent directly to the copyright owner as specified in the copyright notice associated with the article.