
Abstract
Renin–angiotensin system and adenosine monophosphate–activated protein kinase signaling pathway both play important roles in carcinogenesis, but the interplay of renin–angiotensin system and adenosine monophosphate–activated protein kinase in carcinogenesis is not clear. In this study, we researched the interaction of renin–angiotensin system and adenosine monophosphate–activated protein kinase in renal carcinogenesis of uninephrectomized rats. A total of 96 rats were stratified into four groups: sham, uninephrectomized, and uninephrectomized treated with angiotensin-converting enzyme inhibitor or angiotensin receptor blocker. Renal adenosine monophosphate–activated protein kinase and its downstream molecule acetyl coenzyme A carboxylase were detected by immunohistochemistry and western blot at 10 months after uninephrectomy. Meanwhile, we examined renal carcinogenesis by histological transformation and expressions of Ki67 and mutant p53. During the study, fasting lipid profiles were detected dynamically at 3, 6, 8, and 10 months. The results indicated that adenosine monophosphate–activated protein kinase expression in uninephrectomized rats showed 36.8% reduction by immunohistochemistry and 89.73% reduction by western blot. Inversely, acetyl coenzyme A carboxylase expression increased 83.3% and 19.07% in parallel to hyperlipidemia at 6, 8, and 10 months. The histopathology of carcinogenesis in remnant kidneys was manifested by atypical proliferation and carcinoma in situ, as well as increased expressions of Ki67 and mutant p53. Intervention with angiotensin-converting enzyme inhibitor or angiotensin receptor blocker significantly prevented the inhibition of adenosine monophosphate–activated protein kinase signaling pathway and renal carcinogenesis in uninephrectomized rats. In conclusion, the novel findings suggest that uninephrectomy-induced disturbance in adenosine monophosphate–activated protein kinase signaling pathway resulted in hyperlipidemia and carcinogenesis in tubular epithelial cells, which may be largely attenuated by renin–angiotensin system blockade, implying the interaction of renin–angiotensin system and adenosine monophosphate–activated protein kinase signaling pathway in renal carcinogenesis of uninephrectomized rats.
Keywords
Introduction
When it comes to the complications of kidney transplantation, we often think of the immune rejection and immunosuppression-induced infection from recipients’ point of view. From donors’ point of view, renal cell carcinoma occurs in the solitary kidney after living kidney donation and the malignant transformation generally leads to poor prognosis. 1 Our previous studies have shown that metabolic disorders characterized by hyperglycemia and hyperlipidemia occurred before the spontaneous pathological identification of cancer cell formation in remnant kidneys of uninephrectomized (UNX) rats.2–5 Interestingly, renin–angiotensin system (RAS) activation in the renal cortex is persistently activated followed by dysmetabolism and renal carcinogenesis in UNX rats, and RAS blockade with an angiotensin-converting enzyme inhibitor (ACEI) almost ameliorates all the UNX-induced abnormalities.3–5 Similar to RAS, adenosine monophosphate (AMP)-activated protein kinase (AMPK) signaling pathway mediates metabolic responses and is also involved in carcinogenesis.6–8 AMPK serves as a cellular energy sensor activated under energy stress, and a tumor suppressor that inhibits anabolic metabolism. 8 Therefore, we intend to investigate the interplay of RAS and AMPK signaling pathway in carcinogenesis by using the UNX rat model. Glucose oxidation transformation from normal mitochondrial oxidative phosphorylation to anaerobic metabolism first ties dysmetabolism and cancer together, 9 and large numbers of studies on cancer prefer to glucose dysmetabolism.10,11 Alternatively, we attempt to research the interaction between RAS and AMPK in carcinogenesis of UNX rats by dynamically detecting fasting lipid profiles.
Materials and methods
Animals
Three-month-old male Sprague-Dawley rats (300–350 g) were housed at the Laboratory Animal Services Centre of Guilin Medical University. The animals were pair-housed in cages at 23 ± 1°C with a 12-h dark/light cycle, and they had free access to water and feed on a standard laboratory rat diet (5001 Rodent Diet; LabDiet). The total duration of studies was 10 months.
A total of 96 rats were randomized into four groups: sham operation (sham, n = 24), left uninephrectomy (UNX, n = 24), and left uninephrectomy plus treatment with angiotensin-converting enzyme inhibitor (ACEI) lisinopril (ACEI, n = 24) or angiotensin receptor blocker (ARB) losartan (ARB, n = 24). Prior to assignment and randomization, animals’ body weight was recorded, and no animal had a body weight out of the ±20% range from their corresponding mean body weight of 321 g. Animals were randomly assigned to four study groups using a computer-generated process of randomization based on body weight. The mean body weight for each group differed by no more than 5% from the sham group at the time of group assignment. Animal experiments were conducted in accordance to the approved study protocol from the Institutional Animal Experimentation Ethics Committee.
Uninephrectomy procedures
Rats were anesthetized with ketamine (75 mg/kg) and xylazine (10 mg/kg) and subjected to sham operation, left uninephrectomy, or left uninephrectomy plus ACEI and ARB treatment. Lisinopril and losartan were dissolved in sterile distilled water, with once daily dosage of 4 mg per kg body weight. All the sham and UNX rats were also gavaged with distilled water (3 mL) as the placebo control. The left kidney was exposed via a flank incision of length 1–1.5 cm and was removed, leaving the adrenal gland intact.
Examinations for histopathology
Microscopic examinations were performed to assess renal histology and protein expressions of cell proliferation indicators and AMPK signaling pathway, such as Ki67, mutant p53, AMPK, and acetyl coenzyme A (CoA) carboxylase (ACC) in remnant kidneys and right kidney of sham rats by hematoxylin–eosin (HE) staining and immunohistochemistry at 10 months after operation. Specimens were first fixed in 10% neutral formaldehyde for 24 h. After fixation, tissues were embedded in paraffin and dissected with 4 µm cross-sections, and then baked in 60 ± 5°C for 2 h. The dried slides were then put in xylene I, II, and III (Chemical Reagent Co., Ltd) to dewax each for 5 min. After these sections out from xylene, they were soaked in ethanol absolute I and II and 95%, 85%, and 70% ethanol (Chemical Reagent Co., Ltd) for 4 min in sequence and then irrigated with flowing water for 2 min. Tissue slides for renal histological examination were first stained with hematoxylin (H9627; Sigma-Aldrich, Inc.) for 3 min followed by irrigation, and then stained with eosin (E4009; Sigma-Aldrich, Inc.) for 1 min. Finally, the HE-stained sections were soaked in 75%, 85%, 95% ethanol and ethanol absolute for 2 min. After dewaxing, renal sections for protein detections underwent antigen repair. The washed slides with 3000 mL antigen retrieval buffer ethylenediaminetetraacetic acid (EDTA; pH 8.0; Guanghua School of Science and Technology Co., Ltd) in a pressure kettle were heated and allowed to boil for 2 min. Then, the pressure kettle was kept in cold water to cool the antigen retrieval buffer. The repaired antigens were soaked in distilled water to remove EDTA further. After distilled water treatment, tissue slides also soaked in 3% H2O2 (Chemical Reagent Co., Ltd) for 10 min and then wiped dry. Importantly, a perfect circle was drawn around renal tissue to prevent antibody out of the circle causing false negative. Tissue slides were then stained with anti-Ki67 (dilution: 1:400; PA0230; Leica), anti–mutant p53 (dilution: 1:400; PA0057; Leica), anti-phospho-AMPKα (dilution: 1:200; SAB4502329; Sigma-Aldrich, Inc.), and anti-phospho-ACC (dilution: 1:100; SAB4503799; Sigma-Aldrich, Inc.) and incubated overnight at 4°C. Since detected proteins combined with primary antibodies strongly, the slides were washed with phosphate-buffered saline (PBS) three times, each time for 5 min. Next, drops of reagent A (horseradish peroxidase (HRP); DAKO ChemMate EnVision) were added to slides to cover the immunocomplex, and the slides were incubated at 37°C for 30 min. Finally, these tissue slides were taken out and wiped dry, and then diaminobenzidine (DAB) chromogenic solution (DAKO ChemMate EnVision: 2 mL substrate buffer and 10 µm DAB + chromogen) was added to immunocomplex for 5 min under a microscope to determine the most appropriate staining intensity. After termination of staining by tap water, slides were irrigated with flowing water for 10 min, re-stained with hematoxylin for 1 min, and then irrigated finally for microscopic examinations. The pathologist who reviewed the stained slides was blinded to group assignment and clinical and laboratory data. Representative images were automatically captured using a digital spot camera (AX10; Carl Zeiss). Semi-quantitative method of immunohistochemical images was analyzed by selecting 20 representative images from each group, defining negative as 1 point, weak positive as 2 points, positive as 3 points, and strong positive as 4 points.
Western blot
Tissue extracted from the renal cortex at 10 months was homogenized in a buffer containing 50 mmol/L Tris-HCl (pH 7.4), 150 mmol/L NaCl, 1 mmol/L phenylmethylsulfonyl fluoride, 1 mmol/L ethylenediaminetetraacetic acid (EDTA), 1% sodium deoxycholate, 1% Triton X-100, 1% sodium dodecyl sulfate (SDS), and 5% protein enzyme inhibitor cocktail (cat no. P2714; Sigma-Aldrich, Inc.). The homogenate was centrifuged at 13,000 r/min for 10 min at 4°C. The supernatant containing sample protein was removed and boiled for 5 min. The protein concentrations in the supernatant were determined by the BCA Protein Assay Kit (cat no. 23225; Thermo Fisher Scientific) using bovine serum albumin (BSA) as the standard. Tissue lysates (100 mg) and prestained molecular weight markers were loaded onto SDS-polyacrylamide electrophoresis gels (4% acrylamide stacking gel and 8% running gel). The resolved proteins were then transferred onto nitrocellulose membranes. The membranes were blocked for 1 h at room temperature with 5% skimmed milk and incubated with rabbit anti-phospho-AMPKα1 (dilution: 1:200; sc-101631; Santa Cruz Biotechnology, Inc.) and rabbit anti-phospho-ACC (dilution: 1:100; sc-30446-R; Santa Cruz Biotechnology, Inc.) in Tris-buffered saline (TBS) containing 0.05% Tween 20 (TBS-T) with 5% skimmed milk overnight at 4°C. After washing with TBS-T, membranes were incubated with secondary antibody conjugated to HRP with dilution of 1:2000. Proteins were detected by enhanced chemiluminescence on Hyperfilm (Corporation of GE, USA). To ensure equal loading of proteins, membranes were incubated and probed with a rabbit anti-β-actin antibody (1:10,000; Abcam), which recognizes the β-actin protein at approximately 43 kDa; just as important, the major protein bands with approximately 63 kDa for phosphorylated AMPKα1 and 272 kDa for phosphorylated-ACC were detected. Signals were quantitated by densitometry and corrected for the β-actin signal using the Kodak Digital Image Station 440CF and the ID Image Analysis software program.
Biochemical studies
Biochemical measurements were immediately performed in serum after collection of the blood samples. At 3, 6, 8, and 10 months, fasting blood samples were taken by killing every six rats for measurement of lipid profile including total cholesterol, triglyceride, high-density lipoprotein (HDL)-cholesterol (HDL-C), and low-density lipoprotein (LDL)-cholesterol (LDL-C). The rat serum lipid measurements were performed on a UniCel DxC 600 System (Beckman Coulter). Total cholesterol was measured by an enzymatic method, and triglycerides were measured by an enzymatic method without glycerol blanking. HDL-C was measured by an indirect method in which phosphotungstic acid reagent was used to precipitate the LDL and very LDL-C, and the remaining HDL-C was measured by the total cholesterol method. The HDL-precipitating reagent was purchased from Thermo Electron. LDL-C concentration was calculated with the use of Friedewald’s formula. All reagents were used according to the manufacturer’s instruction, and the analytical performance of these methods was within the manufacturer’s specifications.
Statistical analysis
Data were mean ± standard deviation (SD) values unless otherwise specified. For continuous variables in normal distribution, one-way analysis of variance (ANOVA) was used to evaluate the difference among the four groups. All data analyses were carried out using the PASW Statistics software 18.0 (SPSS Inc.). A two-tailed p value of less than 0.05 was taken as a criterion for a statistically significant difference.
Results
Inhibition of AMPK signaling pathway in remnant kidneys after operation by immunohistochemistry
First, AMPK expressions in remnant kidneys were detected by immunohistochemistry at 10 months after uninephrectomy. Compared with AMPK-positive tubular epithelia cytoplasm in sham rats (Figure 1(a), AMPK-sham, insert), low expression of AMPK was detected in the same location of UNX rats where atypical proliferation and carcinoma in situ occurred along with glomerulosclerosis and casts (Figure 1(a), AMPK-UNX). Treatment with ACEI had no significant correction on AMPK reduction, but renal histomorphology and AMPK-positive tubular epithelia in the ARB group were similar to those in sham rats (Figure 1(a), AMPK-ACEI, -ARB). Semi-quantitative analysis in AMPK demonstrated that AMPK expression in UNX rats was decreased by 36.8% than that of sham rats (sham vs UNX: 1.9 ± 0.256 vs 1.2 ± 0.152, p = 0.018). Treatments with ACEI and ARB increased the AMPK expression by 41.7% (UNX vs ACEI: 1.2 ± 0.152 vs 1.7 ± 0.052, p = 0.020) and 50.0% (UNX vs ARB: 1.2 ± 0.152 vs 1.8 ± 0.134, p = 0.006), respectively (Figure 1(b), AMPK).

AMPK and ACC expressions in right kidneys by immunohistochemistry. (a) Renal sections were obtained from sham, UNX, ACEI, and ARB rats at 10 months after uninephrectomy and stained with anti-phospho-AMPK and anti-phospho-ACC (brown) by immunohistochemistry. Original magnification ×200. (b) Semi-quantitative analysis of immunohistochemical images. Point 1 = negative, point 2 = weak positive, point 3 = positive, and point 4 = strong positive. Data are mean ± SD.
Contrary to the low expression of AMPK, its downstream molecule ACC involved in lipid metabolism was over-expressed in the tubular epithelia cytoplasm of UNX rats at 10 months after operation. Consistent with carcinogenesis in tubular epithelia characterized by neoplastic proliferation and carcinoma in situ, a high level of ACC was also detected in remnant kidneys accompanied by glomerular progressive degeneration and interstitial fibrosis (Figure 1(a), ACC-UNX, insert). Treatments with both ACEI and ARB significantly inhibited the ACC over-expression, non-different with the intact renal structure of sham rats (Figure 1(a), ACC-sham, -ACEI, and -ARB). Semi-quantitative analysis showed that the expression of ACC in UNX rats was the highest among the four groups (sham vs UNX: 1.2 ± 0.422 vs 2.2 ± 0.789, p = 0.002; UNX vs ACEI: 2.2 ± 0.789 vs 1.4 ± 0.516, p = 0.015; UNX vs ARB: 2.2 ± 0.789 vs 1.5 ± 0.527, p = 0.031; Figure 1(b), ACC).
Expressions of AMPK and ACC in remnant kidneys after uninephrectomy by western blot
Expressions of AMPK and ACC in UNX rats by western blot at 10 months after operation confirmed the immunohistochemical results in Figure 1. As shown in Figure 2(a), the lowest level of AMPK and highest level of ACC were both detected in UNX rats, and the levels of AMPK and ACC in ACEI and ARB groups were between those in sham and UNX rats. Semi-quantitative analysis showed that AMPK expression in UNX rats decreased 89.37% than that of sham rats (sham vs UNX: 149.9785 ± 2.3013 vs 15.9418 ± 0.8856, p < 0.001), and ACEI increased the low expression about 7.21 times (UNX vs ACEI: 15.9418 ± 0.8856 vs 130.9387 ± 3.6144, p < 0.001) while ARB about 9.16 times (UNX vs ARB: 15.9418 ± 0.8856 vs 162.0401 ± 2.7016, p < 0.001) (Figure 2(b), AMPK). Contrary to AMPK, ACC level in UNX was highest and statistically different with the other three groups (sham vs UNX: 168.9810 ± 0.8191 vs 201.1992 ± 1.0370, p < 0.001; UNX vs ACEI: 201.1992 ± 1.0370 vs 191.9818 ± 1.4060, p < 0.001; UNX vs ARB: 201.1992 ± 1.0370 vs 172.8540 ± 1.4729, p < 0.001; Figure 2(b), ACC).

Expressions of AMPK and ACC in right kidneys by western blot. (a) Western blot confirmed the immunochemistry results in Figure 1. Tissue lysates (100 mg) from renal cortex at 10 months were loaded onto 4% SDS-polyacrylamide electrophoresis gels and stained with primary antibodies for AMPK and ACC by western blot. (b) Relative expression levels of AMPK and ACC in right kidneys. AMPK and ACC signals were quantitated by densitometry and corrected for the β-actin signal. Data are mean ± SD.
Hyperlipidemia induced by uninephrectomy
In parallel to the inhibition of AMPK signaling pathway in remnant kidneys, UNX rats showed progressive hyperlipidemia by 3, 6, 8, and 10 months post operation, reflected by elevated fasting total cholesterol, triglyceride, HDL-C, and LDL-C levels. At 6 months, levels of HDL-C and LDL-C in UNX rats were statistically higher than those of sham rats (Figure 3(c): sham vs UNX: 0.66 ± 0.09 vs 1.62 ± 0.28 mmol/L, p < 0.05; Figure 3(d): sham vs UNX: 0.22 ± 0.03 vs 0.52 ± 0.04 mmol/L, p < 0.05). At 8 and 10 months, levels of total cholesterol and triglyceride between sham and UNX groups first showed statistical difference (Figure 3(a): sham vs UNX: 1.7 ± 0.03 vs 4.0 ± 0.5 mmol/L, p < 0.05; Figure 3(b): sham vs UNX: 0.69 ± 0.04 vs 1.49 ± 0.32 mmol/L, p < 0.05). ACEI attenuated the high levels of triglyceride and HDL-C from 6 months (Figure 3(b): ACEI vs UNX: 0.53 ± 0.07 vs 1.17 ± 0.16 mmol/L, p < 0.05; Figure 3(c): ACEI vs UNX: 0.51 ± 0.06 vs 1.62 ± 0.28 mmol/L, p < 0.05) while ARB had no obvious corrective effects on hyperlipidemia.
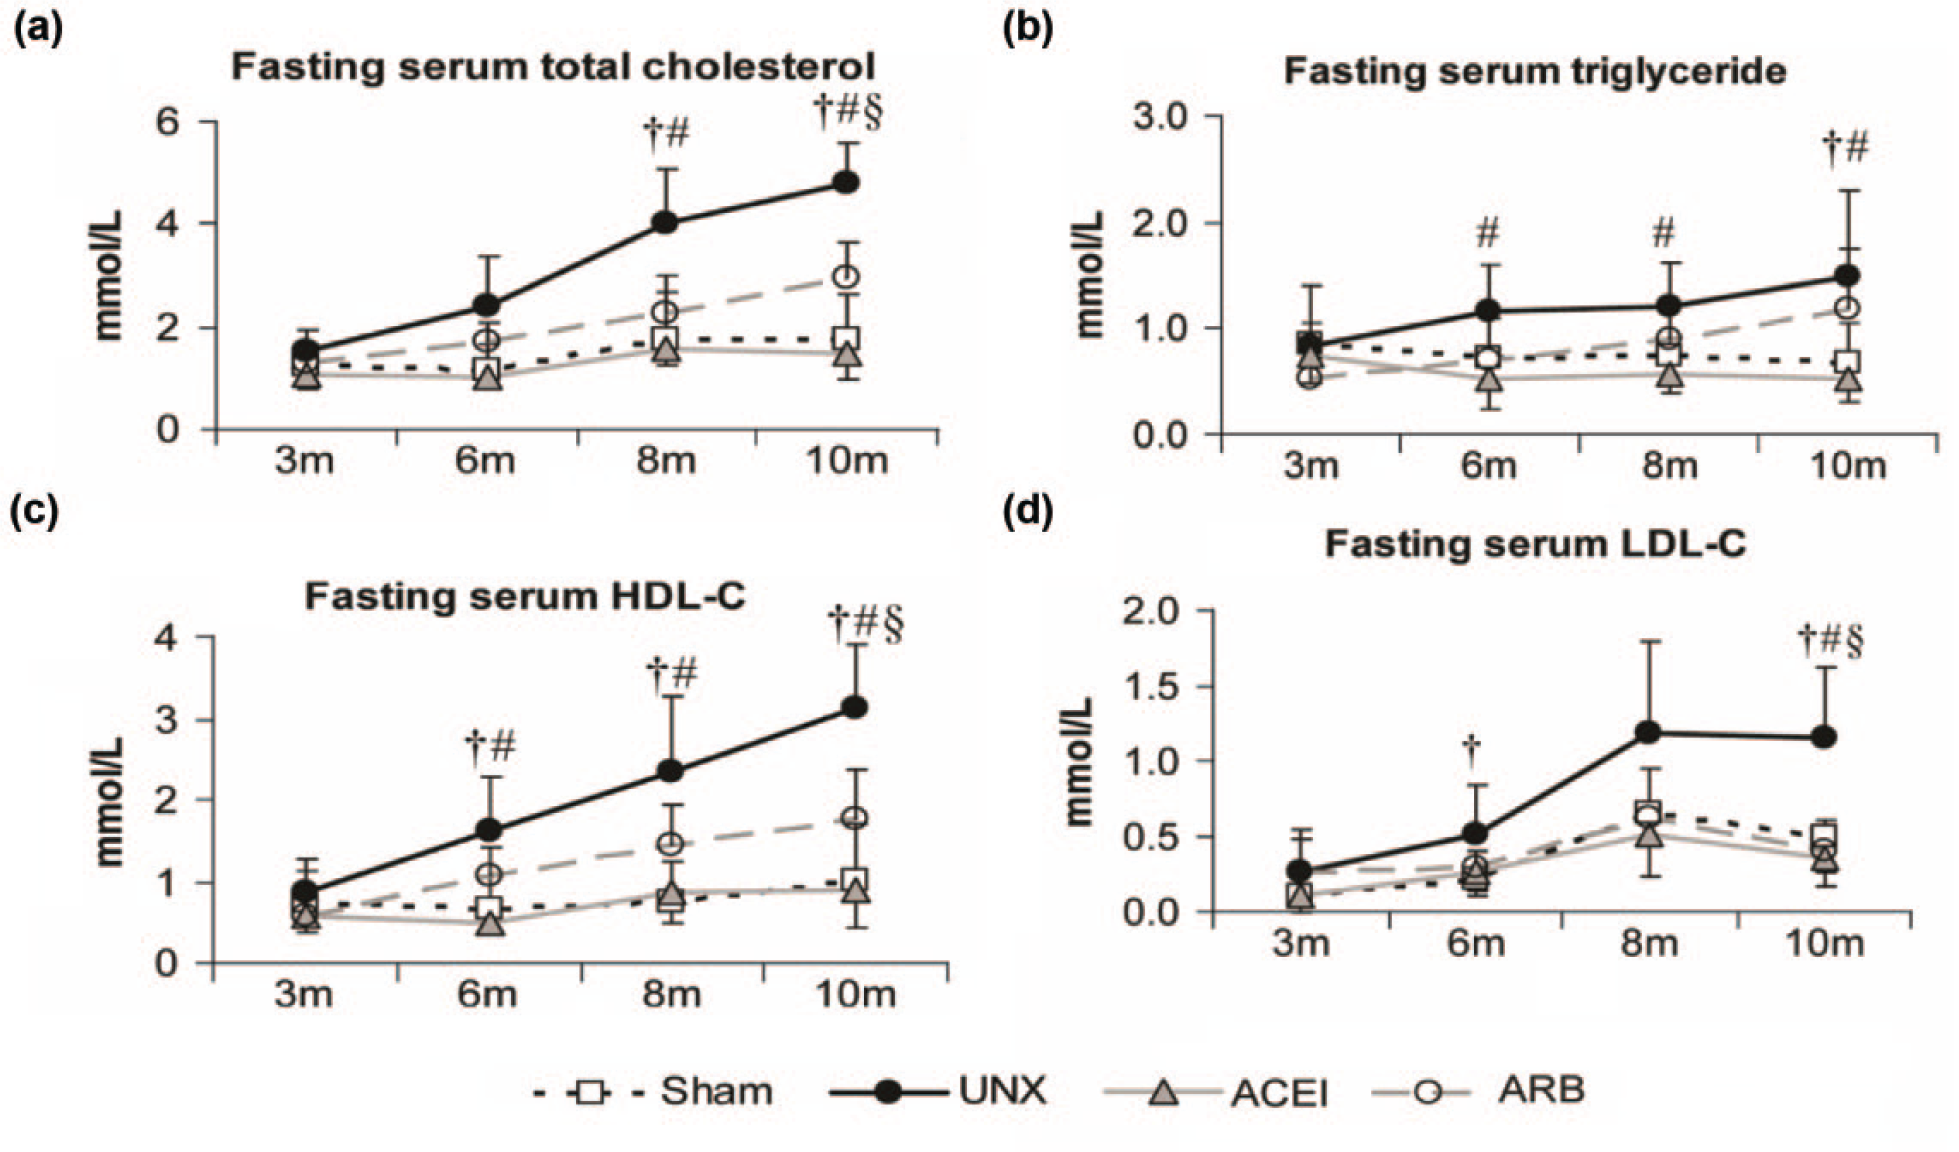
Longitudinal changes of lipid profile. Fasting (a) serum total cholesterol, (b) triglyceride, (c) HDL-C, and (d) LDL-C levels were measured in sham, UNX, ACEI, and ARB rats at 3, 6, 8, and 10 months after uninephrectomy. At 3 months, there was no obvious difference in fasting lipid profile between sham and UNX rats. At 6 months, HDL-C and LDL-C levels of UNX rats were significantly higher than those of the sham group. At 8 and 10 months, corrections of ACEI and ARB on the hyperlipidemia reached statistical levels. Data are mean ± SD.
Carcinogenesis in remnant kidneys induced by uninephrectomy
Renal carcinogenesis of UNX rats was reflected by neoplastic proliferation and carcinoma in situ located in remnant tubular epithelial cells through microscopic examination at 10 months post operation (Figure 4, UNX). In addition to malignant morphology, UNX rats also showed glomerulosclerosis, podocyte damage, basement membrane thickening, interstitial fibrosis with cast formation, and chronic inflammation (Figure 4, UNX). In contrast, sham rats (Figure 4, sham) and ACEI-treated UNX rats (Figure 4, ACEI) demonstrated normal renal structures while only glomerular hypertrophy and proliferation of tubular epithelial cells appeared in ARB-treated rats (Figure 4, ARB).

Microscopic examinations of renal histology. Renal sections were obtained from sham, UNX, ACEI, and ARB rats at 10 months after uninephrectomy and stained with HE. Microscopic examinations revealed that UNX rats developed neoplastic proliferation and carcinoma in situ of tubular epithelial cells accompanied with increased apoptotic bodies and mitotic figures while sham and ACEI rats showed normal renal histology. Treatment with ARB largely attenuated the cancerous structures only with typical cell proliferations. Original magnification ×200.
Consistent with morphologic transformations of malignancy, increased expressions of Ki76 and mutant p53 in UNX rats were measured by immunohistochemistry at 10 months (Figure 5). UNX rats showed glomerulosclerosis, tubular expansion, and inflammatory infiltration in both well-marked Ki67- and mutant p53-expressed tubular epithelia of remnant kidneys (Figure 5(a), UNX, insert). ACEI and ARB largely diminished the Ki67 over-expression (Figure 5(a), Ki67-ACEI, -ARB) similar to that of sham rats (Figure 5(a), Ki67-sham). Similar to anti-Ki67-stained renal tissues, sham and ACEI rats showed rare immunoreactivity of mutant p53 (Figure 5(a), mutant p53-sham, -ACEI), contrasting the increased p53 expression in limited tubular epithelia with slight tubular atrophy in the ARB group (Figure 5(a), mutant p53-ARB). Semi-quantitative analysis based on immunohistochemical results demonstrated that Ki67 expression in UNX rats was about 66.7% higher than that of sham rats (sham vs UNX: 1.5 ± 0.527 vs 2.5 ± 1.080, p = 0.017). Meanwhile, ACEI and ARB decreased the over-expression about by 36.0% (UNX vs ACEI: 2.5 ± 1.080 vs 1.6 ± 0.516, p = 0.029) and 44.0% (UNX vs ARB: 2.5 ± 1.080 vs 1.4 ± 0.470, p = 0.009) (Figure 5(b), Ki67). In addition, mutant p53 expression in UNX rats was about one time higher than that of sham rats (sham vs UNX: 1.2 ± 0.422 vs 2.4 ± 0.699, p < 0.001), and was decreased about by 41.7% (UNX vs ACEI: 2.4 ± 0.699 vs 1.4 ± 0.516, p = 0.002) and 33.3% (UNX vs ARB: 2.4 ± 0.699 vs 1.6 ± 0.699, p = 0.020) with treatments of ACEI and ARB (Figure 5(b), mutant p53).

Ki67 and mutant p53 expressions in right kidneys by immunohistochemistry. (a) Renal sections were obtained from sham, UNX, ACEI, and ARB rats at 10 months after uninephrectomy and stained with anti-Ki67 and anti-mutant p53 (brown). UNX rats showed increased Ki67 in nucleus and mutant p53 in both nucleus and cytoplasm of tubular epithelial cells with malignant proliferation accompanied by glomerulosclerosis and tubular expansion, contrasting the rare immunity of Ki67 and mutant p53 in sham rats. ACEI and ARB both treated the over-expression of Ki67 and mutant p53, and damaged renal structure near to that of sham rats. Original magnification ×200. (b) Expression of Ki67 in UNX rats increased up to 66.7% than that of sham rats, and ACEI or ARB reduced the over-expression about by 36.0% or 44.0%. Similarly, expression of mutant p53 in UNX rats was highest among the four groups. Data are mean ± SD.
Discussion
In all, we found that abnormal AMPK signaling pathway including inhibited AMPK and over-expressed ACC, as well as hyperlipidemia, coexisted with carcinogenesis of tubular epithelia characterized by morphologic transformations of malignancy and over-expressions of ki67 and mutant p53 in the UNX rat model. All of the above abnormalities were significantly attenuated by RAS blockade, suggesting the interaction of RAS and AMPK signaling pathway in the carcinogenesis of UNX rats.
Cancer starts from the genesis of tumor-initiating cells, which follows self-environmental alterations, such as hypoxia, nutrient starvation, redox imbalance, and acid environment.9,12 Persistent environmental alterations finally induce metabolic reprogramming that switches normal mitochondrial oxidative phosphorylation to anaerobic metabolism, which is considered as a very important characteristic of cancer. 9 Recently, increased synthesis of fatty acid and cholesterol has emerged as a universal alteration in most cancers. 13 In detail, over-expressions of lipogenic enzymes including ACC and fatty acid synthase (FASN) are found in most human carcinomas14,15 and predict poor prognosis in cancer patients. 16 Based on these initial observations, many candidate genes, involved in cholesterol-related pathways, are proved to be crucial in supporting malignancy.13,17 Cellular homeostasis of fatty acid is marked as the remarkable changes in development and progression of cancer. 18 A study reported that in a high-food-diet-induced prostate cancer rat model, increased expression of intracellular FASN was attenuated by phosphatidylinositol-3-hydroxy kinase (PI3K)/mitogen-activated protein kinase (MAPK) inhibition or AMPK activation. 19 Inversely, FASN inhibition resulted in PI3K/MAPK down-regulation and AMPK activation, which existed a feedback loop between FASN and PI3K/MAPK, whereas AMPK activation was associated with FASN down-regulation and PI3K/MAPK inactivation. 19 In conclusion, the AMPK signaling pathway may work as a negative regulator to the feedback loop of FASN/PI3K/MAPK in a rat model with prostate cancer. Although FASN is the key biosynthetic enzyme in the fatty acid synthesis pathway, ACC catalyzes acetyl-CoA to malonyl-CoA, which acts as the pace-setting enzyme in synthesis of fatty acid. 16 Therefore, activation of ACC is also a characteristic feature of cancer cells. 20 It is well known that AMPK plays an important role in regulating fatty acid synthesis and fatty acid oxidation via its phosphorylation and inactivation of ACC. 21 Combined with our study results, we conclude that low expression of AMPK may up-regulate ACC followed by lipid dysmetabolism, and finally induce carcinogenesis in remnant kidneys of UNX rats.
Similar to AMPK, angiotensin II (Ang II), the main effector of RAS, is also implicated in both lipid dysmetabolism and cancer. Briefly, Ang II can suppress abdominal subcutaneous adipocyte lipolysis. 22 The pathogenic mechanisms of Ang II on cancer are involved in mitogenic effects 23 and expressions of different growth factors contributing to tumor progression, metastasis, and angiogenesis. 24 Since RAS blockade ameliorated all the abnormalities in UNX rats, especially for the inhibition of AMPK signaling pathway, we hypothesize that RAS activation after unilateral operation may trigger carcinogenesis of remnant kidneys through disturbing AMPK signaling pathway.
There is a study which is similar to ours showing that Ang II type 2 receptor (AT2R)-mediated induction of fatty acid synthesis is inhibited by AT2R blockade via activation of AMPK in pancreatic cancer cells. 25 In invasive human pancreatic ductal adenocarcinoma (PDA), AT2R is overexpressed25,26 and plays a negative role on endogenous phosphorylation of AMPK and then ACC inhibition that alters the lipogenesis as a generic characteristic of all cancers. 25 AMPK inactivation dependent on AT2R in PDA cells demonstrates the regulation of RAS on AMPK signaling pathway. The same mechanism may exist in our study explaining the relationship between RAS and AMPK in tubular epithelia carcinoma of UNX rats. At cellular levels, it is well recognized that AMPK is activated by metabolic stress that depletes ATP and increases AMP, 27 but at levels of organism, AMPK activation is under control of hormones and cytokines, such as adiponectin. 25 RAS activation after uninephrectomy likely disturbed metabolic homeostasis of UNX rats,22,28 which in turn down-regulated the AMPK signaling pathway finally leading to carcinogenesis. Further studies on the mechanisms of how RAS inhibits AMPK signaling pathway in carcinogenesis are necessary.
In all, our findings indicate the interaction between renal RAS and AMPK signaling pathway in carcinogenesis of tubular epithelia in the UNX rat model. Therefore, RAS blockade and AMPK activator may be combined to prevent renal cancer resulting from single-kidney. The inhibitory regulation of RAS on AMPK signaling pathway warrants further mechanic researches and clinical investigations.
Footnotes
Acknowledgements
K.-K. Y. and Y. S. contributed equally to this study.
Declaration of conflicting interests
The author(s) declared no potential conflicts of interest with respect to the research, authorship, and/or publication of this article.
Ethical approval
All guidelines for the care and use of animals were followed according to the Animal Experimentation Ethics Committee of the institution in Guilin, China.
Funding
The author(s) disclosed receipt of the following financial support for the research, authorship, and/or publication of this article: This work was supported by the Natural Science Foundation of China (81270934).