
Abstract
Gallbladder cancer has poor prognosis and limited therapeutic options. Arctigenin, a representative dibenzylbutyrolactone lignan, occurs in a variety of plants. However, the molecular mechanisms involved in the antitumor effect of arctigenin on gallbladder cancer have not been fully elucidated. The expression levels of epidermal growth factor receptor were examined in 100 matched pairs of gallbladder cancer tissues. A positive correlation between high epidermal growth factor receptor expression levels and poor prognosis was observed in gallbladder cancer tissues. Pharmacological inhibition or inhibition via RNA interference of epidermal growth factor receptor induced cellular senescence in gallbladder cancer cells. The antitumor effect of arctigenin on gallbladder cancer cells was primarily achieved by inducing cellular senescence. In gallbladder cancer cells treated with arctigenin, the expression level of epidermal growth factor receptor significantly decreased. The analysis of the activity of the kinases downstream of epidermal growth factor receptor revealed that the RAF-MEK-ERK signaling pathway was significantly inhibited. Furthermore, the cellular senescence induced by arctigenin could be reverted by pcDNA–epidermal growth factor receptor. Arctigenin also potently inhibited the growth of tumor xenografts, which was accompanied by the downregulation of epidermal growth factor receptor and induction of senescence. This study demonstrates arctigenin could induce cellular senescence in gallbladder cancer through the modulation of epidermal growth factor receptor pathway. These data identify epidermal growth factor receptor as a key regulator in arctigenin-induced gallbladder cancer senescence.
Introduction
Gallbladder cancer (GBC) is a notoriously fatal cancer with dismal outcome and accounts for approximately 145,203 cases per year worldwide. 1 To date, complete surgical resection offers the only chance for cure. Despite this potential cure, only 10% of the patients who present with early-stage GBC are considered surgical candidates and lymph node metastasis occurs in nearly 50% of patients.2,3 Even for those who undergo complete surgical resection, the loco-regional recurrence rates are high. 4 Moreover, the majority of patients have frequent recurrences following surgery and unsatisfactory outcomes following chemotherapy or radiotherapy.5,6 Effective therapeutic agents based on a better comprehension of cellular and molecular pathogenesis of GBC are required.
Somatic mutations of epidermal growth factor receptor (EGFR) were demonstrated in bile duct carcinoma, and blockade of the EGFR tyrosine kinase (TK) activity reduced the cell proliferation.7,8 Some of these mutations are identical to those previously reported to confer sensitivity to some TK inhibitors like erlotinib and gefitinib in GBC. 9 Gene status and protein expression of EGFR and their pathways may be potential biomarkers for predicting the response to EGFR inhibitors. 10 Preclinical studies suggest that the EGFR, HER2, and their pathways have a crucial role in tumor growth. 11 Previous evidence indicated inhibition of EGFR signaling pathway induced cancer cell proliferation, migration, and cellular senescence.12,13
Arctigenin (ATG), an active ingredient of Fructus arctii, has been reported to exhibit anti-inflammation and antitumor activity in various cancers.14,15 ATG inhibits the growth of various cancer cells including colon cancer, ovarian cancer, hepatocellular carcinoma, gastric cancer, breast cancer, and bladder cancer, by inducing apoptosis16–19 or cell cycle arrest20–23 through iNOS/NO/STAT3/Survivin (inducible nitric oxide synthase/nitric oxide/signal transducer and activator of transcription-3/Survivin) signaling, phosphatidylinositol-3-kinase (PI3K)/AKT signaling, reactive oxygen species (ROS)/p38 MAPK (mitogen-activated protein kinase) pathway, and phosphorylation of Retinoblastoma (Rb). Despite its capacity to inhibit tumor growth, previous studies did not report on the effects of ATG on GBC. The cytotoxicity of ATG in GBC still needs to be elucidated.
Therefore, in this article, we investigated the involvement of EGFR in modulating the senescence induced by ATG in GBC cells. The results highlighted that ATG induced cellular senescence in an EGFR-dependent manner.
Materials and methods
Cell culture and drug treatment
Two human GBC cell lines were used in this study: GBC-SD (Shanghai Cell Bank of Chinese Academy of Sciences, Shanghai, China) and NOZ (Health Science Research Resources Bank, Osaka, Japan). GBC-SD cells were cultured in Dulbecco’s modified Eagle’s medium (Gibco, Gaithersburg, MD, USA), and NOZ cells were maintained in William’s medium E (Lonza, Belgium, WI, USA) at 37°C in a humidified 5% CO2 incubator. Both media were supplemented with 10% fetal bovine serum.
Erlotinib (Sigma-Aldrich, St. Louis, MO, USA) was dissolved by dimethyl sulfoxide (DMSO) and stored at −20°C. Drug was added to cells at final concentrations of 5 µM of Erlotinib. ATG (Sigma-Aldrich) stock was dissolved in DMSO as 20 mM.
Tissue samples
A total of 100 GBC specimens along with adjacent normal tissues were randomly retrieved from GBC patients who underwent radical cholecystectomy (between 2007 and 2009 in Eastern Hepatobiliary Surgery Hospital, Second Military Medical University, Shanghai, China). All GBC patients were retrospectively followed up until September 2013. All patients recruited to this study did not receive any pre-operative treatments. All patients provided written informed consent. Complete clinicopathological follow-up data of the GBC patients from which the specimens were collected were available. This study was approved by the Human Ethics Committee of Xinhua Hospital at Shanghai Jiao Tong University (Shanghai, China) and Eastern Hepatobiliary Surgery Hospital of Second Military Medical University (Shanghai, China).
Ethics statement
All procedures performed in studies involving human participants were in accordance with the ethical standards of the institutional and/or national research committee and with the 1964 Helsinki declaration and its later amendments or comparable ethical standards, and the protocol was approved by the Ethics Committee of Xinhua Hospital affiliated with Shanghai Jiao Tong University and the Eastern Hepatobiliary Surgery Hospital affiliated with the Second Military Medical University.
All procedures performed in studies involving animals were in accordance with the ethical standards of the institution or practice at which the studies were conducted.
Cell viability assay
Cells were trypsinized and plated in 96-well cell culture plates at the concentration of 5 × 10³ cells per well. The medium was removed 24 h later and replaced with fresh medium without or with ATG (0.1, 1.0, 10, 100, 200, 300, and 400 µmol/L) and cultured for 24, 48, or 72 h. Cell viability was measured using a CCK-8 (Cell Counting Kit-8; Dojindo Laboratories, Kumamoto, Japan) following the manufacturer’s instructions. The absorbance of the converted dye was detected at the wavelength of 450 nm, and the absorbance was directly proportional to cell viability.
Analysis of cell cycle and apoptosis by flow cytometry
Cells in apoptosis were detected using an Annexin V-fluorescein isothiocyanate/propidium iodide (FITC/PI apoptosis assay kit, Becton, Dickinson and Company, Franklin Lakes, NJ, USA) following the manufacturer’s protocol. Briefly, the cells were trypsinized, harvested, washed twice with cold phosphate-buffered saline (PBS), and stained with Annexin V-FITC and/or PI for 15 min in the dark. Cell cycle and apoptosis were analyzed with a FACScan flow cytometer (Becton, Dickinson and Company, San Jose, CA, USA).
Measurement of ROS
Cells cultured in 6-well plates were incubated with 10 mM 2′,7′-dichlorofluorescin diacetate (DCFH-DA) for 30 min. Then, cells were washed with PBS, trypsinized, and resuspended in PBS. The intensity of DCF (2′,7′-dichlorofluorescein) fluorescence was immediately measured by flow cytometry (excitation at 488 nm and emission at 530 nm).
Senescence-associated β-galactosidase analysis
Histochemical detection of senescence-associated β-galactosidase (SA-β-gal) was performed with the SA-β-Galactosidase Staining Kit (Cell Signaling Technology, Beverly, MA, USA) according to the manufacturer’s instructions. Briefly, cultured cells were treated with ATG as described above, washed twice with PBS, and fixed with a 3.5% paraformaldehyde solution for 15 min at room temperature. The cells were washed three times in PBS (5 min each wash), transferred to a SA-β-gal staining solution (pH 6.0), and incubated for 16 h at 37°C. The percentage of positively stained cells was determined by counting three random fields of at least 100 cells each.
Western blot analysis
Western blot was performed as previously described. 24 Antibodies to P21, P53, p-b-Raf, p-c-Raf, p-MEK (phosphorylated-MEK), MEK, p-ERK1/2, ERK1/2, p-AKT (phosphorylated-AKT), AKT, and GAPDH (glyceraldehyde-3-phosphate dehydrogenase) were purchased from Cell Signaling Technology, and antibody to EGFR was purchased from Abcam (Cambridge, MA, USA). Briefly, total proteins were extracted, separated in 10% SDS-PAGE (sodium dodecyl sulfate polyacrylamide gel electrophoresis) gels, electrophoretically transferred onto polyvinylidene fluoride (PVDF) membranes, and probed with the corresponding antibodies overnight after blockade using 5% non-fat milk dissolved in Tris-buffered saline with Tween-20 (TBST). The appropriate secondary antibodies coupled to horseradish peroxidase were then applied and a chemiluminescent substrate system was used to detect the signals. The band intensity was analyzed using ChemiDoc XRS+ software (Bio-Rad Laboratories, Hercules, CA, USA).
Fluorescence immunohistochemistry
Cells were fixed in 4% formaldehyde for 4 h, washed in 0.1% Triton X-100 (PBST) for 15 min, and blocked in 5% goat serum for 1 h. Primary antibodies were diluted in blocking solution and incubated overnight at 4°C. Cells were washed and incubated with the secondary antibody (Abcam) for 1.5 h at 37°C and then incubated in the dark with DAPI (4′,6-diamidino-2-phenylindole) (1 µg/mL) in PBS for 5 min. Immunofluorescence was analyzed using fluorescence microscopy (Olympus, Tokyo, Japan).
EGFR-siRNA and EGFR-pcDNA transfection
GBC-SD and NOZ cells were transfected with EGFR small interfering RNA (siRNA) and pcDNA using Lipofectamine™ 2000 (Invitrogen, Carlsbad, CA, USA) according to the manufacturer’s instructions. The transfection complexes were prepared by incubating EGFR-siRNA/pcDNA and transfection reagent for 25 min at room temperature, after which the cells were incubated with the transfection complexes for 6 h and cultured in their corresponding mediums for 72 h. EGFR protein levels were determined by western blot analysis, and cell senescence was examined by the quantitation of the SA-β-gal activity as described above.
Subcutaneous tumor animal models
Approximately 5 × 10⁶ cells were injected subcutaneously (SC) into the left hind limb of 4- to 6-week-old nude mice (Shanghai Laboratory Animal Center of the Chinese Academy of Sciences, Shanghai, China). When tumors were palpable, the mice in the ATG-treated group were intraperitoneally (IP) injected daily with ATG in a clear solution containing 40% polyethylene glycol and 10% ethanol (4 mg/kg), in a volume of 0.2 mL. The control group was treated with an equal volume of vehicle. Tumor size was measured every other day using an external caliper. Tumor volumes (V) were determined by the formula V = a × b2/2, where a is the larger dimension and b is the smaller dimension. The standard size for tumor formation was a diameter of >0.5 cm. Tumor-bearing mice were sacrificed 3 weeks after tumor inoculation and then the tumors were removed and weighed for statistical analysis.
Bromodeoxyuridine feeding and staining
After ATG treatment for 24 h, cultured cells were stained with Bromodeoxyuridine (BrdU; Sigma-Aldrich) according to manufacturer’s instructions. Stained cells were detected using an immunofluorescence staining assay with BrdU antibody (1:200, Abcam) and visualized under a fluorescent microscope (Olympus).
RNA extraction and quantitative real-time polymerase chain reaction
The messenger RNA (mRNA) expression level of EGFR, p21, and p53 was determined by quantitative real-time polymerase chain reaction (qRT-PCR). In brief, the total RNA of cells and tumor tissues was extracted, and complementary DNA (cDNA) was synthesized with PrimeScript RT Master Mix (TaKaRa, Osaka, Japan). qRT-PCR analysis was performed using SYBR Premix Ex Taq (TaKaRa) according to the manufacturer’s instructions. The primer sequences used were:
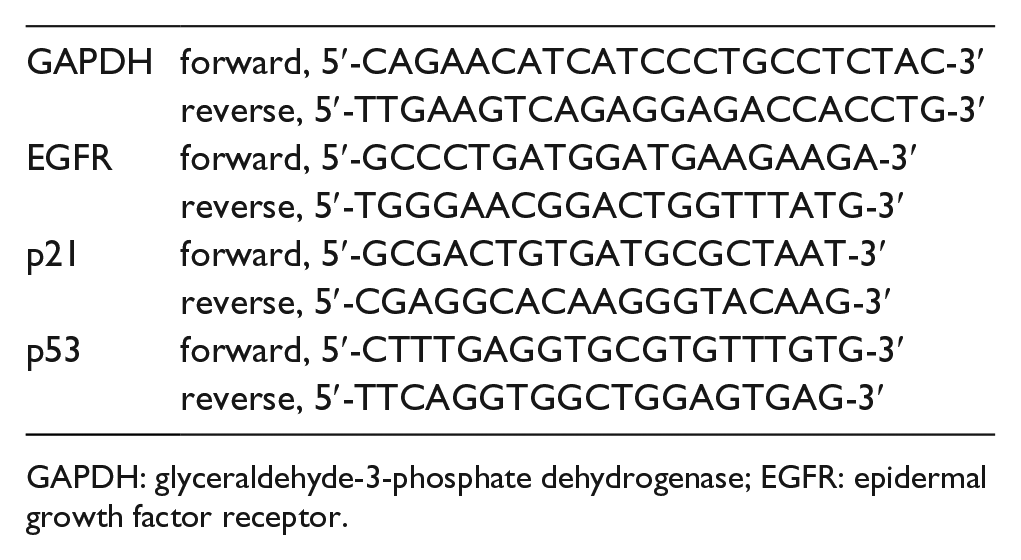
GAPDH: glyceraldehyde-3-phosphate dehydrogenase; EGFR: epidermal growth factor receptor.
Animal models of intraperitoneal dissemination
Cells were co-transfected using the pGL4.13[luc2/SV40] vector (Promega, Madison, WI, USA) and Lipofectamine 2000 (Invitrogen) according to the manufacturer’s instructions. After 24 h of transfection, cells were split 1:6 and plated in the presence of 3 mg/mL (GBC-SD) or 6 mg/mL (NOZ) of geneticin (G418) (Invitrogen) for 2–3 weeks. Colonies were selected by limiting dilution analysis (LDA). The selected clones were expanded and used in animal studies.
Approximately 5 × 10⁶ cells expressing firefly luciferase were injected into the peritoneal cavity of 4- to 6-week-old nude mice. Seven or nine days after cell implantation, engraftment of luciferase-expressing cancer cells was determined by bioluminescent, and green fluorescent protein (GFP) imaging was evaluated using the NightOWL LB 983 in vivo imaging system (Berthold, Bad Wildbad, Germany).Mice with detectable luciferase/GFP expression in the intraperitoneal (IP) cavity were then randomly distributed into different treatment cohorts. ATG treatment started 5–6 days after cell implantation. The mice in the ATG-treated group were IP injected daily with ATG in a clear solution containing 40% polyethylene glycol and 10% ethanol (4 mg/kg), in a volume of 0.2 mL. The control group was treated with an equal volume of vehicle.
Bioluminescence and GFP in vivo imaging
Bioluminescent signals from tumors were detected by the IP administration of D-luciferin substrate (150 mg/kg). After 5 min of substrate injection, mice were anesthetized using isoflurane and imaged 5–10 min after injection of the substrate using the NightOWL LB 983 in vivo imaging system. A luciferin kinetic curve was used to determine the time of peak luciferase expression for each tumor model. Mice labeled with GFP were anesthetized using isoflurane and imaged using the NightOWL LB 983 in vivo imaging system. Data were analyzed on the basis of the radiance (ph/s) emitted from the IP cavity of each animal.
Statistical analysis
Each experiment was conducted in triplicate and three independent experiments were performed. Data were expressed as mean ± standard deviation (SD), and the t-test was applied for comparisons between each two groups. Statistical analyses were conducted using SPSS software version 19.0 (SPSS, Chicago, IL, USA). Values of p less than 0.05 were considered statistically significant. All the experiments were independently repeated at least three times.
Results
EGFR expression and clinicopathologic factors in GBC
The expression level of EGFR was examined using qRT-PCR in 100 pairs of GBC tissues and matched adjacent normal tissues. As illustrated in Figure 1(a), the EGFR was expressed at higher levels in the tumor tissues compared with adjacent normal tissues (p < 0.05, Figure 1(a)), indicating that EGFR was frequently upregulated in GBC. Using the mean expression value of EGFR as a cutoff point (3.282) (Figure 1(a)), we divided the 100 patients with GBC into a high expression group (n = 52) and a low expression group (n = 48). Clinicopathologic factors were analyzed in the high and low expression groups (Table 1). There was no significant correlation between the expression level of EGFR and gender, age, tumor size, hepatitis B virus (HBV) infection, peritoneal adhesion, and local invasion as indicated in Table 1. However, the high EGFR expression group (n = 52) showed a less differentiated histology, positive lymph node metastasis, and higher TNM (tumor, node, metastasis) stage than the low EGFR expression group (n = 48; p < 0.05).

The expression of EGFR is upregulated in gallbladder cancer tissues and prognostic for death. (a) Analysis of EGFR expression level was carried out in gallbladder cancer tissues or adjacent control (n = 100). Total RNA was subjected to real-time quantitative reverse transcription-polymerase chain reaction (qRT-PCR) to analyze the CT values of gallbladder cancer normalized to GAPDH in each sample. The normalized values (ΔCT) from all tissues were then compared with a normal tissue, in each group (ΔΔCT). The results were expressed as Log10 (2−ΔΔCT). Horizontal lines in the box plots represent the medians and the boxes represent the interquartile range. Kaplan–Meier curves for overall survival (b) of the same 100 gallbladder tissues measured in (a).
EGFR expression and clinicopathologic characteristics in gallbladder cancer (GBC).

EGFR: epidermal growth factor receptor; HBV: hepatitis B virus; TNM: tumor, node, metastasis.
Bold signifies P < 0.05.
Kaplan–Meier survival analysis and log-rank tests using patient postoperative survival were conducted to further evaluate the correlation between the expression level of EGFR and the prognosis of patients with GBC. From the Kaplan–Meier survival curve, we observed that the high expression of EGFR is a significant predictor of subsequent death (p = 0.0050, Figure 1(b)). Compared with the low expression group, the median survival time was 6.5 months in the high expression group and 12 months in the high expression group. Therefore, our data suggest that high expression of EGFR might have an important role in GBC progression and development.
Antiproliferative and apoptotic effects of EGFR-siRNA in GBC cell lines
To investigate the function of EGFR in GBC cells, EGFR-siRNA was transfected into GBC-SD and NOZ cells to inhibit the expression of EGFR (Figure 2(a)). Depletion of EGFR by siRNA demonstrated the expected efficiency (Figure 2(a)). CCK-8 assay revealed that the percent of live cells were significantly decreased by the transfection of EGFR-siRNA in GBC-SD cells (Figure 2(b)).

The downregulation of EGFR reduces human gallbladder cancer cell viability, arrests cell cycle in the G1/G0 phase, and induces apoptosis. (a) Gallbladder cancer cells were transfected with siRNA-EGFR or a control siRNA (siCon) for 48 h. The knockdown efficiency of siRNA-EGFR was confirmed by comparison with a control siRNA (siCon). Transfected GBC-SD cells were cultured for further 48 h. Cell viability was determined by Cell Counting Kit-8 (CCK-8) assay. (b) Data were presented as survival fraction as comparison with control group. (c) Transfected GBC-SD cells were cultured for further 48 h, stained with Annexin-V-FITC and PI, and examined with flow cytometry assays (left panels). The percentages of GBC-SD cells in early apoptosis (Annexin V positive/PI-negative) and late apoptosis (Annexin V/PI-double positive) is shown (right panel). (d) Transfected GBC-SD cells were cultured for further 48 h, stained with PI, and examined with flow cytometry assays (left panels). The fractions of GBC-SD cells in each phase of the cell cycle are shown (right panel).
A marked increase in both the early and late stages of apoptosis was observed in GBC-SD cells following depletion of EGFR by siRNA by flow cytometry analysis with Annexin V-FITC/PI staining (Figure 2(c)). These results revealed that EGFR inhibition of cell growth in GBC is correlated with the apoptosis.
Senescence induction of EGFR-siRNA and EGFR inhibitors in GBC cell lines
Cellular senescence is an irreversible cell cycle arrest mediated by exogenous and endogenous stimuli and causes changes in cell morphology and gene expression profiles. 25 To determine whether cell cycle arrest is responsible for EGFR-siRNA-induced decrease in cell viability, flow cytometry was performed, which showed that the percentage of cells in G0/G1 phase significantly increased in both cell lines following depletion of EGFR by siRNA, while cell populations in S phase and G2 phase were simultaneously reduced (Figure 2(d)). These results indicate that the downregulation of EGFR could arrest the cell cycle at G0/G1 phase.
To confirm whether cellular senescence was involved in siRNA-EGFR-induced cell cycle arrest, SA-β-gal activity was measured in the GBC cells with or without ATG treatment (Figure 3(a)). Our findings showed that the knockdown of EGFR in GBC-SD and NOZ cells significantly increased the percentage of senescent cells (Figure 3(a)). The protein and gene expression of p21 and p53 was obviously upregulated which confirmed the senescence was induced by the downregulation of EGFR (Figure 3(b) and (c)). To test whether a reduction in EGFR expression would lead to increased oxidative stress in GBC cells, we measured intracellular ROS following siRNA-mediated knockdown of EGFR. Our data showed that knockdown of EGFR induced ROS generation in GBC-SD and NOZ cells (Figure 3(d)). We also used erlotinib, a well-known inhibitor of EGFR, to confirm that EGFR inhibition can trigger senescence in GBC cells. We observed that almost 40% of GBC-SD cells and more than 60% of NOZ cells were stained with SA-β-gal after the administration of erlotinib, indicating that EGFR inhibition by erlotinib similarly induced cell senescence in GBC cells (Figure 3(e)).

The downregulation of EGFR mediates the induction of senescence in GBC cells. (a) Transfected GBC-SD and NOZ cells were cultured for further 48 h, and senescence was examined by β-galactosidase staining (left panel). Quantitative analysis of SA-β-gal-positive GBC cells is shown (right panel). The expression levels of p21 and p53 were detected in transfected GBC-SD and NOZ cells by (b) western blot and (c) qRT-PCR. GAPDH was used as a loading control. (d) Transfected GBC-SD and NOZ cells were cultured for further 48 h, and ROS levels were then measured by flow cytometry. (e) GBC-SD and NOZ cells were treated with EGFR inhibitor erlotinib (at final concentrations of 5 µM) for 48 h, and senescence was examined by β-galactosidase staining (left panel). Quantitative analysis of SA-β-gal-positive GBC cells is shown (right panel).
ATG potently inhibits the proliferation and induces apoptosis of GBC cells
To investigate the antitumor effect of ATG on GBC cells, we treated both GBC cell lines continuously with different concentrations of ATG (0.1, 1, 10, 100, 200, 300, and 400 µmol/L) for 72 h (Figure 4(a)) and examined their proliferation. The proliferation of GBC-SD and NOZ cells was markedly inhibited by ATG in a time- and dose-dependent manner (Figure 4(a)). CCK-8 assay indicated that GBC cell proliferation was significantly promoted by ATG at lower concentrations (<100 µmol/L) but was then gradually decreased at the higher concentrations over 100 µmol/L (Figure 4(a)). We then used 100 µmol/L as the cutoff concentration for further investigation.

ATG inhibits cell proliferation and induces cell cycle arrest and apoptosis in GBC cells. (a) Cells were treated with the indicated concentrations of ATG for 24, 48, and 72 h, and cell viability was determined by CCK-8. (b) GBC-SD and NOZ cells were treated with ATG (100 µmol/L) for 24 or 48 h, and apoptosis was determined by flow cytometry using Annexin V/PI double staining (left panel). Quantitative analysis of early apoptosis (Annexin V-positive/PI-negative) and late apoptosis (Annexin V/PI-double positive) in GBC-SD and NOZ cells is shown (right panel). (c) GBC-SD and NOZ cells were treated with ATG (100 µmol/L) for 24 or 48 h, stained with PI, and examined with flow cytometry assays (left panel). Quantitative analysis of cell distribution is shown (right panel).
To determine whether ATG could induce apoptosis in GBC, GBC cells were double-stained with Annexin V and PI and then analyzed by flow cytometry. The proportions of early- and late-stage apoptotic cells significantly increased in a time-dependent manner, suggesting an increase in the number of necrotic cells (Figure 4(b)).
ATG induces cellular senescence in GBC cells
We also evaluated whether ATG was responsible for cellular senescence in GBC cells. Flow cytometric analysis of the cell cycle distribution indicated that the ATG-treated GBC cells were primarily arrested in the G1/G0 phase (Figure 4(c)). SA-β-gal staining revealed that ATG treatment significantly increased the percentage of SA-β-gal-positive cells, starting at 24 h after treatment with ATG (Figure 5(a)). Apparently, cellular senescence occurs before cell apoptosis in ATG-treated cells, which is consistent with the cell cycle distribution analysis.

ATG induces cellular senescence in GBC cells. (a) Cellular senescence was examined by SA-β-gal staining in GBC cells treated without or with ATG (100 µmol/L) for 24 or 48 h (left panel). Quantitative analysis of SA-β-gal-positive GBC-SD and NOZ cells is shown (right panel). (b) ROS levels were then measured by flow cytometry. The expression levels of p21 and p53 in GBC-SD and NOZ cells after ATG treatment were analyzed by (c) western blot and (d) qRT-PCR. Relative proteins (c) (right panel) and mRNA expression (d) levels of p21 and p53 are shown.
To investigate whether ATG promotes ROS production in the GBC cells, the intracellular ROS levels were measured by flow cytometry using the DCFH-DA fluorescent probe. Our data showed that intracellular ROS levels were higher in ATG-treated GBC cells than in control cells (Figure 5(b)), which supports the involvement of ROS in senescence induction in ATG-treated cells.
Furthermore, western blot and qRT-PCR analyses showed a significant increase in the expression of p21 and p53 in the ATG-treated group compared with the control group (Figure 5(c) and (d)).
Therefore, these findings suggest that the induction of cellular senescence may be a major mechanism by which ATG presents its antitumor effect.
ATG induces cellular senescence in GBC in vivo
To confirm the in vitro findings, we first established a subcutaneous tumor mouse model (Figure 6(a)). When tumors were palpable, ATG was IP injected daily. The tumor volume and weight gradually decreased along the period of ATG administration (Figure 6(a)). The evaluation of BrdU staining in subcutaneous mouse tumors showed a lower percentage of BrdU-positive cells in the ATG-treated tumor tissues compared with those in the control group, indicating that the proliferation of GBC cells was greatly inhibited in the ATG-treated mice (Figure 6(b)). In addition, the gene expression of p21 and p53 significantly increased in ATG-treated subcutaneous mouse tumors (Figure 6(c)).

ATG inhibits cell proliferation and induces cellular senescence in vivo. (a) Mice bearing GBC-SD and NOZ subcutaneous tumor models were injected ATG IP daily (4 mg/kg), in a volume of 0.2 mL. The control group was treated with an equal volume of vehicle (n = 6 for each group). The right panel shows the volume and weight of the tumors. (b) BrdU-positive cells measured by immunofluorescence in subcutaneous tumor tissues (×200) (left panel). Quantitative analysis of the percentage of BrdU-positive cells is shown (right panel). (c) The mRNA levels of p21, p53, and EGFR in subcutaneous tumor tissues was analyzed by qRT-PCR. (d) Nude mice engrafted with intraperitoneal GBC-luc tumors were injected ATG IP daily (4 mg/kg), in a volume of 0.2 mL. The control group was treated with an equal volume of vehicle (n = 6 for each group). The radiance of GBC-SD and NOZ cells in the peritoneal area of mice is shown (right panel).
Consistent with the results of the subcutaneous tumor models, we observed a reduction in the radiance of tumor xenografts in the ATG-treated mice 35 days after cell engraftment (Figure 6(d)).
Overall, these results indicate the antitumor effect and cellular senescence induced by ATG in GBC cells in vivo.
Effect of EGFR and EGFR pathways in ATG-induced cellular senescence in GBC
We next tested whether EGFR pathways are altered in GBC cells treated with ATG. Immunofluorescence staining (Figure 7(a)) and western blot (Figure 7(b)) showed that the EGFR protein level significantly decreased in the ATG-treated group compared with the control group. Moreover, we observed a significant reduction in the level of the phosphorylated form of Raf (c-Raf and b-Raf), MEK, and ERK (Figure 7(b)).

ATG inhibits the EGFR-MEK-ERK signaling pathway. GBC-SD and NOZ cells were treated with ATG (100 µmol/L) for 48 h. (a) The expression of EGFR was analyzed by immunofluorescent (×200). (b) Western blot analysis was performed to detect the expression levels of EGFR, p-c-Raf, p-b-Raf, p-MEK, MEK, ERK, p-AKT, and AKT in GBC-SD and NOZ cells after ATG treatment (left panel). Relative expression levels of proteins EGFR, p-c-Raf, p-b-Raf, p-MEK, MEK, ERK, p-AKT, AKT are shown (right panel).
The in vivo assay showed that the gene expression of EGFR was remarkably diminished by ATG treatment in ATG-treated subcutaneous mouse tumors (Figure 6(c)).
This result indicated that, in addition to the declined level of EGFR, the RAF-MEK-ERK pathways were significantly downregulated in ATG-treated GBC cells. However, the PI3K-AKT pathway was unaffected (Figure 7(b)).
The inhibition of EGFR is responsible for the induction of cellular senescence in GBC
Given that the expression of EGFR was downregulated after ATG treatment, we wondered whether EGFR is responsible for the ATG-mediated cellular senescence in GBC cells. Hence, we examined the effect of ATG on cellular senescence with the overexpression of EGFR. The overexpression of EGFR by a pcDNA plasmid demonstrated the expected efficiency (Figure 8(a)). ATG-induced cellular senescence was significantly reversed in GBC cells by the inhibition of p21 and p53 after EGFR-pcDNA treatment (Figure 8(b)). Overexpression of EGFR can also rescue the downregulation of RAF-MEK-ERK pathway by ATG.

The EGFR-MEK-ERK signaling pathway mediates the induction of senescence in ATG-treated GBC cells. (a) The efficiency of pcDNA-EGFR was confirmed by comparison with a pcDNA. (b) qRT-PCR analysis of the mRNA levels of p21 (left panel) and p53 (right panel) in GBC-SD and NOZ cells after transfection of pcDNA-EGFR with ATG treatment is shown. (c) Western blot analysis was performed to detect the expression levels of EGFR, Raf, p-MEK, MEK, ERK, p-AKT, and AKT in GBC-SD cells after transfection of pcDNA-EGFR with ATG treatment. (e) Schematic representation of the potential involvement of the EGFR-MEK-ERK signaling pathway in senescence of ATG-treated GBC cells.
Collectively, these findings suggest that ATG-induced GBC cellular senescence was mediated by the inhibition or downregulation of EGFR.
Discussion
The increase in the global incidence of GBC, its poor prognosis, and lack of effective therapy underscore the need for effective therapeutic agents.26,27 In this study, we clarified a molecular mechanism involved in the induction of GBC senescence by ATG. We found that the downregulation of EGFR pathways contributed to the ATG-induced cellular senescence, and this result was confirmed by our findings that the pharmacological inhibition or knockdown of EGFR similarly induced cellular senescence in GBC cells.
EGFR overexpression has been implicated in GBC progression8,28,29 and has been studied as a therapeutic target. It has been reported that EGFR gene is one of the most extensively mutated genes in GBC 30 and that the mutations led to activation of one or both of the EGFR signal transduction pathways. We observed the higher expression of EGFR in human GBC tissues compared to adjacent normal tissues and the correlation between the high expression level of EGFR and a less differentiated histology, positive lymph node metastasis, and higher TNM stage. The inhibition or downregulation of EGFR by erlotinib or siRNA, respectively, induced the cellular senescence in GBC cells. Previous evidence indicated EGFR-MEK-ERK signaling pathway was inhibited in Berberine-induced senescence in human glioblastoma cells. 12 Several phase II trials have investigated the role of TK inhibitors like erlotinib in the management of advanced GBC.31–33 Randomized phase III study has assessed the efficacy of the addition of erlotinib to gemcitabine and oxaliplatin as first-line therapy for metastatic GBC. 9 Promising characteristics of EGFR as a molecular target for cancer therapy have inspired the development of targeted inhibitors against EGFR and its signaling components.
Previous studies have reported that ATG suppresses the proliferation of cancer cells by arresting the cell cycle in the G0/G1 phase 23 or G2/M phase. 34 However, few studies have evaluated the mechanisms of antitumor effect induced by ATG, except for the studies on the downregulation of antiapoptotic proteins by ATG17,21 and the inhibition of the STAT3 signaling pathway 15 to enhance the chemosensitivity of tumor cells. Although ATG has been proven to block cell cycle arrest and mediate cell apoptosis in many types of carcinoma, previous studies did not report on the effects of ATG on GBC. Our study found that ATG could reduce cell viability of GBC cell lines by inducing apoptosis. However, another significant mechanism discovered in our study was that ATG played a cancer-killing activity by inducing cellular senescence. We found that ATG could induce cell senescence in a time-dependent manner in GBC cell lines, which was corroborated by SA-β-gal analysis. The expression of senescence-related genes p21 and p53 also increased in these cell lines after ATG treatment compared with the control group, which further corroborates our hypothesis. Cellular senescence has recently been recognized to be an important therapeutic strategy in various types of cancer.35–37 The implementation of pro-senescence strategies is therefore an attractive alternative in cancer research in terms of its chemopreventive and therapeutic potential.38,39
Considering the function of ATG in the induction of cell senescence, a better comprehension of the underlying mechanisms is required. Preclinical studies suggested that the EGFR, HER2, and their pathways have crucial roles in tumor growth. 11 A recent study has also reported that EGFR inhibition enhanced the antitumor effect of gemcitabine in biliary tract and gallbladder carcinomas, indicating the potential therapeutic targeting of EGFR in GBC. 40 These results indicate the usefulness of EGFR targeting as an adjuvant therapy in GBC. We found that EGFR expression significantly decreased after ATG treatment, followed by the inhibition of the signaling pathway downstream of EGFR, RAF-MEK-ERK, which in return upregulated the expression of p21 and p53 and triggered cell senescence. Furthermore, the inhibition or downregulation of EGFR by erlotinib or siRNA, respectively, mimicked the effect of ATG treatment in GBC cells. Recent studies have shown that the sequential activation of ERK and p38 MAPK pathways promoted oncogene-induced senescence (OIS) via Ras. 41 Our findings demonstrated that the inhibition of EGFR and the downstream Raf-MEK-ERK pathway could also induce cell senescence, which suggest that the EGFR-Raf-MEK-ERK pathways may be involved in GBC cell senescence (Figure 8(d)). The PI3K/AKT signaling pathway, initiated by EGFR, mediates cell senescence under the circumstance of loss of phosphatase and tensin homolog (PTEN). 42 This pathway has also been reported to be partly involved in ATG stimulation. 43 However, there were no significant changes in the expression of AKT in our study after ATG treatment. Therefore, the PI3K/AKT signaling pathway may not participate in GBC cell senescence induced by ATG.
In conclusion, our results elucidated the potent antitumor effect of ATG on GBC cells partly by causing cellular senescence. We also confirmed that the inhibition of EGFR pathways might be involved in the induction of cellular senescence by ATG. The employment of targeted therapies may be useful in GBC treatment, and the analysis of EGFR/HER2 pathways in patients could orientate clinicians to the identification of appropriate therapeutic approach.
Footnotes
Acknowledgements
M.Z., S.C., and B.Z. are equal contributors.
Compliance with ethical standards
All procedures performed in studies involving human participants were in accordance with the ethical standards of the institutional and/or national research committee and with the 1964 Helsinki declaration and its later amendments or comparable ethical standards.
Declaration of conflicting interests
The author(s) declared no potential conflicts of interest with respect to the research, authorship, and/or publication of this article
Ethical approval
All applicable international, national, and/or institutional guidelines for the care and use of animals were followed.
Funding
The author(s) disclosed receipt of the following financial support for the research, authorship, and/or publication of this article: This work was supported by the Xinhua hospital scientific research fund project (No. 15YJ01) and the National Natural Science Foundation of Youth Science Foundation of China (No. 81602549) to M.Z., National Natural Science Foundation of Youth Science Foundation of China (No. 81501914) to B.Z., and National Natural Science Foundation of China (Nos 81272747 and 81572297) to Z.Q.
Informed consent
Informed consent was obtained from all individual participants included in the study.