
Abstract
This study aimed to investigate the effect of SOCS1 silencing on the proliferation and apoptosis of melanoma cells by in vivo and in vitro studies. Immunohistochemical staining was used to detect SOCS1 expression in melanoma tissues and pigmented nevi. Quantitative real-time polymerase chain reaction and western blotting were applied to detect the messenger RNA and protein expressions of SOCS1 in primary human melanocytes and malignant melanoma cell lines (A375, SK-MEL-5, M14, and MV3). Melanoma cells were assigned into mock, negative small interfering RNA, and SOCS1-small interfering RNA groups. The proliferation, cell cycle and apoptosis, and messenger RNA expression of SOCS1 in MV3 and A375 cells were detected using MTT assay, flow cytometry, and quantitative real-time polymerase chain reaction, respectively. The expressions of SOCS1 protein, extracellular signal–regulated kinase, and janus kinase signal transduction and activators of transcription signaling pathways–related proteins were detected using western blotting. After the establishment of subcutaneous xenograft tumor models in nude mice, the latent period, size, volume and growth speed of xenograft tumors in the mock, negative small interfering RNA, and SOCS1-small interfering RNA groups were examined and compared. The results indicated that positive expression rate of SOCS1 was higher in malignant melanoma tissues than in pigmented nevi. MV3 cells had the highest messenger RNA and protein expressions of SOCS1, followed by A357 cells. Compared with the mock and negative small interfering RNA groups, SOCS1-small interfering RNA group showed lower cell viability, elevated cell apoptosis, more cells in G0/G1 phase and less cells in S and G2/M phases, and decreased messenger RNA and protein expressions of SOCS1, p-ERK1/2, p-JAK2, p-STAT1, and p-STAT3. Compared with the mock and negative small interfering RNA groups, the SOCS1-small interfering RNA group showed longer latent period of tumor, smaller tumor size and volume, and smoother tumor growth curve. To conclude, SOCS1 silencing can inhibit proliferation and induce apoptosis of MV3 and A357 melanoma cells in vivo and in vitro by inhibiting extracellular signal–regulated kinase and janus kinase signal transduction and activators of transcription signaling pathways.
Introduction
Melanoma, a malignant tumor derived from melanocytes, is the most aggressive and mortal form of skin cancer.1,2 The incidence of melanoma is 1/10 of other cutaneous tumors, but it is known as a deadly tumor disease due to a high metastatic potential. 3 It is reported that brain metastasis occurs in 40%–60% of patients with advanced melanoma and thus resulting in death. 4 The 5-year survival rate is 95%–99% for patients with primary cutaneous melanoma, whereas the rate is decreased to 30%–40% when it metastasizes to the lymph nodes. 5 Genetic, environmental and individual host factors have been identified as the major factors responsible for melanoma occurrence, including a family history of melanoma, skin color, the existence of common nevi and atypical nevi, and the exposure to ultraviolet (UV) radiation. 6 Despite the advanced knowledge about the risk factors, the pathogenesis of melanoma has not been thoroughly studied yet. 7 Previous studies have shown that normal human melanocytes (HEMa) can transform into melanoma cells when a specific signaling pathway is over-activated or inhibited by regulating various cellular activities, such as proliferation, apoptosis, invasion, or angiogenesis.8,9 Therefore, investigating genes that affect the apoptosis and proliferation of melanoma cells is beneficial for the prevention and treatment of melanoma.
Suppressers of cytokine signaling (SOCS) family, the negative regulator of cytokine signal transduction, is composed of eight structurally similar proteins, namely, SOCS-1 to SOCS-7 and CIS (cytokine-inducible SH2-containing protein). 10 Cytokine-induced SOCS proteins act as the mediator that directly regulate the activity of interferons (IFNs) in melanoma cells, and SOCS1 protein expression was observed in melanoma cell lines in various phases of disease and in melanocytes. 11 Janus kinase signal transduction and activators of transcription (JAK/STAT) is the signal pathway involved in cell proliferation, differentiation, and apoptosis.12,13 Extracellular signal–regulated kinase (ERK) is an enzyme regulating cell survival, growth, and proliferation by promoting proline-induced protein phosphorylation, a crucial process that controlling cell proliferation and transformation. 14 SOCS1, a key inhibitory molecule of JAK/STAT and ERK signaling, can inhibit cell proliferation by blocking cell cycle progression, promoting cell apoptosis, inducing tumor cell transformation, or facilitating tumor cell invasion and metastasis when it is expressed aberrantly in cells.13,15–18 As SOCS1 is expressed in vitro and in situ in human melanoma cells, 4 it is suspected that SOCS1 silencing affects the proliferation and apoptosis of melanoma cells. This study aims to investigate the effect of SOCS1 silencing on the proliferation and apoptosis of malignant melanoma cells in vivo and in vitro, and provide a novel understanding of the pathogenesis of malignant melanoma.
Materials and methods
Ethics statement
This study was approved by the Ethics Committee of Fudan University Shanghai Cancer Center, and written informed consents were obtained from all patients.
Specimen collection
A total of 85 melanoma tissues that clinically and pathologically diagnosed were obtained from patients treated in Fudan University Shanghai Cancer Center from June 2012 to June 2015, composed of 44 males and 41 females, with an average age of 51.6 ± 6.45 years. And 62 pigmented nevi that clinically and pathologically diagnosed were obtained from patients in Fudan University Shanghai Cancer Center from June 2012 to June 2015, composed of 33 males and 29 females, with an average age of 49.8 ± 5.23 years.
Immunohistochemical staining
Specimens were fixed in formaldehyde for 24 h, embedded with paraffin, and sectioned into 4 µm serial sections. Next, the sections were conventionally deparaffinized to water, treated with antigen-retrieval solution (DAKO) in a microwave oven for 15 min, quenched with 3% hydrogen peroxide for 5 min to inhibit endogenous peroxidase activity, and blocked by 5% bovine serum for 10 min. Subsequently, the sections were incubated with primary rabbit anti-human SOCS1 polyclonal antibody (1:100; Abcam, Cambridge, MA, USA) at 4°C overnight, reacted with biotin-labeled secondary antibody for 30 min at room temperature, and were stained with diaminobenzidine (DAB), counterstained with hematoxylin, and mounted by neutral balsam. Five fields were randomly selected in each section, in which 100 cells were counted. The expression rate was a ratio of SOCS1-positive cell number to the 100 counted cells. Cells were regarded as prominently expressed if the expression rate was more than 10%.
Cell culture and treatment
Primary HEMa and malignant melanoma cell lines (A375, SK-MEL-5, M14, and MV3) were obtained from the laboratory of Fudan University Shanghai Cancer Center. Dislodged from liquid nitrogen quickly, the cryogenic vials were wiped with 70% ethanol, and cell lines were dissolved at 50°C. In a laminar flow cabinet, cell suspension was transferred to a culture flask and cultured in a 37°C incubator (Heraeus, Kulzer, Germany) with 5% CO2 and saturated humidity, with the addition of 3 mL Dulbecco’s Modified Eagle Medium (DMEM) containing 10% fetal bovine serum (FBS). The HEMa cells were cultured in serum-free M254 medium supplied with human melanocyte growth supplement (HMGS). The culture solution was replaced the next day, after which the solution was changed every 3 days. When the cultured cells reached 80% confluence, they were digested by 2 mL of 0.25% pancreatin and passaged at a ratio of 1:4. Cells in the logarithmic phase were digested by 0.25% pancreatin (2 mL), with the culture solution discarded. The digestion was terminated by adding 5 mL of medium when cells were retracted and turned round shape and observed under an inverted microscope. The cell suspension was triturated for single-cell suspension, followed by centrifugation, supernatant removal, and washing with 0.5 mL of phosphate buffered saline (PBS) for three times. The number of cells was calculated in a cell-counting chamber and cell concentration was adjusted as required.
Construction of recombined lentiviral vector
The human SOCS1 sequence was obtained from GeneBank to design the sequences of SOCS1-small interfering RNA (siRNA) (5′-CACGCACTTCCGCACATTC-3′) and negative oligonucleotide (5′-TTCTCCGAACGTGTCACGT-3′). Cleavage sites of restriction endonuclease BamHI and XhoI were synthesized in vitro by Gemma Pharmaceutical Technology Co., Ltd. (Shanghai, China). The phosphorylated 5′-terminus of oligonucleotide was annealed to double-stranded DNA fragments containing cleavage sites of restriction endonuclease BamHI and XhoI. The DNA fragments were cloned into lentiviral vector pRNA-Lenti-EGFP to construct SOCS1-short hairpin RNA (shRNA) recombinant expression vectors, including pRNA-Lenti-SOCS1-EGFP (SOCS1-siRNA) and pRNA-Lenti-negative-EGF (negative-siRNA). Escherichia coli DH5a was transfected and screened using ampicillin to select single colonies for expanded culture, followed by restriction enzyme digestion, polymerase chain reaction (PCR), and sequence analysis. The 293T cells in the logarithmic phase were digested by pancreatin, adjusted to a concentration of 105 cells/mL, and inoculated to a 96-well plate (100 µL/well). A mixture of pRNA-Lenti-SOCS1-EGFP and lentivirus was used to transfect 293T cells. After 24 h of transfection, the SOCS1-siRNA and negative-siRNA recombinant plasmids were collected, diluted in the proportion of 10−4, 10−5, 10−6, 10−7, and 10−8, and inoculated with 293T cells. Each group had three wells. The cells were cultured in a 37°C incubator with 5% CO2 for 18 h, and were counted under an inverted fluorescence microscope (Nikon, Tokyo, Japan) to calculate the virus titer. Virus titer (pfu/mL) = (10 × average number of fluorescent cells) / degree of dilution.
Cell transfection
MV3 and A375 melanoma cells were inoculated into 24-well plates at a density of 2.5 × 10⁵ cells/well, and cultured in the 37°C incubator with 5% CO2. When the cells reached 80% confluence, MV3 and A357 melanoma cells were transfected by lentivirus. MV3 and A375 melanoma cells in the logarithmic phase were assigned into control group (mock group), treated with 0.1 mol/L PBS; negative control group (negative-siRNA group), transfected by negative-siRNA lentivirus; and SOCS1-siRNA group, transfected by SOCS1-siRNA lentivirus.
Quantitative real-time polymerase chain reaction
In each group, 1 × 10⁶ cells in the logarithmic phase were obtained, total RNA was extracted with TRIzol kit (Invitrogen, Carlsbad, CA, USA) and was then reversely transcribed into complementary DNA (cDNA). By using cDNA as the template, quantitative real-time polymerase chain reaction (qRT-PCR) was performed with Takara PCR kit (Takara Holdings Inc., Kyoto, Japan) with three wells in each group. The primer sequences are displayed in Table 1. The 20-µL reaction system was as follows: 10 µL of SYBR Premix ExTaq™ (2×), 0.4 µL of PCR Forward Primer (10 µmol/L), 0.4 µL of PCR Reverse Primer (10 µmol/L), 0.4 µL of ROX Reference Dye II (50×), 2.0 µL of cDNA templates, and 6.8 µL dH2O. LightCycler480 was used for PCR reaction. The reaction conditions were as follows: initial denaturation at 95°C for 30 s, denaturation at 95°C for 5 s, and annealing at 60°C for 20 s, 40 cycles in total. The dissolution curve analysis was conducted at 95°C for 15 s, 60°C for 60 s, and 95°C for 15 s, respectively. The messenger RNA (mRNA) expression of each gene was normalized to glyceraldehyde-3-phosphate dehydrogenase (GAPDH).
The primer sequences of SOCS1 and GAPDH for qRT-PCR.

GAPDH: glyceraldehyde-3-phosphate dehydrogenase; qRT-PCR: quantitative real-time polymerase chain reaction; F: Forward; R: Reverse.
Western blotting
In each group, a total of 1 × 10⁶ cells in the logarithmic phase were collected, washed two to three times with PBS, and denatured at 95°C for 10 min with the addition of sodium dodecyl sulfate–polyacrylamide gel electrophoresis (SDS-PAGE) loading buffer (1 × 10⁷/mL). Next, protein samples were analyzed by standard western blotting procedures using nitrocellulose. The membrane was blocked with 5% skimmed milk for 1 h and incubated with primary antibodies, including SOCS-1, p-ERK 1/2, p-JAK2, p-STAT1, p-STAT3, ERK 1/2, JAK2, STAT1, STAT3, and GAPDH (Cell Signaling Technology (CST), Beverly, MA, USA), at 37°C for 1 h. The membrane was then washed with Tris-buffered saline-Tween (TBST) (10 Mm Tris, pH 7.5 HCl, 100 Mm NaCl, and 1g/L Tween 20) for four times, incubated with horseradish peroxidase (HRP)-labeled secondary antibody (goat anti-Rabbit IgG) for 2 h, and washed with TBST for four times. Electrochemiluminescence (ECL) was used for developing, and gel imaging system (Bio-Rad Laboratories, Inc., Hercules, CA, USA) was applied for photographing, and strip recovery could be analyzed.
MTT assay
After the transfection of MV3 and A357 melanoma cells, 1 × 10⁴ cells in each group were inoculated into 96-well plates and cultivated in a 37°C incubator with 5% CO2 for 24 h, 48 h, 72 h, and 96 h, respectively. Then 10 µL of 5 mg/mL MTT solution (Sigma-Aldrich Chemical Company, St. Louis, MO, USA) was added to each well and incubated for 4 h in the incubator. Next, 10% sodium dodecyl sulfate–hydrochloric acid (SDS-HCl) was added (100 µL/well) to terminate the reaction, and plates were shaken slightly. The optical density (OD) value was read at 570 nm using Thermo Scientific Microplate Reader (Bio-Rad Laboratories). The growth curve, with culture time (h) as the abscissa and OD value as the ordinate, was drawn to calculate the inhibition rate of cell growth. The inhibition rate = [(OD control − OD experiment) / OD control] × 100%.
Flow cytometry
Cell cycle was detected at 48 h after MV3 and A357 melanoma cell transfection in the following way: cells in the logarithmic phase in each group were digested with pancreatin, washed once with PBS, centrifuged at 2000 r/min for 5 min, collected, and adjusted to 1 × 10⁶ cells/mL in concentration; next, the obtained single-cell suspension was fixed in 70% ethanol overnight, stored at 4°C, heated in water for 30 min with 100 µL RNase A (Takara Biotechnology Co., Ltd., Dalian, China) added, stained by 400 µL of propidium iodide (PI) (Takara Biotechnology Co.), and maintained in the dark condition for 30 min at 4°C; finally, a flow cytometry (Beckman Coulter Inc., Chaska, MN, USA) was used to detect cell cycle. A total of 106 cells were collected in each group, and cultured at the 37°C incubator with 5% CO2 for 48 h, followed by centrifugation at 2000 r/min for 5 min and then collection. Slightly shaken with 1 mL of PBS, the cells were recollected, and supernatant was discarded. The process was repeated once. Binding buffer (1×) was used to adjust the cell density into 1 × 10⁶ cells/mL, and 100 µL of cells were transferred into a flow tube and mixed evenly with 10 µL Annexin-V-PE obtained from the apoptosis detection kit (Southern Biotechnology Associates, Inc., Birmingham, AL, USA) and stored on ice. After reacting in dark condition for 15 min, 380 µL of 1 × binding buffer and 10 µL of 7-AAD were added. Epics-XL II flow cytometry (Beckman Coulter Inc.) was used for the detection of cell apoptosis, and CellQuest software was applied to collect 10,000 cells to calculate the number of apoptotic cells.
Establishment of subcutaneous xenograft tumor models in nude mice
Eighteen female BALB/c specific-pathogen free (SPF) nude mice were obtained from Shanghai SLAC Laboratory Animal Co., Ltd. (Shanghai, China) (license number: SCXK (Shanghai) 2007-0005), with 3–4 weeks old and weighing 18–20 g. The mice had free access to enough food and water, and were randomly divided into mock group, negative-siRNA group, and SOCS1-siRNA group. The cells in the logarithmic phase in the mock, negative-siRNA, and SOCS1-siRNA groups were digested using 0.25% pancreatin and then collected for counting. The cell concentration was adjusted to 1 × 10⁷ cells/mL, and 0.1 mL cell suspension was subcutaneously inoculated to the right armpit of nude mice in three groups. The tumor growth and general conditions of mice were observed every day; the width (W) and length (L) of tumors were measured every 3 days. Tumor volume (V) = 0.5 × W2 × L. The growth curve was made based on the three indexes (W, V, and L) mentioned above. A tumor was regarded as successfully formed if the maximum diameter of subcutaneous nodule of tumor was ⩾5 mm. The tumor formation rate was calculated. After 4 weeks of inoculation, the nude mice were executed by breaking the cervical vertebra, and tumors were separated and examined. Tumor tissues were fixed with 95% ethanol, embedded with paraffin, stained with hematoxylin and eosin (HE), and finally observed under optical microscope.
Statistical analysis
All statistical analyses were performed using SPSS 19.0 software (SPSS Inc., Chicago, IL, USA). Measurement data were displayed as mean ± standard deviation (SD). One-way analysis of variance (ANOVA) was applied to analyze differences among multiple groups, and t-test was used to analyze differences between two groups. The p value <0.05 was considered as statistically significant.
Results
SOCS1 expression in malignant melanoma tissues and pigmented nevi
As Figure 1 displayed, positive expression (67.06%) of SOCS1 was seen in the cytoplasm of malignant melanoma tissues; while in the pigmented nevi tissues, the expression of SOCS1 was only 24.19%. The results showed that positive expression rate of SOCS1 was significantly higher in malignant melanoma tissues than in pigmented nevi (p < 0.05).

SOCS1 expression in melanoma tissues and pigmented nevi. (a) SOCS1 expression in melanoma tissues and pigmented nevi was detected by immunohistochemistry; (b) comparison of the positive expression rate of SOCS1 between melanoma tissues and pigmented nevi.
Comparison of SOCS1 expression between primary HEMa and malignant melanoma cells
qRT-PCR and western blotting were applied to detect the mRNA and protein expressions of SOCS1 in primary HEMa and malignant melanoma cell lines (A375, SK-MEL-5, M14, and MV3). Compared with HEMa cell line, the mRNA and protein expressions of SOCS1 in A375, SK-MEL-5, M14, and MV3 cell lines were elevated significantly (p < 0.05). In addition, the results showed that MV3 melanoma cells had the highest mRNA and protein expressions of SOCS1, followed by A375 melanoma cells. Therefore, MV3 and A375 melanoma cells were used in following experiments (Figure 2).

The mRNA and protein expressions of SOCS1 in primary human melanocytes and malignant melanoma cells. (a) The relative expression of SOCS1 mRNA in primary human melanocytes and malignant melanoma cells; (b) the relative expression of SOCS1 protein in primary human melanocytes and malignant melanoma cells; each experiment was conducted in triplicate to obtain the mean value, and the result was expressed as
Effect of SOCS1 silencing on the proliferation of MV3 and A357 melanoma cells
MTT assay was performed to determine the viability of MV3 and A375 melanoma cells at 24, 48, 72, and 96 h after transfection, based on which the growth curves of cells were made. It demonstrated that there was no significant difference in the proliferation of MV3 and A375 melanoma cells among the mock, negative-siRNA, and SOCS1-siRNA groups at 24 h (p > 0.05). Compared with the mock and negative-siRNA groups, the proliferation of MV3 and A375 melanoma cells in the SOCS1-siRNA group was significantly inhibited from 48 h after transfection, and the inhibitory effect was time-dependent (p < 0.05). No significant difference was found in the proliferation of MV3 and A375 melanoma cells between the mock group and the negative-siRNA group at any time point (p > 0.05) (Figure 3).

Effect of silencing SOCS1 on the proliferation of (a) MV3 and (b) A357 melanoma cells in the mock, negative-siRNA, and SOCSI-siRNA groups was detected by MTT assay. Each experiment was conducted in triplicate to obtain the mean value, and the result was expressed as
Effect of SOCS1 silencing on the cell cycle of MV3 and A357 melanoma cells
At 48 h after transfection, the cell cycle of MV3 and A357 melanoma cells were detected using flow cytometry. The results revealed that compared with the mock and negative-siRNA groups, the SOCS1-siRNA group had significantly increased number of MV3 and A357 cells than in G0/G1 phase, but decreased the amount of MV3 and A357 cells than in S and G1/M phases (p < 0.05). No significant difference in the cell cycle of MV3 and A357 cells was detected between the mock and negative-siRNA groups (p > 0.05) (Figures 4 and 5).
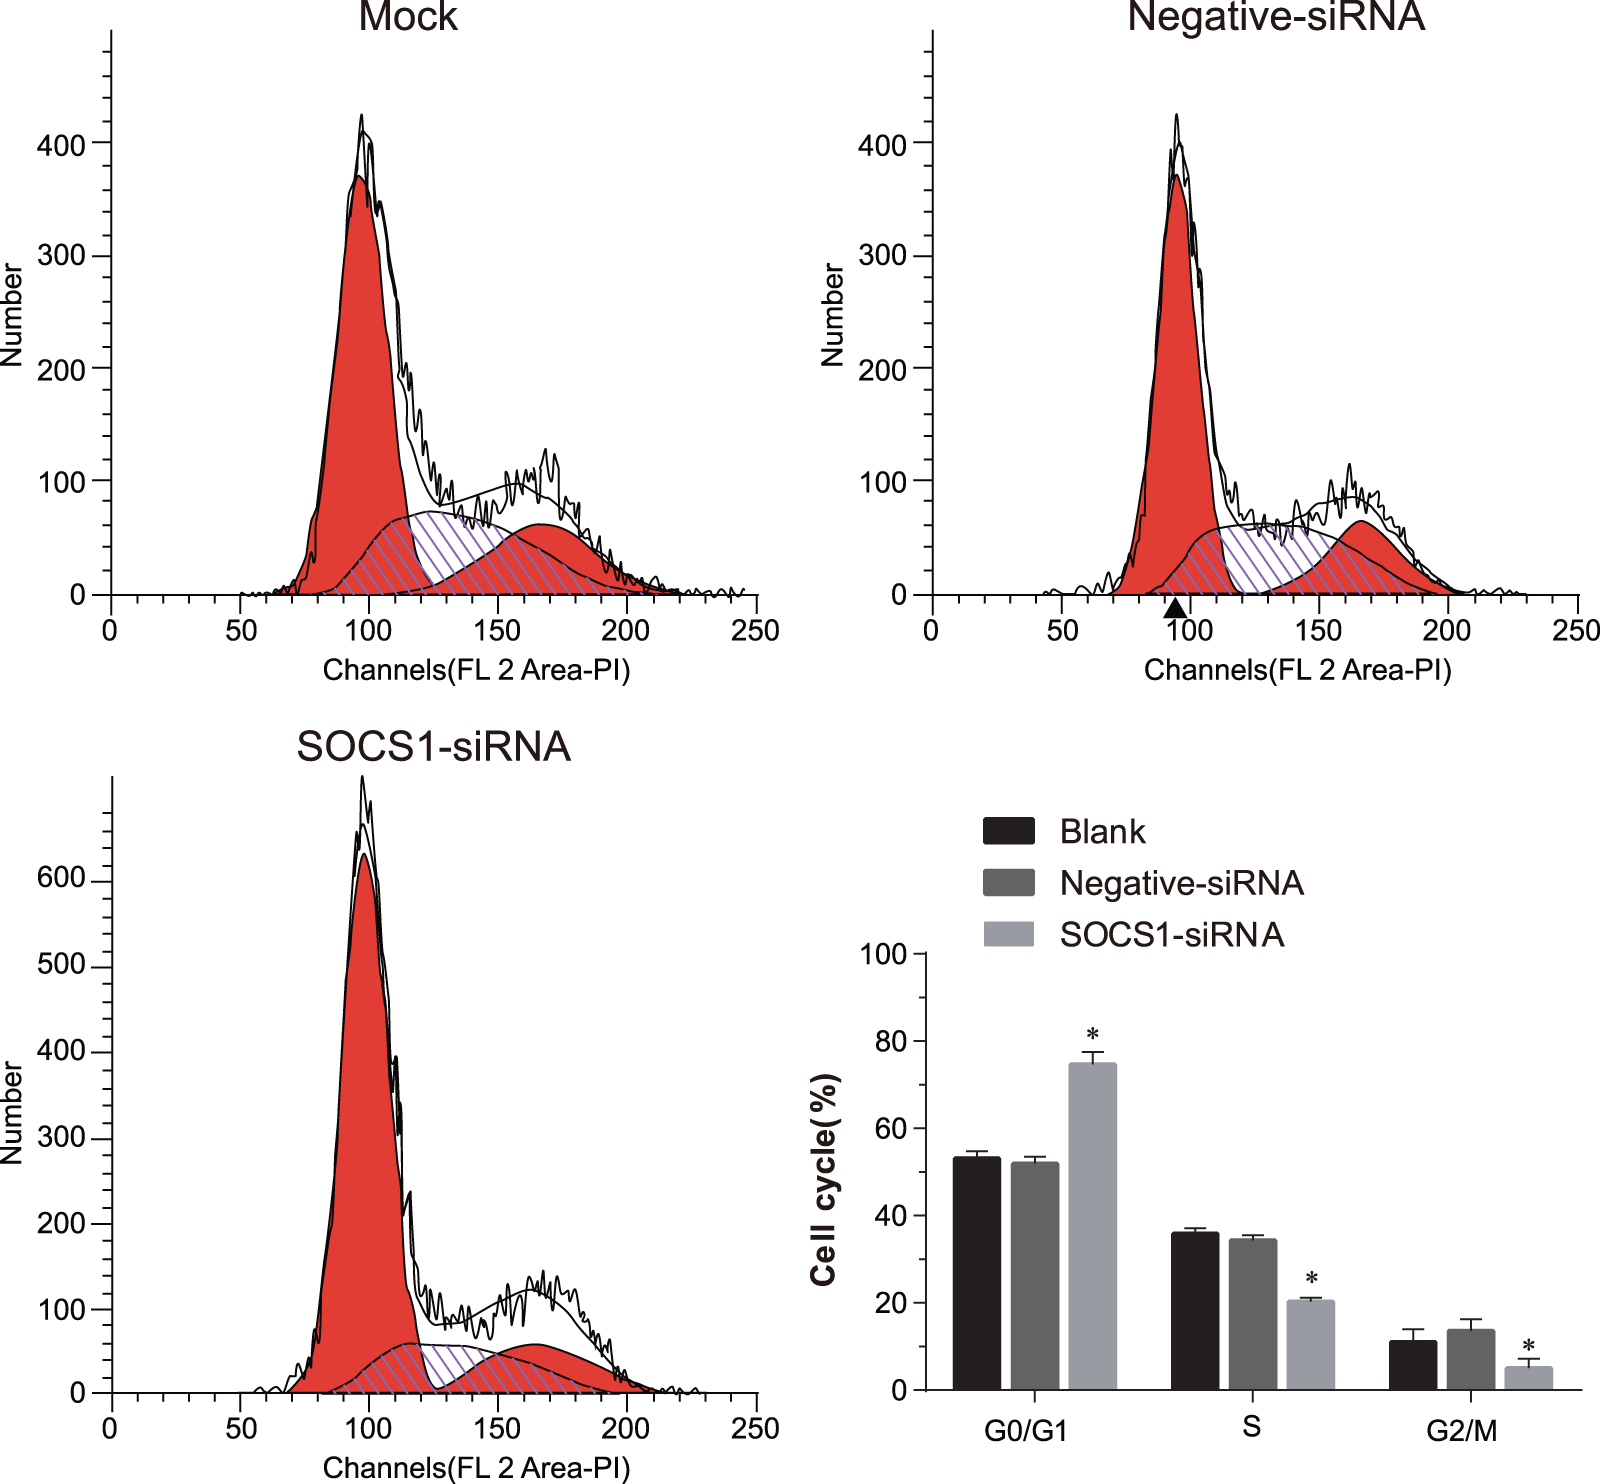
Effect of silencing SOCS1 on cell cycle of MV3 melanoma cells in the mock, negative-siRNA, and SOCS1-siRNA groups was detected by flow cytometry. Each experiment was conducted in triplicate to obtain the mean value, and the result was expressed as

Effect of silencing SOCS1 on cell cycle of A357 melanoma cells in the mock, negative-siRNA, and SOCS1-siRNA groups was detected by flow cytometry. Each experiment was conducted in triplicate to obtain the mean value, and the result was expressed as
Effect of SOCS1 silencing on the cell apoptosis of MV3 and A357 melanoma cells
Flow cytometry was conducted to detect the apoptosis rate of MV3 and A357 melanoma cells at 48 h after transfection. As Figure 6 showed, compared with the mock and negative-siRNA groups, the apoptosis rates of both MV3 and A357 melanoma cells in the SOCS1-siRNA group were significantly upregulated (p < 0.05), but there was no significant difference of the apoptosis rates in MV3 and A357 melanoma cells between the mock and negative-siRNA groups (p > 0.05) (Figure 7).

Effect of SOCS1 silencing on the cell apoptosis of MV3 melanoma cells in the mock, negative-siRNA, and SOCS1-siRNA groups was detected by flow cytometry. Each experiment was conducted in triplicate to obtain the mean value, and the result was expressed as

Effect of SOCS1 silencing on the cell apoptosis of A357 melanoma cells in the mock, negative-siRNA, and SOCS1-siRNA groups was detected by flow cytometry. Each experiment was conducted in triplicate to obtain the mean value, and the result was expressed as
Effect of SOCS1 silencing on the mRNA and protein expressions of SOCS1 in MV3 and A357 melanoma cells
As shown in Figure 8, the relative expression of SOCS1 mRNA in MV3 and A357 melanoma cells was significantly downregulated in the SOCS1-siRNA group than in the mock and negative-siRNA groups (p < 0.05), while no significant difference in SOCS1 mRNA expression in MV3 and A357 melanoma cells was identified between the mock group and the negative-siRNA group (p > 0.05). Consistently, western blotting results demonstrated that the relative expression of SOCS1 protein in MV3 and A357 melanoma cells in the SOCS1-siRNA group was significantly lower than those in the mock and negative-siRNA groups (p < 0.05), but no significant difference was found in SOCS1 protein expression in MV3 and A357 melanoma cells between the mock group and the negative-siRNA group (p > 0.05).

Effect of SOCS1 silencing on the mRNA and protein expressions of SOCS1 in MV3 and A357 melanoma cells in the mock, negative-siRNA, and SOCS1-siRNA groups. (a) The mRNA expression of SOCSI in MV3 and A357 melanoma cells in three groups; (b) the protein expression of SOCSI in MV3 and A357 melanoma cells in three groups; each experiment was conducted in triplicate to obtain the mean value, and the result was expressed as
Effect of SOCS1 silencing on the ERK and JAK/STAT signaling pathways-related protein expressions in MV3 and A357 melanoma cells
As Figure 9 displayed, there was no significant difference in the expressions of ERK1/2, JAK2, STAT1, and STAT3 among the mock, SOCS1-siRNA, and negative-siRNA groups (p > 0.05). Compared with the mock and negative-siRNA groups, the expressions of p-ERK1/2, p-JAK2, p-STAT1, and p-STAT3 in the SOCS1-siRNA group were significantly reduced (p < 0.05). No significant difference was found in the phosphorylated protein expressions between the mock group and the negative-siRNA group (p > 0.05).

Effect of SOCS1 silencing on ERK and JAK/STAT signaling pathways-related protein expressions in MV3 and A357 melanoma cells in the mock, negative-siRNA, and SOCS1-siRNA groups. (a) ERK and JAK/STAT signaling pathways-related protein expressions in MV3 melanoma cells in three groups; (b) ERK and JAK/STAT signaling pathways-related protein expressions in A357 melanoma cells in three groups; each experiment was conducted in triplicate to obtain the mean value, and the result was expressed as
Comparison of subcutaneous xenograft tumor growth in nude mice among the mock, negative-siRNA, and SOCS1-siRNA groups
After the latent period, macroscopic tumor nodules were successfully formed in inoculation sites of nude mice in the mock, negative-siRNA, and SOCS1-siRNA groups, and these nodules increased with time. The nude mice were generally in good condition before execution, and the tumors, slightly hard in texture, were metastatic. After execution, the tumor tissues were separated from the nude mice. No satellite lesion was observed around the tumor tissues, and the lobulated or spherical peploses were complete. The rates of tumor formation in the three groups were all 100%, and the diameter of tumors was over 5 mm, suggesting no significant difference in tumor formation (p > 0.05) (Figure 10). The examination of nude mice revealed that the latent period of tumor was longer, the tumor size and volume were smaller and the tumor growth curve was smoother in the SOCS1-siRNA group than in the mock and negative-siRNA groups (p < 0.05). The indexes that mentioned above did not show significant difference between the mock group and the negative-siRNA group (p > 0.05) (Table 2 and Figure 10).

Comparison of subcutaneous xenograft tumor growth in nude mice among the mock, negative-siRNA, and SOCS1-siRNA groups. (a) The appearance of xenograft tumors in nude mice in the mock, negative-siRNA, and SOCSI-siRNA groups; (b) the growth curves of xenograft tumors in nude mice in the mock, negative-siRNA, and SOCSI-siRNA groups.
Comparisons of the latent period of tumor and tumor volume among the mock, negative-siRNA, and SOCS1-siRNA groups (

siRNA: small interfering RNA.
p < 0.05 compared with the mock group.
Discussion
Malignant melanoma is regarded as the most fatal cutaneous tumor with an increased incidence over the past years. 19 Due to the high metastatic potential in early stage and high incidence among teenagers/young adults, melanoma has become a great threat to patients. 3 This study investigated the role of SOCS1 in the proliferation and apoptosis of MV3 and A357 melanoma cells. We found that silencing SOCS1 can suppress the proliferation and promote the apoptosis of MV3 and A357 melanoma cells through the inhibition of ERK and JAK/STAT signaling pathways, indicating the potential of SOCS1 in gene therapy of melanoma.
This study showed that SOCS1 expressed more predominantly in malignant melanoma tissues than in pigmented nevi, and higher mRNA and protein expressions of SOCS1 were found in melanoma cells than human primary melanocytes. As the first member discovered in SOCS family, SOCS1 consists of a central SH2 domain that has an N-terminal region of variable length known as kinase inhibitory region (KIR), a 40-amino-acid C-terminal region called SOCS box.17,20,21 SOCS1 protein and mRNA expressions were found to be closely linked to tumor invasion, melanoma tumor thickness and stage of disease, being the highest in metastases. 22 It has been reported that SOCS1 expression was not observed in normal HEMa and melanocytic nevi but was detected in melanoma cell lines, thus SOCS1 could be considered as a marker of human melanoma development.1,17 The role of SOCS1 in tumorigenesis and tumor progression remains undecided, and studies indicated that SOCS1 functioned as either a tumor suppressing gene or tumor promoting gene depending on the cell type.13,23 In our study, compared with the mock and negative-siRNA groups, the SOCS1-siRNA group showed longer latent period of tumor, smaller tumor size and volume, and smoother tumor growth curve, indicating that SOCS1 silencing may serve as an inhibitor on melanoma. Scutti et al. 1 found that in vivo silencing of SOCS1 exerted an inhibitory effect on subcutaneous tumor growth and metastasis of melanoma in the lungs of C57BL/6 mice with subcutaneously injection of B16F10-Nex2 melanoma cells. This study also demonstrated that compared with the mock and negative-siRNA groups, SOCS1-siRNA group had more cells in G0/G1 phase, less cells in S and G2/M phases, increased cell apoptosis, and decreased expressions of p-ERK1/2, p-JAK2, p-STAT1 and p-STAT3 proteins. These results indicated that silenced SOCS1 can inhibit the proliferation and facilitate the apoptosis of MV3 and A357 melanoma cells by suppressing the activities of ERK and JAK/STAT signaling pathways. Beaurivage et al. 22 revealed that JAK/STAT signaling pathway was inhibited by SOCS1 mainly through two mechanisms: first, the KIR domain of SOCS1 functioning as a pseudosubstrate directly acts with JAK tyrosine kinase so that JAK catalytic activity is inhibited; second, C-terminal SOCS box boosts ubiquitination and proteasomal degradation of JAK. JAK/STAT pathway is a key regulator of normal and pathological inflammatory responses as well. IFN-γ, a crucial cytokine in melanoma immunotherapy, modulates cellular processes through JAK/STAT signaling pathway, such as differentiation and proliferation. With the function of regulating JAK/STAT signaling pathway in a negative manner, SOCS1 may play an important role in reducing IFN-γ sensitivity in melanoma cells. 15 Thereby, the inhibition of SOCS1 expression can promote melanoma cell apoptosis, reduce cell proliferation, and limit tumorigenic activities. 22
In addition, SOCS1 could negatively mediate ERK signaling pathway by targeting p95 Vav degradation. 18 It has been demonstrated that activation of ERK signaling pathway is often related with the inhibition of apoptotic cascade through regulating the expression of Bcl-2 family members, thus increasing cell proliferation and survival. 24 Furthermore, it has been proved that the absence of SOCS1 expression could result in enhanced apoptosis. 16 Consistently, our study showed that decreased expression of ERK signaling pathways-related protein (p-ERK1/2), slower cell proliferation, and upregulated cell apoptosis were observed in the SOCS1-siRNA group. This study also found that SOCS1 silencing regulated cell cycle through inhibiting the transition from G0/G1 to S phase. Similarly, a previous study has shown that the proportion of melanoma cells in G0/G1 phase was significantly upregulated, and the number of melanoma cells surpassed that in the transfection group 48°h after SOCS1 silencing. 15 Furthermore, Xu et al. 15 found that silencing of SOCS1 expression in human melanoma Mel526 cells significantly led to an enhanced cell sensitivity to IFN-γ, prolonged S phase, and inhibited proliferation of tumor cells, thereby regulating the melanoma cell cycle.
To conclude, our study suggests that silenced SOCS1 could lead to the inhibition of cell proliferation and promotion of cell apoptosis in MV3 and A357 melanoma cells by inhibiting ERK and JAK/STAT signaling pathways. Hence, silencing SOCS1 could be beneficial for future gene therapy development against melanoma. However, further studies are needed to examine whether SOCS1 can be used as a novel therapeutic target in melanoma treatment.
Footnotes
Acknowledgements
The authors want to thank all the people for their help in the paper editing.
Declaration of conflicting interests
The author(s) declared no potential conflicts of interest with respect to the research, authorship, and/or publication of this article.
Funding
The author(s) disclosed receipt of the following financial support for the research, authorship, and/or publication of this article: The author(s) received no financial support for the research, authorship, and/or publication of this article.