
Abstract
The AML1 (acute myeloid leukemia 1) gene, a necessary prerequisite of embryonic hematopoiesis and a critical regulator of normal hematopoietic development, is one of the most frequently mutated genes in human leukemia, involving over 50 chromosome translocations and over 20 partner genes. In the few existing studies investigating AML1 gene expression in childhood leukemias, aberrant upregulation seems to specifically associate with AML1 translocations and amplifications. The aim of this study was to determine whether overexpression also extends to other leukemic subtypes than the ones karyotypically involving AML1. We use quantitative real-time polymerase chain reaction methodology to investigate gene expression in 100 children with acute leukemias and compare them to those of healthy controls. We show that in childhood acute lymphoblastic leukemia, AML1 gene overexpression is associated with a variety of leukemic subtypes, both immunophenotypically and cytogenetically. Statistically significantly higher transcripts of the gene were detected in the acute lymphoblastic leukemia group as compared to the acute myeloid leukemia group, where AML1 overexpression appeared to associate with cytogenetic abnormalities additional to those that engage the AML1 gene, or that are reported as showing a “normal” karyotype. Collectively, our study shows that AML1 gene overexpression characterizes a broader range of leukemic subtypes than previously thought, including various maturation stages of B-cell acute lymphoblastic leukemia and cytogenetic types additional to those involving the AML1 gene.
Introduction
The acute myeloid leukemia 1 gene (AML1; also known as AML1B, RUNX1, CBFA2, or PEBP2aB1) was initially cloned as a target of the translocation breakpoint of chromosome 21 in the t(8;21)(q22;q22) AML1-ETO translocation, most frequently found in acute myeloid leukemia (AML). 1 Subsequently, several lines of evidence have shown AML1 to be a necessary prerequisite of embryonic hematopoiesis2–6 and a critical regulator of normal hematopoietic development, as it is constitutively expressed in all lineages of the hematopoietic system, except for mature erythroid cells. 7 Consequently, AML1 is normally involved in regulating the expression of a number of genes that are important for the development, function, and differentiation of hematopoietic cells; it therefore activates the transcription of several hematopoietic genes, including genes encoding cytokines and cytokine receptors, such as IL-3, GM-CSF, CSF-1R, the defensin protein, NP3, receptors of T- and B-cells, and genes specific to myeloid cells (e.g. neutrophil elastase and myeloperoxidase). 8 However, because the AML1 binding sites are necessary but not sufficient for transcriptional activation, the gene has been hypothesized to act as a coordination agent that facilitates the assembly and cooperation of other transcriptional activation complexes. 8 When AML1 cooperates with tissue-specific factors that regulate cell proliferation and differentiation (e.g. C/EBPa, AP-1, 1-ETS, PU.1, and c-Myb), it may act as an activator of transcription,9–13 whereas in cooperation with suppressive factors such as Groucho and mSin3, it may act as a transcriptional repressor.14–16
The AML1 gene is currently one of the most frequently mutated genes in human leukemia. Of particular interest is the fact that AML1, despite being an oncogene, is disrupted by chromosomal translocations in acute leukemias. Apart from t(8;21), which mainly occurs in M2 AML, AML1 has been found to be disrupted by t(12;21) (TEL-AML1) in childhood B-cell acute lymphoblastic leukemia (B-ALL), and indirectly by inv(16), which represent nearly one-third of all cases of AML and one-quarter of all cases of B-ALL. 17 In addition, t(3;21) (AML1-EVI1) is often found in secondary AML and myelodysplasia.18,19 Overall, over 50 chromosome translocations and over 20 partner genes involving the AML1 gene have been identified. 20 The possible role of AML1 gene overexpression in leukemogenesis has already been highlighted.21–25 Possible mechanisms include the existence of mutations in the AML1 runt domain26–28 and the increased number of gene copies in ALL, which usually arise from intrachromosomal amplification of the gene or may be derived from amplifications of chromosome 21.29–33 The extra copies of AML1 appear to be a frequent karyotypic abnormality in childhood ALL, generally associated with an unfavorable prognosis, but not appearing to be associated with other cytogenetic abnormalities in ALL and presenting a rare and secondary phenomenon in therapy-related AML. 34 In the few existing studies that have focused on investigating AML1 gene expression in the acute leukemias of childhood, most cases appear to be characterized by an overexpression of the gene.25,35 This, along with the fact that AML1 is the most frequent target of chromosomal translocations, the promiscuity of its recombinations, and the phenotypic heterogeneity of the leukemias bearing AML1 alterations, makes it a very interesting candidate in the pathogenicity of childhood leukemias. Notably, it has also been shown that AML1 amplification is implicated in the lineage conversion of childhood ALL to AML, 34 thus highlighting the diversity of AML1 involvement in the various leukemic subtypes and the possible implication of AML1 overexpression in the etiology of childhood leukemia.
Here, we investigate the transcript levels of AML1 in the diagnostic samples of a cohort of 100 pediatric acute leukemia patients and in 4 leukemic cell lines, and compare them to those of healthy controls. Our aim is to determine whether aberrant AML1 gene expression is a characteristic of childhood acute leukemias and whether it correlates with specific karyotypic abnormalities—for example, those involving AML1 translocations or AML1 amplifications. In addition, we investigate the prognostic impact of high gene expression in the clinical course of childhood leukemia, through possible correlations with minimal residual disease (MRD) and survival outcome.
Materials and methods
Ethics statement
Informed written consent was given by the parents, and all experiments were conducted in compliance with the international biomedical studies stipulations, with reference to the Declaration of Helsinki of the World Medical Association. The study was reviewed and approved by the Institutional Review Committee for the protection of human subjects at Aghia Sofia Children’s Hospital with reference code 2996/07-02-12.
Patient and control samples
A total of 100 children were diagnosed with acute leukemia (86 with ALL and 14 with AML) at the Hematology/Oncology Unit of Medical School, National and Kapodistrian University of Athens at “Aghia Sofia” Children’s Hospital, Athens, Greece. Bone marrow (BM) samples were collected at diagnosis, and all patients were classified morphologically and immunologically. Patient data were as follows: males: 58, females: 42, median age at diagnosis (years): 6.69 ± 4.80, median male age (years): 6.98 ± 4.56, median female age (years): 6.30 ± 5.14, median ALL age (years): 6.29 ± 4.55, and median AML age (years): 9.14 ± 5.71. Patient clinical data are summarized in Supplementary Table 1. BM samples were also collected from 50 healthy children, on the suspicion of neoplasia, but were found negative for the disease, and were therefore used as negative controls. Of these, only 42 yielded good-quality RNA for subsequent analysis. Four childhood leukemia cell lines were also included in the study as additional samples: REH (pre-B ALL), CCRF-CEM (T-cell ALL), CCRF-SB (T-cell ALL), and THP-1 (acute monocytic leukemia). All cell lines were obtained from the European Collection of Authenticated Cell Cultures (ECACC, UK).
RNA extraction
According to the manufacturer’s protocol, total RNA was extracted from BM leukocytes/myelocytes, using TRIzol reagent (Invitrogen Inc., USA). Extraction of RNA from the four cell lines was performed with the same protocol. RNA was treated with amplification grade DNase I to eliminate any residual genomic DNA from the sample and further purified with the RNeasy® Micro Kit (Qiagen Inc., Germany). RNA quantification measurements were performed on the NanoDrop® ND-1000 Spectrophotometer (Nanogen Inc., USA).
Quantitative reverse transcription polymerase chain reaction
Total RNA was prepared from blast cells, and gene expression was investigated with the Plexor™ One-Step quantitative reverse transcription polymerase chain reaction (qRT-PCR) System Kit (Promega Inc., USA) as described previously, 36 using the LightCycler2 and LightCycler480 Instruments (Roche Diagnostics GmbH). The data were normalized to the GAPDH (glyceraldehyde 3-phosphate dehydrogenase) housekeeping gene. The sequences of the primers in the 5′ to 3′ direction were as follows: AML1F: 5′-GT-GGG-TAC-GAA-GGA-AAT-GAC-TCA-AA-3′ and AML1R: 5′-GCA-GCG-TGG-TAA-AAG-AAA-TCA-TTG-AG-3′. Amplified sequences included the AML1 transcript variant 1 (Refseq: NM_001754.4) and the AML1 transcript variant 2 (Refseq: NM_001001890.2), which correspond to isoforms AML1c and AML1b, respectively.
Real-time data pre-processing and analysis
Real-time data were collected and pre-processed using the LightCycler Software Version 3.5 and the LightCycler Software version SW1.5 (Roche Diagnostics GmbH) for the LightCycler2 and LightCycler480 instruments, respectively. Data were then imported to the Plexor™ Analysis Software (www.promega.com/plexorresources/) (Promega Inc., USA), and gene expression was obtained in the form of Ct values. Data pre-processing was performed with Microsoft® Excel.
Statistical analysis
The independent t-test failed to reveal a statistically reliable difference in the mean GAPDH expression levels (Ct values) between the patients and controls (p = 0.349); hence, we accepted GAPDH Ct values as reliable normalization constants. Independent t-tests and one-way analysis of variance (ANOVA) were then performed to compare the mean AML1 expression levels between groups. The Ct value of each gene (for every patient and healthy control) was normalized against the Ct value obtained for the housekeeping gene, GAPDH (i.e. ΔCt AML1 = Ct of AML1 − Ct of GAPDH), and the normalized ΔCt value was used to compare the genes between patients and controls (e.g. ΔΔCt AML1 = ΔCt AML1 of patient 1 − (mean) ΔCt AML1 of controls). Gene expression (or fold change) was calculated using the ΔΔCt after normalizing to GAPDH (i.e. 2−ΔΔCt). Patients were regarded as significantly overexpressing a gene if the corresponding fold-change value was >1 (and thus corresponding to a positive log2 value). Comparisons between patient subgroups were regarded significant if p ⩽ 0.05. Log-Rank survival curves were used to estimate significance of overall survival (OS) and leukemia-free time (LFT). Data pre-processing was performed with Microsoft® Excel. Statistical and data analyses have been performed using the IBM SPSS Statistics Program (IBM Corp. Released 2012. IBM SPSS Statistics for Windows, Version 21.0. Armonk, NY: IBM Corp.). Raw data are included in Supplementary file 1.
Results
qRT-PCR analysis
A qRT-PCR assay was established. AML1 was found to be differentially overexpressed, as compared to the healthy controls, in 54 patients (54% of total patient cohort): 51 patients with ALL (1 with pro-pre-B, 32 with B-common, 15 with pre-B, and 3 with T-cell ALL), 3 patients with AML and one of the four cell lines: CCRF-CEM (T-cell ALL). Some patients revealed a much higher expression ratio (R > 5.0) than the rest (p = 0.000) (Supplementary file 1). Therefore, patients were divided into three groups: normal (healthy) ratio (R ⩽ 1.0), high ratio (1.0 < R ⩽ 5.0), and very high ratio (5.0 < R) (Table 1).
Gene expression ratios (fold change) in childhood leukemia patients.

ALL: acute lymphoblastic leukemia; AML: acute myeloid leukemia.
p-value has been calculated by comparing the high ratio to the healthy (normal) ratio.
Correlation analysis between gene expression and leukemic subtypes
A statistically significant difference in gene expression was detected between the two main leukemia subtypes, ALL and AML, with the ALL group exhibiting significantly higher transcript levels of AML1 as compared to the other group (p = 0.000) (Figure 1). This was somewhat expected, as only 3 out of the 14 AML patients appeared to overexpress AML1 as compared to controls. When examining gene expression with respect to the various immunophenotypic subgroups in ALL, no significant correlation was found between abnormal gene expression and any of the subgroups. However, in the B-common and pre-B subgroups, the majority (approximately 1/3) of the patients appeared to overexpress the gene. Gene expression was not examined with respect to the various immunophenotypic subgroups in AML due to the small number of patients in each subgroup (1–3 patients). Similarly, no significant difference in abnormal gene expression was detected among the various cytogenetic subgroups, in both ALL and AML. In the AML subtype, overexpression of AML1 was observed only in patients with karyotypic abnormalities of the gene, that is, carrying the AML1-ETO translocation, inv(16), and extra copies of the gene (Supplementary Table 1). However, in childhood ALL, it appeared that AML1 aberrant gene expression did not exclusively correlate with specific karyotypic abnormalities, such as those involving AML1 translocations or AML1 amplifications. Although the majority of patients with TEL-AML1 (13/15), as well as the majority of patients with extra copies of AML1 (18/27), exhibited high transcript levels of the gene, abnormally high gene expression was also observed in other subgroups, such as those with BCR-ABL1 translocation (2/3 patients), with MLL rearrangements (2/9 patients), and with extra copies of genes other than AML1 (7/15 patients) (Supplementary Table 1).
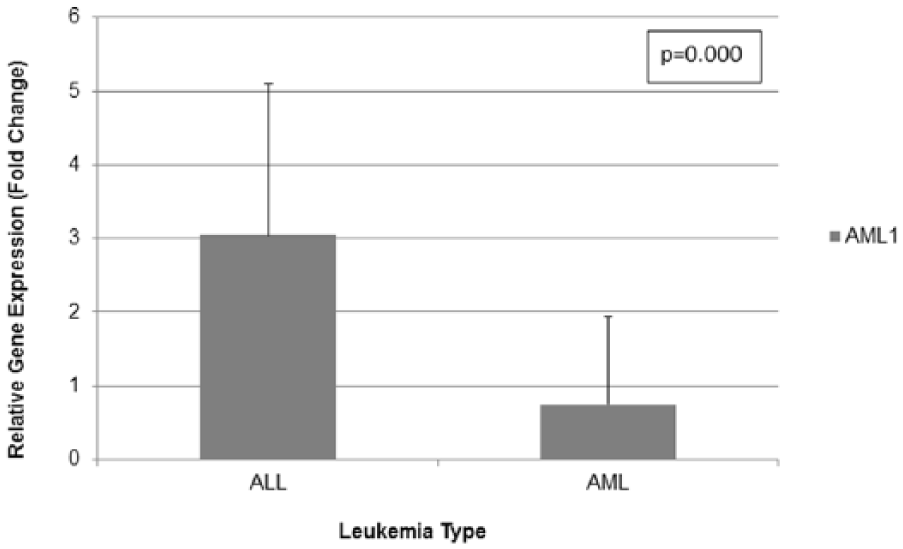
AML1 gene expression in leukemia patients.
Correlation analysis between gene expression and MRD levels
Patients with MRD on day 33 (d33) and/or failure to treatment are presented in Table 2. Failure to treatment is defined as relapse or death, events that are sometimes preceded by refractory disease. Overall, 27 patients (27%) had positive MRD on d33. A total of 12 patients had failure to treatment (i.e. relapsed or died) but only 9 of them had concurrent positive MRD on d33. Therefore, a total of 30 patients had MRD on d33 and/or failure to treatment. Eleven (11) of the 30 patients in Table 2 appear to overexpress AML1, whereas the t-test failed to reveal a statistically reliable difference in AML1 gene expression levels between patients with positive MRD and patients with negative MRD on d33 (p = 0.181), or between patients who relapsed and patients who did not relapse (p = 0.668).
Patients with MRD (d33) and/or failure to treatment.

MRD: minimal residual disease; d33: day 33 (of therapy); M: male; F: female; ALL: acute lymphoblastic leukemia; AML: acute myeloid leukemia; NBL: neuroblastoma; “+”: positive; “−”: negative.
Correlation analysis between gene expression and OS/LFT
A 3-year survival period has been calculated for all the patients (100) enrolled in the study (Supplementary file 1). LFT has been calculated as the event-free or disease-free survival, that is, the time to relapse. No significant correlation appeared to exist between high AML1 gene expression and OS (p = 0.970) or between high AML1 gene expression and LFT, that is, time to relapse (p = 0.973) (Figure 2).

Overall survival (OS) and leukemia-free time (LFT) analyses with respect to AML1 gene expression.
Discussion
In this study, we have found AML1 to be differentially overexpressed in just over half of the patients (54%) and in one of the four cell lines, as compared to the healthy controls. Although abnormal gene expression appears to associate with both pediatric ALL and AML, a statistically significant difference in gene expression was denoted between the two groups, with the ALL patients exhibiting significantly higher transcript levels of AML1. In addition, none of the AML patients exhibited very high transcript levels of AML1 (R > 5.0), as opposed to ALL patients (Table 1). This observation could be due to the fact that there were far more ALL patients with karyotypic abnormalities of the AML1 gene, such as rearrangements or amplifications, than AML patients. Nonetheless, it has been shown that the AML1a transcript variant of AML1 induces the development of ALL, but not AML, when transplanted into lethally irradiated mice. 24
In our childhood ALL samples, abnormally high transcript levels of the gene have been observed at various maturation stages of B-cell ALL (pro-pre-B, B-common, and pre-B) and in T-cell ALL (Table 1). Based on this observation, it is difficult to suggest an implication of AML1 overexpression in the leukemic transformation of B- and T-lymphoid progenitors in childhood, as promiscuous transcriptional expression of several lineage-affiliated genes has been shown to precede lineage commitment of multipotent progenitor cells without altering their biological potential. 37 Furthermore, a very high ratio of gene expression (R > 5.0) has been observed in T-cell leukemia, as well as in B-cell leukemia with B-common and pre-B maturation (Table 1). While AML1 has been shown to be involved in thymocyte differentiation via control of cell proliferation, 38 with AML1 overexpression influencing the transition of T-cells from the CD4-CD8- to the CD4+CD8+ maturation stage,24,39,40 this is the first report documenting abnormally high transcript levels in childhood B-cell ALL with B-common and pre-B cell maturation. Our results suggest an association of AML1 overexpression in the leukemic B-cell transformation, especially in the relatively immature B-common subtype, where the highest transcript levels are recorded (R = 30.47) (Table 1). This association of AML1 upregulation with the various immunophenotypic subtypes of ALL could reflect the many critical roles of the gene in normal hematopoietic development. Since AML1 is essential and constitutively expressed in all lineages of the hematopoietic system, it is possible that abnormal changes in its transcriptome would also reflect in lymphoid-cell associated malignancy, thus appearing significantly higher in the relatively immature B-common ALL subtype.
In our childhood AML samples, AML1 overexpression has been observed only in patients with cytogenetic abnormalities of the gene, that is, a patient with t(8;21) (AML1-ETO), a patient with inv(16), and a patient with extra copies of AML1. The rest of the AML cases in our patient cohort (11/14) and the THP-1 cell line, who carried no or other cytogenetic aberrations (such as MLL rearrangements and PML-RARA fusions), displayed normal transcript levels of AML1 as compared to controls (Supplementary Table 1). Therefore, our results are in agreement with the general notion that abnormal gene expression in AML is associated with karyotypic abnormalities of the AML1 gene. 17 However, in the ALL samples, aberrantly high transcript levels of the AML1 gene, as compared to controls, did not appear to correlate exclusively with karyotypic abnormalities involving AML1 translocations or amplifications. Instead, AML1 overexpression has been observed in a broader range of cytogenetic subgroups, such as those with BCR-ABL1 translocation, with MLL rearrangements, and with extra copies of genes other than AML1 (Supplementary Table 1). While it is difficult to validate a reason for this observation, one possible explanation might be that in the ALL patients with no apparent cytogenetic abnormalities of AML1, abnormally high levels of the gene might be related to overexpression of the AML1a isoform. Since AML1a is known to interfere with the function of the other two variants, AML1b and AML1c (collectively called AML1), by exhibiting higher DNA sequence affinity for target genes and therefore by antagonizing the binding sites of AML1, 41 it is possible that apart from the normal function of AML1 in hematopoiesis, AML1a also distorts the function of AML1 in leukemogenesis. In addition, it has already been proposed that in cases of AML1 rearrangement or mutation, it is the lack of the transactivation domain that triggers leukemogenesis. 42 Coincidentally, the protein encoded by AML1a, as opposed to the proteins encoded by AML1b and AML1c (i.e. AML1), lacks a transactivation domain and hence it is possible that it disrupts the normal function of AML1 in a manner similar to that of the leukemia-associated fusion proteins. 24 Another possibility is that the AML1 gene interacts with other genes, also critical for both normal hematopoiesis and leukemogenesis. Such an example is the recently unveiled physical and functional interaction of AML1 with MLL, not only regulating the epigenetic status of essential cis-regulatory elements for hematopoietic genes but also with possible implications in the epigenetic regulation of malignant hematopoiesis. 43
Of our 27 MRD-positive patients, only 9 were found to exhibit abnormally high expression levels of AML1, as compared to controls (Table 2). As a result, no statistically significant differences in gene expression were obtained between the MRD-positive patient group and the MRD-negative group (p = 0.181). This signifies that AML1 overexpression cannot be used to distinguish between positive and negative MRD status and, hence, does not have the potential to determine the response to therapy in childhood leukemia patients. In addition, no significant correlation appeared to exist between aberrantly high AML1 gene expression and dismal OS (p = 0.970), or relapse (p = 0.973) in childhood leukemias (Figure 2). In other words, in our patient cohort, the abnormally high transcript levels of AML1 do not show a direct relationship with disease prognosis. This could be either due to an absence of interference of the AML1 gene product with the effects of the treatment regimen that was used or due to a balanced effect of AML1 on the leukemic cells. For example, AML1 elicits signaling pathways that protect the leukemic cell, while at the same time restrict its clonogenic potential.44,45 Specifically, wild-type AML1 represses nuclear factor-kappa B (NF-κB) signaling, 46 which is expected to limit the capacity of the cells expressing AML1 to generate malignant subclones, as abnormal functioning of the NF-κB signaling network is essential for malignant cell dissemination in tissues. 47 As a consequence, wild-type AML1 could compensate for part of the disrupted negative feedback signals and restrict the leukemogenic potential of the clones that express it.
The multitude of chromosome translocations and partner genes involving the AML1 gene, along with the dramatic biological consequences related to AML1 deregulation in hematological malignancies,20,48 as well as its recently unveiled involvement in the malignant transformation of non-hematopoietic tissues such as epithelial breast cells,49–51 constitute irrefutable evidence that the gene plays a central role in the gene regulatory network that governs cellular homeostasis and self-renewal. Over the years, it has also become apparent that many important regulators of hematopoietic stem cell development are also implicated in the abnormal self-renewal capacity of the leukemic stem cells. Of particular interest is the microRNA (miRNA)-based deregulation of AML1 gene expression, as miRNAs have the ability to affect AML1 transcriptional dosage by differentially regulating the level of AML1 splice variants through targeting of specific 3′ untranslated regions (UTRs). More specifically, the AML1α splice variant bears a very short 3′UTR, whereas isoforms AML1b and AML1c contain a long 3′UTR. While mir-27 can target the 3′UTR of both short and long AML1 isoforms, mir-17, which is often found upregulated in leukemias and lymphomas, can target the 3′UTR of only the longer isoforms.52–55 In other words, miRNAs have the ability to produce different biological responses by differentially regulating AML1 transcription. It is through the identification of such regulators, and of their downstream targets, that we hope to reveal how deregulated transcription on key developmental pathways leads to the malignant phenotype and to prospectively identify new targets for successful therapy against malignancy. Study limitations should be considered carefully as they could pose obstacles toward the scope of the investigation. Sample size and availability, as well as the choice of appropriate controls, are of greatest importance, as not only are there different types of cells in a patient sample but also similarities in the transcriptional profile of essential hematopoietic genes between normal hematopoiesis and leukemia.
Conclusion
Collectively, our study shows that abnormally high AML1 gene expression characterizes a variety of leukemic subtypes of childhood acute leukemias, both immunophenotypically and cytogenetically. Statistically significantly higher transcripts of the gene were detected in the ALL group as compared to the AML group, and at various maturation stages of B-cell ALL and in T-cell ALL. While AML1 overexpression has been observed in T-cell differentiation previously, this is the first report documenting an aberrantly high gene expression in childhood B-cell ALL with B-common and pre-B cell maturation. In addition, in ALL but not in AML, overexpression appears to correlate with cytogenetic abnormalities other than those known to involve AML1. However, as seen in our patient cohort, the abnormally high transcript levels of AML1 at the diagnosis of childhood leukemias do not show a direct relationship with disease prognosis, nor do they appear to have the potential to determine the response to therapy. In summary, abnormal activation of AML1 appears to be a characteristic of the leukemias that carry cytogenetic abnormalities additional to those that engage the AML1 gene, or that are reported as showing a “normal” karyotype. This highlights the unpredictable diversity of AML1 gene involvement in the etiology of childhood leukemia that remains to be unraveled.
Footnotes
Declaration of conflicting interests
The author(s) declared no potential conflicts of interest with respect to the research, authorship, and/or publication of this article.
Funding
The author(s) received no financial support for the research, authorship, and/or publication of this article.
References
Supplementary Material
Please find the following supplemental material available below.
For Open Access articles published under a Creative Commons License, all supplemental material carries the same license as the article it is associated with.
For non-Open Access articles published, all supplemental material carries a non-exclusive license, and permission requests for re-use of supplemental material or any part of supplemental material shall be sent directly to the copyright owner as specified in the copyright notice associated with the article.