
Abstract
The combination of nanotechnology and medicine will be the next generation of vehicles for targeted drug delivery. Carboxymethyl chitosan loaded with the anticancer drug C-phycocyanin and the CD59-specific ligand peptide for cancer cell targeting were used to create C-phycocyanin/carboxymethyl chitosan–CD59-specific ligand peptide nanoparticles using the ionic-gelation method. Optimal synthesis conditions, selected by response surface methodology, comprised the ratio carboxymethyl chitosan:C-phycocyanin = 3:1, and carboxymethyl chitosan and CaCl2 concentrations of 2.0 and 1.0 mg/mL, respectively. The resulting nanoparticles were spherical, with diameters of approximately 200 nm; the entrapment efficient was about 65%; and the drug loading was about 20%. The release of C-phycocyanin from C-phycocyanin/carboxymethyl chitosan nanoparticles was pH sensitive and had a sustainable effect in vitro. Guided by the CD59-specific ligand peptide, the nanoparticles efficiently targeted the surface of HeLa cells and had an obvious inhibitory effect on HeLa cell proliferation as determined by methyl thiazolyl tetrazolium assays. The nanoparticles were hemocompatible and induced apoptosis by upregulation of cleaved caspase-3 and cleaved polyADP-ribose polymerase proteins, and downregulation of Bcl-2 proteins. Our study provides a novel approach to the research and development of marine drugs, and support for targeted therapy using anticancer drugs.
Introduction
Cervical cancer, with an estimated 527,600 new cases and 265,700 deaths in 2012, is one of the most common types of cancer and is the leading cause of cancer-related death among female individuals worldwide. 1 Conventional chemotherapeutic agents are accompanied by a plethora of side effects during the process of killing cancer cells. Consequently, it is extremely desirable to design next-generation anticancer drugs that have higher specificity and efficacy, to minimize adverse effects. Nano-drugs have opened up a new field in medicine, with the potential to overcome the shortcomings of conventional drugs. 2 In this study, we developed a novel nano-drug that may lead to the development of a new treatment strategy for cancer cells.
C-phycocyanin (C-PC), derived from Spirulina plarensis, is a water-soluble phycobiliprotein commonly used in food and cosmetic colorants. 3 Several novel biological properties of C-PC were discovered recently. Pleonsil et al. 4 showed that C-PC can protect erythrocytes from oxidative damage by scavenging hydroxyl and peroxyl radicals. Kim et al. 5 showed that anti-inflammatory activities of C-PC may occur in part by inhibiting cyclooxygenase-2 and prostaglandin E2 production, downregulating phospholipase A2 activity, and histamine release. In addition, anticancer effects of C-PC have been widely demonstrated in human cervical cancer cells,6,7 lung cancer cells, 8 and colon cancer cells. 9 Moreover, C-PC is used as a fluorescent marker in biomedical research. 10 However, C-PC has poor stability and readily loses functionality, limiting it applications in medicine. Therefore, an efficient delivery system for C-PC is critically needed.
Chitosan (CS), an amino polysaccharide, has been widely used in medicine, food, biotechnology, agriculture, and pharmaceuticals because of its biocompatibility, biodegradability, and low cost. 11 However, CS is water insoluble at neutral pH, limiting its application in physiological conditions. Carboxymethyl chitosan (CMC), a CS derivative, has excellent solubility, over a wider pH range than CS.
To reduce side effects and enhance the therapeutic index, drugs can be designed to selectively recognize target molecules that are specific to an area highly expressed in tumors. Receptor-targeting peptides provide a new method for drug delivery through coupling with a drug. 12 CD59, a membrane complement regulatory protein, is overexpressed in cancer, leading to tumor cells avoiding clearance. 13 A novel cancer-targeting short peptide, named CD59-specific ligand peptide (CD59sp), can specifically bind to human CD59. 14 Thus, CD59sp is a potentially promising ligand for achieving targeted drug delivery.
In this study, we constructed a targeted nanoparticle (NP) that combines the unique properties of CMC and NPs as a biocompatible and cell-penetrating vehicle to deliver the non-toxic, anti-tumor agent C-PC, using the targeting property of CD59sp, to eradicate HeLa cells. We believe this study will provide a new approach to drug-delivery systems.
Materials and methods
Materials
CMC (MW = 6–10 kDa, deacetylation degree ⩾ 95%, and degree of substitution ⩾ 90%) was purchased from Qingdao Honghai Bio-Tech Co. Ltd., Qingdao, China. C-PC was purchased from Taizhou Binmei Biotechnology Co., Ltd, Taozhou, China. CD59sp was synthesis by Chinese Peptide Company, Hangzhou, China. HeLa cells, L929 cells, and fresh human blood were provided by the Affiliated Hospital of Qingdao University. Methyl thiazolyl tetrazolium (MTT) was purchased from Beijing Solarbio Science & Technology, Beijing, China. A rabbit anti-human cleaved caspase-3/cleaved polyADP-ribose polymerase (PARP) monoclonal antibody was purchased from Abcam Company Cambridge, MA, USA. All other chemicals used were of analytical grade.
Synthesis of C-PC/CMC NPs
The C-PC/CMC NPs were made by the ionic-gelation method. Briefly, CaCl2 was added dropwise into a CMC solution that had been pre-incubated with C-PC, until the solution became turbid. NPs were spontaneously obtained under constant stirring at 4°C, in the dark, for 30 min. The prepared NPs were separated by centrifugation at 9000g for 15 min at 4°C, and then sterilized using a syringe filter with pore size of 0.22 µm.
Based on a Box–Behnken design for the response surface optimization method, the three following factors were chosen, using the envelopment rate as an evaluation index: the ratio of CMC to C-PC (X1), the concentration of CMC (X2), and the CaCl2 concentration (X3; each factor set at three levels), as shown in Table 1.
Range of variables for the experimental design.

CMC: carboxymethyl chitosan.
Synthesis of C-PC/CMC-CD59sp NPs
CD59sp was coupled with C-PC/CMC NPs by amine coupling, using EDC (1-ethyl-3-(3-dimethylaminopropyl)carbodiimide)-activated carboxyl group conjugation chemistry. In this procedure, about 2 mg of EDC was added to 5 mg of C-PC/CMC NP samples in phosphate-buffered saline (PBS). The pH of the solution was adjusted to 5.6, with stirring (600 r/min) at room temperature for 1 h. Then, 1 mg/mL of CD59sp was then added to the solution and stirred overnight at 4°C in the dark to produce C-PC/CMC-CD59sp NPs. NPs were subsequently separated by centrifugation (9000g) for 15 min. The pellets were collected and used for further characterization and studies.
Entrapment efficiency (EE) and loading efficiency (LE)
The EE and LE of NP samples were quantified by spectrofluorometry (excitation wavelength was 590 nm, emission wavelength was 644 nm). A calibration curve was constructed from a C-PC standard using a dilution series ranging from 1 to 200 µg/mL. The EE and LE values were calculated using the following equations (equations (1) and (2))


Evaluation of NPs
The particle size was measured by dynamic light scattering (DLS). The surface morphology of NPs was analyzed using a scanning electron microscope.
In vitro drug release studies
In vitro C-PC release from C-PC/CMC NPs was determined by the dialysis method under two different pH values, 5.4 and 7.4, at 37°C. In a typical procedure, the prepared C-PC/CMC NPs (5 mg of NPs containing 1 mg of entrapped C-PC) were dispersed in 5 mL of PBS, then transferred to dialysis tubes, and kept in a beaker containing 60 mL PBS (pH 5.4 or 7.4) at 37°C, with gentle stirring in a shaking incubator. At fixed time intervals, 1, 4, 8, 12, 24, and 48 h up to 5 days, 100 µL of release media was removed and replaced with fresh PBS. The amount of C-PC released at different time intervals was by quantified by fluorometric spectroscopy. The drug release rate (DR) was calculated using the following equation (equation (3))

The experimental groups
The experiment was divided into four groups: (1) a control group, not treated with any drug; (2) the C-PC treated group, treated with C-PC alone; (3) the untargeted group, treated with C-PC/CMC NPs; and (4) the targeted group, treated with C-PC/CMC-CD59sp NPs.
In vitro cytotoxicity assay
The MTT assay was used to evaluate cytotoxicity of the prepared NPs in vitro. The cells were seeded in 96-well plates (1 × 10⁴ cells/well) and incubated for 48 h in RPMI 1640 medium with different concentrations of drugs (1, 10, 50, 100, and 200 µg/mL). Subsequently, 20 µL of MTT solution (5 mg/mL) was added for another 4 h. Finally, the culture medium was removed, and 150 µL of dimethyl sulfoxide (DMSO) was added to each well. The optical density (OD) was measured at 490 nm using a Multi-Mode Microplate Reader. ODsample and ODcontrol were the absorbance of drug for treated and untreated cells. Five parallel replicate experiments were carried out for each group. In vitro cell inhibition was calculated according to the following equation (equation (4)). The half maximal inhibitory concentration (IC50) of each group was calculated and half of the IC50 value was used in the following experiments
Hemolysis assay in vitro
In vitro hemolytic activity reflected the compatibility of NPs by estimating the concentration of free hemoglobin in serum. 15 Briefly, fresh blood was obtained from human volunteers, added to the tubes containing acid citrate dextrose, diluted with physiological saline, and centrifuged to separate the red blood cells (RBCs). The RBCs were diluted to 5% cell suspension with physiological saline. Then, 0.4 mL of drugs at different concentrations were mixed with 1.0 mL of RBCs suspended in physiological saline, and then incubated at 37°C in a thermostatic water bath for 2 h. PBS and Trixon X-100 (10 g/L) were used as negative and positive controls, respectively. After incubation, the mixtures were centrifuged at 3000 g for 10 min. Free hemoglobin in the supernatant was measured by a Beckman Coulter Elisa plate reader at 540 nm. The hemolysis ratio (HR) of RBCs was calculated based on the following equation (equation (5))

Cellular uptake studies
The cellular uptakes were observed by a confocal microscope using the spontaneous red fluorescence of C-PC. The HeLa cells and L929 cells were seeded in 24-well plates (1 × 10⁴ cells/well), and treated with C-PC/CMC-CD59sp NPs for different times. The cells were then fixed with 4% formaldehyde and washed three times with cold PBS, and the red fluorescence observed.
Western blotting
Cells were seeded in six-well plates (2 × 10⁵ cells/well), and treated for 48 h with drugs. Cells were washed with PBS and lysed with radioimmunoprecipitation assay (RIPA) buffer with 1% phenylmethylsulfonyl fluoride (PMSF) for 20 min on ice, then centrifuged at 10,000g for 20 min at 4°C to remove insoluble materials. The protein lysates were quantified using a bicinchoninic acid protein assay kit. Proteins were then separated using 12% sodium dodecyl sulfate–polyacrylamide gel electrophoresis. Western blotting was performed, as described previously. 7 Caspase-3/cleaved caspase-3 and PARP/cleaved PARP proteins were detected by chemiluminescence, and the optical densities of bands were analyzed by Image J software. The protein levels were normalized with respect to the β-actin level, and the gray-scale ratio of protein/β-actin was calculated.
Immunofluorescence
Cells were seeded on acid-etched coverslips in the individual wells of a 24-well plate (1 × 10⁴ cells/well). After cell attachment, the media were removed and drugs were added, with media, into the wells and incubated for 48 h. The coverslips were then washed with PBS and the cells fixed in 4% fresh paraformaldehyde solution for 10 min at room temperature. The cells were then treated with 0.1% Triton X-100 for 20 min. After washing with PBS, the cells were blocked with 10% goat serum for 30 min at room temperature and incubated in a rabbit anti-human Bcl-2 monoclonal antibody overnight at 4°C. The cells were washed with PBST (phosphate-buffered saline Tween-20) and incubated in goat anti-rabbit secondary immunoglobulin G, labeled with fluorescein isothiocyanate (FITC) for 1 h at 37°C in the dark. The cells were observed by a fluorescence microscope. The Bcl-2 proteins were quantified and analyzed by Image J software. Fluorescence density was determined by integrated optional density (IOD).
Statistics analysis
The experiments were carried out in triplicate and values are shown as the mean ± standard deviation (SD). Differences among multiple groups were analyzed by two-way analysis of variance (ANOVA) using SigmaStat software. The mean values for biochemical data from two groups were compared by two-tailed Student’s t test. All statistical tests with p < 0.05 were considered significant. SPSS 12.0 software was used for statistical analysis.
Results
Optimal preparation conditions of C-PC/CMC NPs
C-PC/CMC NPs were successfully synthesized using chemical cross-linking with CaCl2. The standard curve equation for C-PC was Y = 59.444X − 194.57 (R2 = 0.9989), and the detected linear range was from 0 to 200 µg/mL. A total of 29 runs were used to optimize the preparation conditions by the Box–Behnken design, and the experimental results and predicted values are shown in Table 2. A second-order polynomial equation described the model for the EE of C-PC/CMC NPs. The response surface regression model was calculated as follows

Experimental design and results of the Box–Behnken design.

EE: entrapment efficiency.
The variance analysis of the model is shown in Table 3. The Model F value of 551.92 and p < 0.0001 imply that the model was significant. There was reasonable agreement between the determination coefficient, R2 = 0.9986, and the adjusted R2 = 0.9968, and the lost item was not significant (p > 0.05). This result shows that the model was a good fit to the data.
ANOVA for the fitted quadratic polynomial model for EE.

ANOVA: analysis of variance; EE: entrapment efficiency.
The optimal preparation conditions comprised a ratio of CMC to C-PC (w/w) of 3:1, a concentration of CMC of 2 mg/mL, and a concentration of CaCl2 of 1 mg/mL.
Characterization of C-PC/CMC NPs
The data from DLS measurements showed that the NPs had diameters of 200 ± 11.2 nm (Figure 1). However, scanning electron microscopic (SEM) images revealed a spherical morphology and diameters of 115.5 ± 6.0 nm (Figure 2). Clearly, the NP diameters measured by SEM were smaller than those measured by DLS. This difference may have been caused by a difference in the measurement medium used. The samples for SEM must be dehydrated, leading to the shrinkage of the NPs, whereas the samples in DLS were measured in PBS solution. So the DLS measurement provided the most accurate estimation of the NP size under physiological conditions.

Particle size distribution of C-PC/CMC NPs measured by DLS. The diameter of 70% nanoparticles ranged from 80 to 220 nm. The average diameter was 200 ± 11.2 nm.

Morphology of C-PC/CMC NPs, shown by SEM imaging. Most C-PC/CMC NPs are circular or elliptical. The average diameter was about 115.5 ± 6.0 nm.
EE and LE
The equation for the standard curve of C-PC was A = 59.911C − 150.91 (R2 = 0.9994), with a linear range between 1 and 200 µg/mL. The EE of C-PC in NPs was measured by fluorescent intensity of C-PC in the supernatant after complete precipitation of C-PC/CMC NPs; thus, the total quantities of C-PC in the pellet were obtained by difference. The NPs were weighed by electronic balance. Finally, the EE and LE were determined to be about 65% and 20%, respectively.
Drug-release profile of C-PC/CMC NPs in vitro
The C-PC released from NPs was measured and the results indicated that C-PC/CMC NPs provided a slow release, as shown in Figure 3. The release rate of C-PC from C-PC/CMC NPs showed an initial burst release, followed by a slower release, which was attributed to the rapid release of surface adsorbed C-PC initially, followed by the sustained release of entrapped C-PC from NPs with CMC degradation. At pH 7.4, nearly 35% of C-PC was released in the first 5 h and 65% after 120 h. In comparison, at pH 5.4, almost 45% and 80% were released in the first 5 h and 120 h, respectively. Thus, the results suggest that the release of C-PC from the C-PC/CMC NPs depended on pH value. The C-PC release rate in the tumor cells may therefore be higher than that in normal cells because the pH within tumor cells is usually lower than that in normal cells.
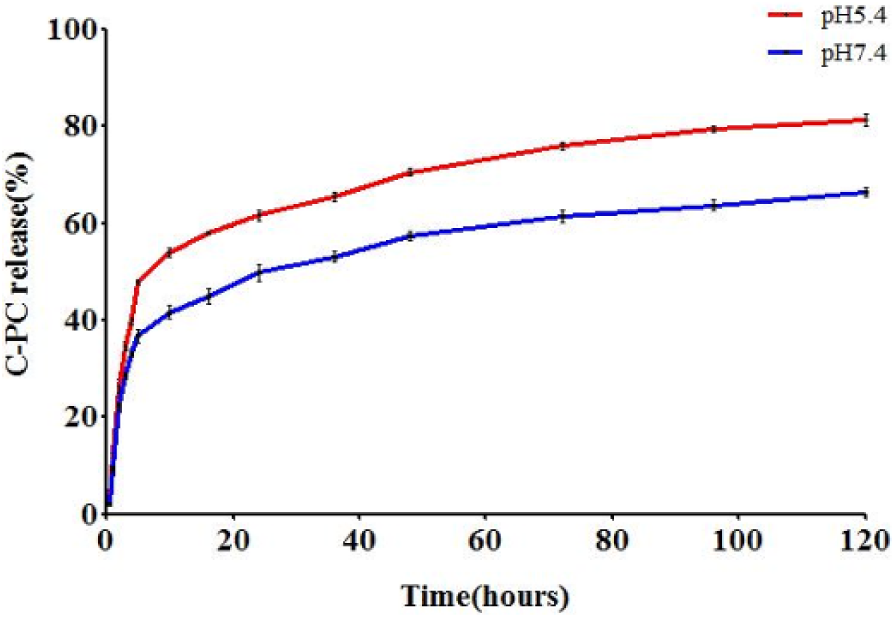
Release rates of C-PC from C-PC/CMC NPs at pH 5.4 and pH 7.4. In the first 5 h, the C-PC was quickly released from C-PC/CMC NPs and later the release rate slowly increased, and finally reached a balance and sustained at 80% C-PC release rate. In addition, the release rate of C-PC at pH 5.4 was lower than that at pH 7.4 when the detection time was same.
Cytotoxicity studies
Different C-PC formulations inhibited the growth of HeLa cells in a dose-dependent manner. With an increase in dose, the inhibition ratio was clearly enhanced. C-PC/CMC-CD59sp NPs had a higher inhibitory effect than other groups, indicating that the targeting by CD59sp improved drug efficacy (Figure 4(a) and (b)). Compared with L929 cells, the rates of inhibition by target NPs showed statistically significant differences in HeLa cells (Figure 4(c)). The IC50 values for C-PC, C-PC/CMC NPs, and C-PC/CMC-CD59sp NPs were 155.20, 58.08, and 21.46 µg/mL, respectively.

Inhibition ratio of different drugs on L929 and HeLa cells. (a) Inhibition ratio of L929 cells treated with different drugs. With an increase of drug dose, the inhibition ratio was clearly enhanced. Moreover, C-PC/CMC-CD59sp NPs had a higher inhibitory effect than other groups. (b) Inhibition ratio of HeLa cells treated with different drugs. Compared with control group, different drugs had different inhibition efficiency on HeLa cells. The C-PC/CMC NPs and C-PC/CMC-CD59sp NPs had higher inhibitory effects than C-PC treatment. The differences were significant (p < 0.05). (c) Inhibition ratios of L929 and HeLa cells treated by C-PC/CMC-CD59sp NPs. Compared with L929 cells, the rates of inhibition by target NPs showed statistically significant differences in HeLa cells.
Hemolysis assay
It is mandatory to evaluate the safety of NPs because these will enter the blood via intravenous injection. Hemolysis was measured using the HR value, where a smaller value indicates better hemocompatibility of a drug. The results reveal that the treatment group showed no obvious hemolytic activity compared with the positive control group (Figure 5(a)). As shown in Figure 5(b), C-PC, C-PC/CMC NPs, and C-PC/CMC-CD59sp NPs showed little hemolysis even at a high concentration of 1.0 mg/mL. These results indicated that C-PC/CMC-CD59sp NPs were hemocompatible and safe for biomedical application as drug carriers.

Hemolysis of RBCs. (a) Images of RBCs hemolysis in the presence of C-PC, C-PC/CMC NPs, and C-PC/CMC-CD59sp NPs. Compared with the positive and negative control groups, there was no obvious RBCs hemolysis phenomenon in three drug treatment groups. (b) Hemolysis percentage of treated RBCs. C-PC, C-PC/CMC NPs, and C-PC/CMC-CD59sp NPs showed little hemolysis even at a high concentration of 1.0 mg/mL.
Cell uptake studies
The L929 cells uptake of targeted NPs were observed after 1, 2, and 4 h (Figure 6(a)–(c)) and HeLa cells were observed after 1 h (Figure 6(d)). The cellular uptake in the two cells was significantly different. A higher cellular uptake was observed in HeLa cells at 1 h than in L929 cells at 4 h, indicating that CD59sp on the NP surface interacted with CD59, which is overexpressed on HeLa cells. After 4 h incubation, most of the red fluorescence was observed in the cytoplasm in L929 cells. However, after 1 h incubation, the red fluorescence was observed in both the cytoplasm and the nucleus of HeLa cells, which indicated that the NPs were highly targeted and had enhanced penetrability in HeLa cells.
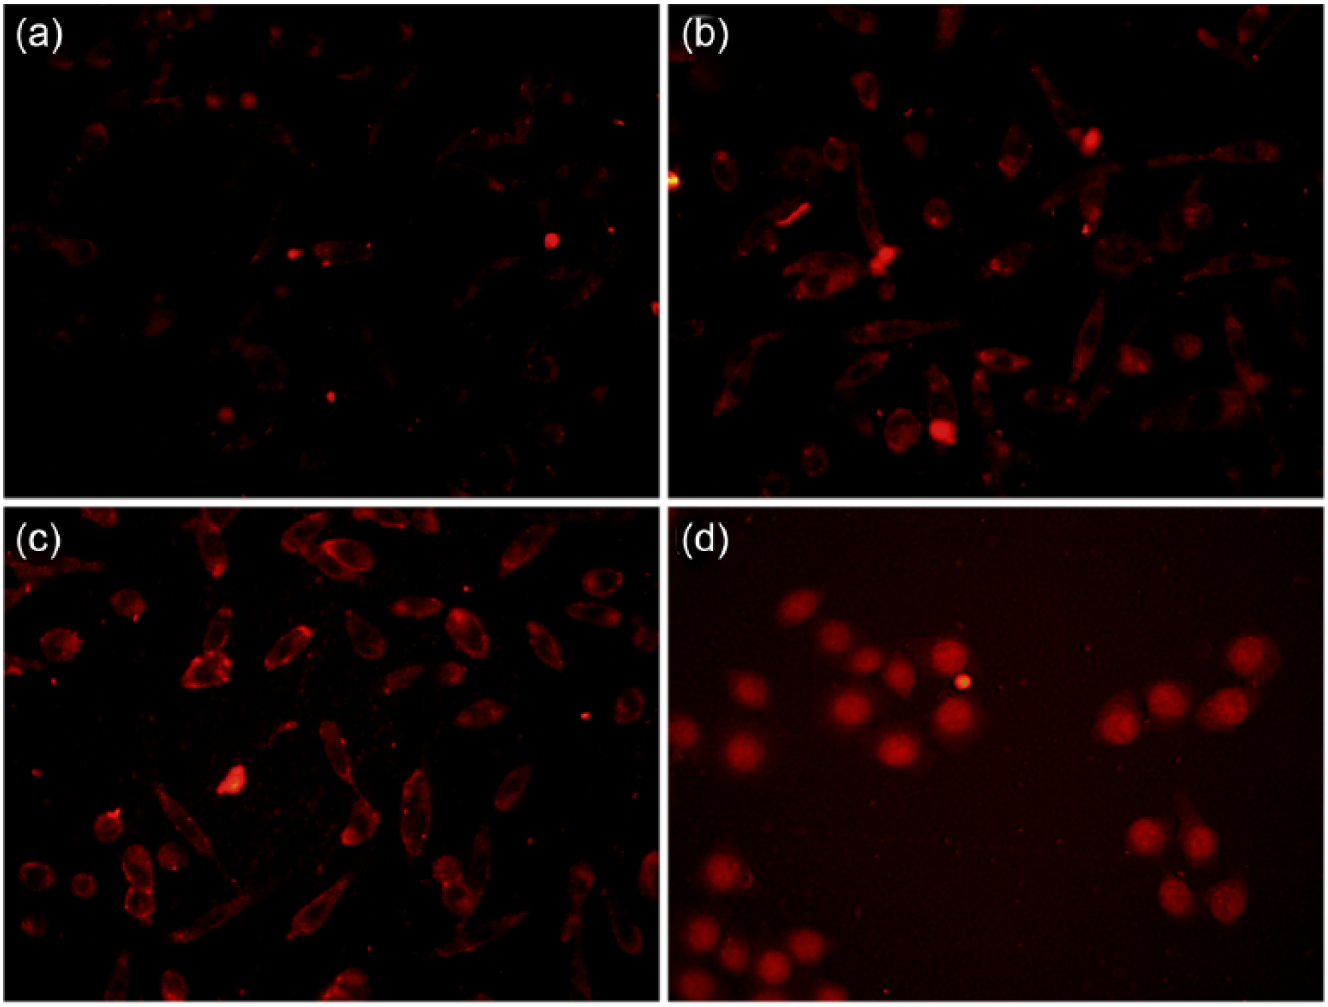
The intracellular localization and uptake of C-PC/CMC-CD59sp NPs. (a–c) L929 cells incubated for 1, 2, and 4 h, and (d) HeLa cells incubated for 1 h. The cellular uptake in the L929 and HeLa cells was significantly different. A higher cellular uptake was observed in HeLa cells at 1 h than in L929 cells at 4 h. After 4 h incubation, most of the red fluorescence was observed in the cytoplasm in L929 cells. However, after 1 h incubation, the red fluorescence was observed in both the cytoplasm and the nucleus of HeLa cells.
Expression of Caspase-3/cleaved Caspase-3/PARP/cleaved PARP proteins
As shown in Figure 7, compared with the control group, the expression of cleaved caspase-3 and cleaved PARP proteins was significantly increased in experimental groups. Meanwhile, the cleaved caspase-3/PARP expression of target NPs showed statistically significant differences across different experimental groups (Figure 7(b), *p < 0.05, **p < 0.01). But procaspase-3 and PARP proteins were of no significant changes in different groups. These results indicated that target NPs promoted cleavage of caspase-3/PARP proteins expression in HeLa cells and further enhanced cell death.

Expression of PARP/cleaved PARP and procaspase-3/cleaved caspase-3 in HeLa cells. Compared with the control group, the expression of cleaved caspase-3 and cleaved PARP proteins was significantly increased in experimental groups. Meanwhile, the cleaved caspase-3/PARP expression of target NPs showed statistically significant differences across different experimental groups. However, procaspase-3 and PARP proteins were of no significant changes in different groups. (a) Electrophoretogram of target protein and β-actin in HeLa cells. 1: Control group; 2: C-PC treatment group; 3. CMC/C-PC NPs treatment group; 4. CMC/C-PC-CD59sp NPs treatment group (Target group). (b) The gray-scale ratio of target protein/β-actin.
Bcl-2 protein expression
The fluorescence intensity represents the amount of Bcl-2 protein expression. Univariate analysis showed significant differences between the experimental groups and the control group (p < 0.01, Figure 8(A)). In addition, target NPs group showed statistically significant differences compared with other experimental groups (Figure 8(B)). These results indicated that target NPs inhibited Bcl-2 expression in HeLa cells and further enhanced anticancer effects.
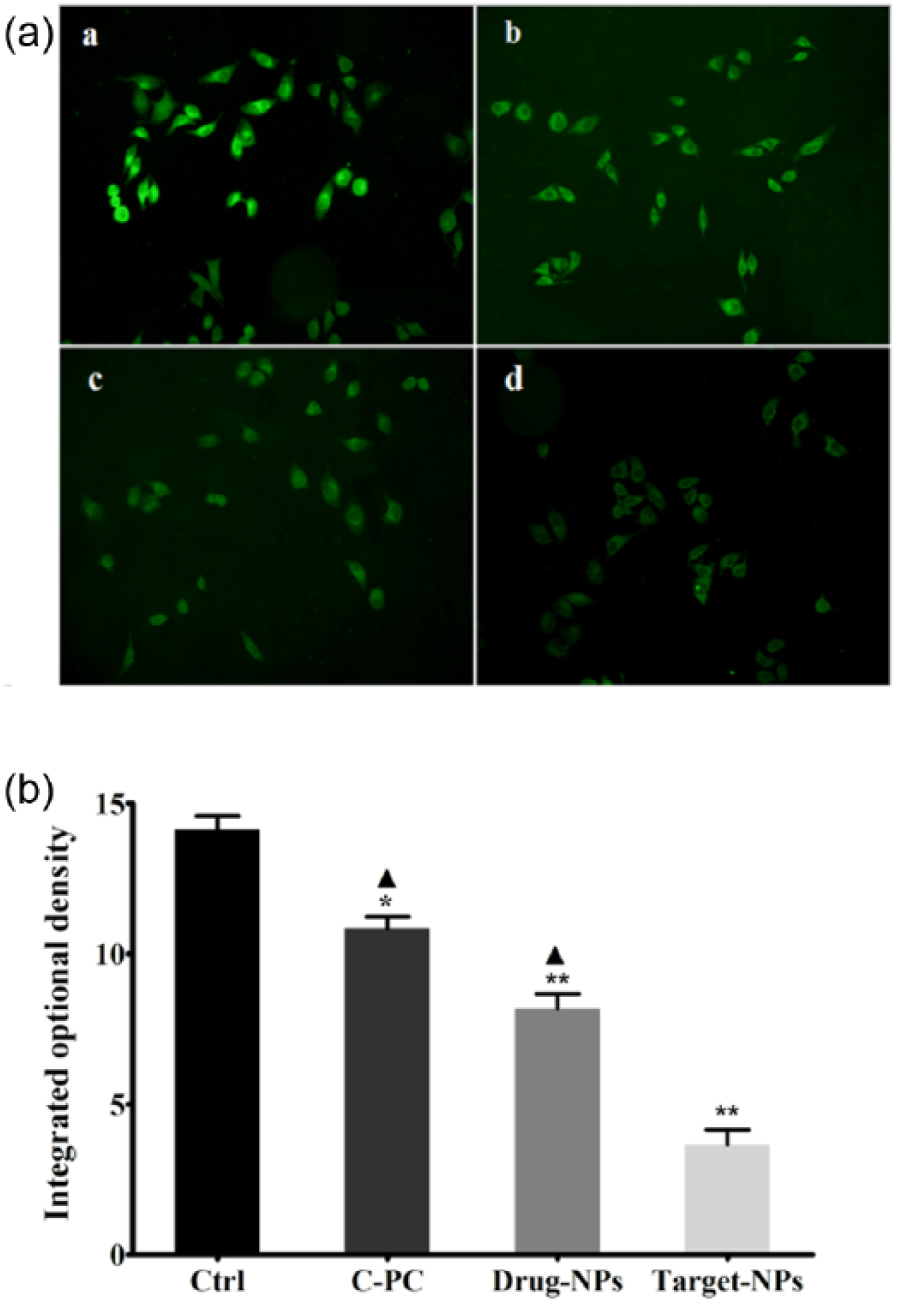
Expression of Bcl-2 proteins in HeLa cells. There were significant differences between the experimental groups and the control group. In addition, target NPs group showed more inhibitory effects on Bcl-2 protein expression than other experimental groups. (A) Immunofluorescent images: (a) Control group, (b) C-PC treatment group, (c) CMC/C-PC NPs treatment group, and (d) CMC/C-PC-CD59sp NPs treatment group. (B) The integrated optical density.
Discussion
Cancer is a serious threat to human health and life, but a number of anti-tumor medicines cannot be used widely in clinical treatment because of their serious side effects and short effective half-lives in vivo. The combination of nanotechnology and medicine offers a promising approach to solving these problems, and many reports have proven the anticancer efficacy of NPs loaded with drugs in vivo and in vitro toward various types of cancer. 16 Snima et al. 17 reported O-CMC-metformin NPs can increase anticancer effects toward pancreatic cancer cells, while the combinatorial anticancer effects of 5-fluorouracil and curcumin-loaded N,O-CMC NPs toward colon cancer cells were demonstrated by Anitha et al. 18
We previously confirmed that C-PC has anti-tumor biological effects, but the low bioavailability and short half-life of C-PC are the most significant limits to its anticancer application. In our study, C-PC-loaded CMC NPs were successfully obtained using the ionic-gelation method. The average size of the C-PC/CMC NPs, measured by DLS, was about 200 nm and they displayed good stability. The EE and LE of C-PC/CMC NPs were high. The release profile of the drug in vitro indicated a slow release, which may have been caused by Fickian diffusion of the drug and degradation of the NP polymer. In brief, NPs encapsulating hydrophilic C-PC showed sustained anticancer activity and improved stability over C-PC alone. The hemocompatibilities of NPs indicated that they are safe for potential biomedical applications.
MTT assay results indicated the NPs could inhibit the growth of HeLa cells. Half of the IC50 value was used as the optimal concentration during experiments. The CD59sp targeted NPs showed higher cellular uptake and enhanced cytotoxicity in HeLa cells. Furthermore, they induced apoptosis of HeLa cells by upregulation of pro-apoptotic cleaved caspases-3/PARP proteins and downregulation of anti-apoptotic Bcl-2 expression, promoting the apoptotic signal initiation and finally leading to apoptosis.
Tumor-targeting NPs loaded with anti-tumor drugs are currently a hot topic, and exclusively expressed and overexpressed proteins on cancer cells are considered to be useful molecular markers. 12 Maya et al.’s 19 studies developed cetuximab-conjugated O-carboxymethyl chitosan NPs for targeted delivery of paclitaxel to epidermal growth factor receptor, which is overexpressed in cancer cells. Zhang et al.’s 20 studies showed N-succinyl-chitosan NPs coupled with low-density lipoprotein for targeting osthole-loaded delivery to low-density lipoprotein receptor–rich tumors.
We successfully synthesized a drug-delivery system comprising C-PC-loaded CMC NPs, targeted by inclusion of CD59sp. The targeting NPs were proved to possess the targeting, slow-release property and safety. The anti-tumor effects of NPs were realized by inhibiting HeLa cells proliferation, inducing cells apoptosis. This provides a new idea for the research and development of marine drugs, and theoretical support for the targeted therapy of anticancer drugs.
Footnotes
Declaration of conflicting interests
The author(s) declared no potential conflicts of interest with respect to the research, authorship, and/or publication of this article.
Funding
This work was supported by grants from the National Natural Science Foundation of China (81471546, 81001346, and 81273206).