
Abstract
Non–small cell lung cancer is the most common malignancy in males; it constitutes the majority of lung cancer cases and requires massive medical resources. Despite improvements in managing non–small cell lung cancer, long-term survival remains very low. This study evaluated survival improvement in patients with non–small cell lung cancer in each decade between 1983 and 2012 to determine the impact of race, sex, age, and socioeconomic status on the survival rates in these patients. We extracted data on non–small cell lung cancer cases in each decade between 1983 and 2012 from the Surveillance, Epidemiology, and End Results registries. In total, 573,987 patients with non–small cell lung cancer were identified in 18 Surveillance, Epidemiology, and End Results registry regions during this period. The 12-month relative survival rates improved slightly across three decades, from 39.7% to 40.9% to 45.5%, with larger improvement in the last two decades. However, the 5-year-relative survival rates were very low, with 14.3%, 15.5%, and 18.4%, respectively, in three decades, indicating the urgency for novel comprehensive cancer care. In addition, our data demonstrated superiority in survival time among non–small cell lung cancer patients of lower socioeconomic status and White race. Although survival rates of non–small cell lung cancer patients have improved across the three decades, the 5-year-relative survival rates remain very poor. In addition, widening survival disparities among the race, the sex, and various socioeconomic status groups were confirmed. This study will help in predicting future tendencies of incidence and survival of non–small cell lung cancer, will contribute to better clinical trials by balancing survival disparities, and will eventually improve the clinical management of non–small cell lung cancer.
Keywords
Introduction
According to the World Cancer Report 2014 released by the World Health Organization, lung cancer accounted for the most cancer cases and was the leading cause of death in males. Among females, lung cancer was the leading cause of cancer-related deaths in more developed countries and the second leading cause of cancer-related deaths in less developed countries. 1 The prognosis for lung cancer is poor, with a 5-year-relative survival rate (RSR) of 18.0% between 2005 and 2011. 2
Improving the treatment of non–small cell lung cancer (NSCLC), which makes up the majority of lung cancer cases, has long been the research focus of scientists and physicians. Improvements in the use of surgery, chemotherapy, and radiotherapy in NSCLC have led to improved survival benefit; this study evaluated these changes across three decades (1983–1992, 1993–2002, and 2003–2012) with the use of Surveillance, Epidemiology, and End Results (SEER) database.3,4 Although previous studies have investigated NSCLC outcomes, they tended to evaluate subgroups of patients, such as patients from specific regions, of specific ages, or who underwent surgery, or to focus on the effects of specific histological type or stage on survival.5–11
In addition, accumulating evidence of significant racial and socioeconomic status (SES) disparities in the U.S. health care system has been attracting increased attention. We used period analysis in this study to demonstrate the shift in survival time in each decade between 1983 and 2012 and to determine the impacts of race, sex, age, and SES on the survival rates in patients with NSCLC, using data from the SEER program of the National Cancer Institute.
Methods
Data collected from the SEER program
All data of patients with NSCLC between 1983 and 2012 were accessed from the SEER program. We also obtained incidence data from the original 9 SEER sites and survival data from 18 SEER sites respectively.
Categorized NSCLC cases over the course of three decades
SEER*Stat software, version 8.3.2 was used for all data collection and frequency and survival analysis (The Surveillance Research Program of the Division of Cancer Control and Population Sciences, National Cancer Institute and information Management Services, Inc., Calverton Boulevard, Calverton, MD, USA). Patient inclusion criteria were the SEER site recode, International Classification of Diseases for Oncology—Third Edition (2008), Lung and Bronchus (C34.0-C34.9), and the years of diagnosis from 1983 through 2012. NSCLC cases were histologically defined by the following International Classification of Diseases for Oncology—Third Edition histology codes for malignant cases with the following groups: adenocarcinoma (8140, 8141, 8143, 8147, 8250–8255, 8260, 8310, 8430, 8480, 8481, 8490, 8570, 8571, 8572, 8573, 8574), squamous cell carcinoma (8052, 8070–8078), adenosquamous cell carcinoma (8560), large cell carcinoma (8012, 8013), carcinoma not otherwise specified (NOS; 8010, 8046, 8050, 8051, 8575), and undifferentiated (8020).
We analyzed incidence and RSR data between 1983 and 2012, after dividing this range into three decades (1983–1992, 1993–2002, and 2003–2012). In addition, patients were stratified by race, sex, age, and SES. We excluded the cases of NSCLC that had been diagnosed at autopsy or reported only on a death certificate. We defined the various SES groups as described previously; briefly, SES was defined by the county poverty rate and was categorized into three levels. 12
Incidence and survival data analysis
Incidence and RSR data were obtained from SEER*Stat software, version 8.3.2 and were processed as previously described. Briefly, incidence data were calculated per 100,000 persons and RSR referred to deaths attributed directly to NSCLC. 12 Kaplan–Meier curves were constructed by GraphPad Prism 6.0 (GraphPad Software, Inc., San Diego, CA, USA), and differences between the curves were assessed by a two-tailed log-rank test. A two-tailed p value of < 0.01 was considered to be statistically significant.
Cox regression and Spearman’s rank correlation analyses
Only White and Black patients were included for Cox regression analysis. In addition, the original high-poverty group and medium-poverty group were redefined as a new “med-high-poverty group” for this analysis. Ages were divided into five groups, as previously discussed. Spearman’s rank correlation analysis was performed because race was not normally distributed. Stata/MP 14 software (StataCorp, College Station, TX, USA) was used for Cox regression analysis and Spearman’s rank correlation analysis. A two-tailed p value of < 0.01 was considered to be statistically significant.
Results
Trends in NSCLC incidence at the nine original SEER sites over three decades
To maintain consistency among the registry sites surveyed across three decades and thereby improve incidence data comparability across this period, we extracted incidence data at the nine original registry sites in the SEER program of the National Cancer Institute. We identified a total of 293,471 patients diagnosed with NSCLC between 1983 and 2012. As shown in Figure 1 and Supplementary Table S1, the total incidence of NSCLC between 2003 and 2012 was lower (34.8 per 100,000) than that between 1993 and 2002 (41.3 per 100,000), which was further lower than that between 1983 and 1992 (44.6 per 100,000). A similar tendency can be found in most age groups except for the group older than 75 years, in which the incidence of NSCLC continued to increase over the three decades. In the first decade, the highest incidence was found in the group aged 60–74 years, with 194.7 cases per 100,000. However, in the last two decades, the highest incidences were in the group older than 75 years, with 207.1 cases per 100,000 in the second decade and 208.7 per 100,000 in the third decade; these rates were higher than those aged 60–74 years, with an incidence of 187.3 cases per 100,000 in the second decade and 146.8 per 100,000 in the third decade. However, the number of NSCLC cases remained relatively stable in all groups except those in the group older than 75 years, in which the number of NSCLC cases kept increasing (Figure 1(b) and Supplementary Table S1). The NSCLC incidence per 100,000 decreased substantially in the groups of patients aged 45–59 and 60–74 years: from 60.9 in 1983–1992 to 44.5 in 1993–2002 to 33.3 in 2003–2012 in the 45–59 years group and from 194.7 in 1983–1992 to 187.3 in 1993–2002 to 146.8 in 2003–2012 in the 60–74 years group, respectively (Figure 1(a) and Supplementary Table S1). Males showed substantially higher incidence of NSCLC per 100,000 than did females (67.0 vs 28.2 in 1983–1992, 54.5 vs 31.6 in 1993–2002, and 41.5 vs 29.7 in 2003–2012; Figure 1(c) and Supplementary Table S1). In addition, the gaps in incidence between both the sex over the three decades continued to decrease because of the declining incidence in males and the relatively stable incidence in females. Although the number of male NSCLC patients was larger than that of their female counterpart in each decade, the number of males continued to decrease whereas the number of females continued to increase (Figure 1(d)).

Summary of incidences of patients diagnosed as having NSCLC between 1983 and 2012 at the original nine SEER sites. (a) Incidence and (b) number of NSCLC cases are shown by age group (total and ages: 0–29, 30–44, 45–59, 60–74, and 75+ years) and calendar period. Incidence and number of NSCLC cases are grouped by (c and d) sex, (e and f) SES, and (g and h) race, respectively.
NSCLC occurrence by SES and by race
As illustrated in Figure 1(e) and (f) and Supplementary Table S1, the incidence rates across the three SES groups decreased over the three decades. The medium-poverty group showed the highest incidences of NSCLC (from 46.5 in 1983–1992 to 42.8 in 1993–2002 to 36.3 in 2003–2012), sharing a similar incidence with the low-poverty group (from 43.7 in 1983–1992 to 40.8 in 1993–2002 to 34.4 in 2003–2012). The high-poverty group showed the lowest incidence rates (from 30.8 in 1983–1992 to 30.1 in 1993–2002 to 25.4 in 2003–2012). The numbers of NSCLC patients in the various SES groups remained relatively stable or even increased slightly due to the increasing size of the overall population (Figure 1(f)).
The incidence per 100,000 patients across three racial groups decreased in the three decades, with Blacks having higher NSCLC incidence during the three decades than the Whites or Others. The incidence gaps between Whites and Blacks kept narrowing throughout the three decades (from 20.7 in 1983–1992 to 15.5 in 1993–2002 to 11.5 in 2003–2012), and a similar narrowing of gaps was seen between Blacks and Others (Figure 1(g) and Supplementary Table S1.). The numbers of NSCLC patients in the various racial groups remained relatively stable or even increased slightly due to the growing overall population (Figure 1(h)).
Relative survival estimates for the 18 SEER sites over three decades
We identified 573,987 patients diagnosed with NSCLC between 1983 and 2012 at 18 registry sites, with median survival improving in each decade, from 9 months to 10 months to 11 months.
RSRs (Table 1 and Figure 2(a)) and survival times improved each decade for patients with NSCLC in most age groups except for the 0–29 years group. The 12-month RSR improved significantly, from 39.7% to 40.9% to 45.5% over the three decades, with a 3.0% increase in the first two decades and an 11.2% increase in the last two decades (p < 0.0001). The improvement in RSR over three decades was noted within a follow-up period of up to 5 years. Significant increases in survival time over the three decades in the total population and in the 30–44, 45–59, 60–74, and 75+ years age groups were also observed in a Kaplan–Meier survival analysis (p < 0.0001; Figure 2(b)). However, the long-term survival rate was still very low, with a 5-year RSR of 14.3% to 15.5% to 18.4% in each decade.
RSRs of NSCLC patients during the periods 1983–1992, 1993–2002, and 2003–2012 at 18 SEER sites.

RSR: relative survival rate; NSCLC: non–small cell lung cancer; SEER: Surveillance, Epidemiology, and End Results; mo: month.
Data are mean ± standard error of the mean, with number of patients in parentheses.
p < 0.01, **p < 0.001, and ***p < 0.0001 for comparisons with the preceding decade.

Trends in (a) 5-year-relative survival rates and (b) Kaplan–Meier survival analyses for patients with NSCLC at 18 SEER sites between 1983 and 2012 according to age group (total and ages: 0–29, 30–44, 45–59, 60–74, and 75+ years) and calendar period.
Both the sex showed improvement in overall survival over the three decades (Table 2 and Figure 3(a)). In the first decade, superiority in 12-month RSR was observed in females (42.8% vs 38.0%; p < 0.0001), and this survival superiority continued to increase in the following decades (44.4% vs 38.3% in 1993–2002 and 49.7% vs 42.0% in 2003–2012; Table 2). A similar trend can be seen in the 6-month and 36-month RSRs (Supplementary Table S2 and Figure S1). Furthermore, significantly higher survival rates and increasing survival superiority in females were confirmed by Kaplan–Meier survival analysis (p < 0.0001; Supplementary Figure S2).
Twelve-month RSR of NSCLC patients according to sex, age group, and calendar period from 1983 to 2012 at 18 SEER sites.
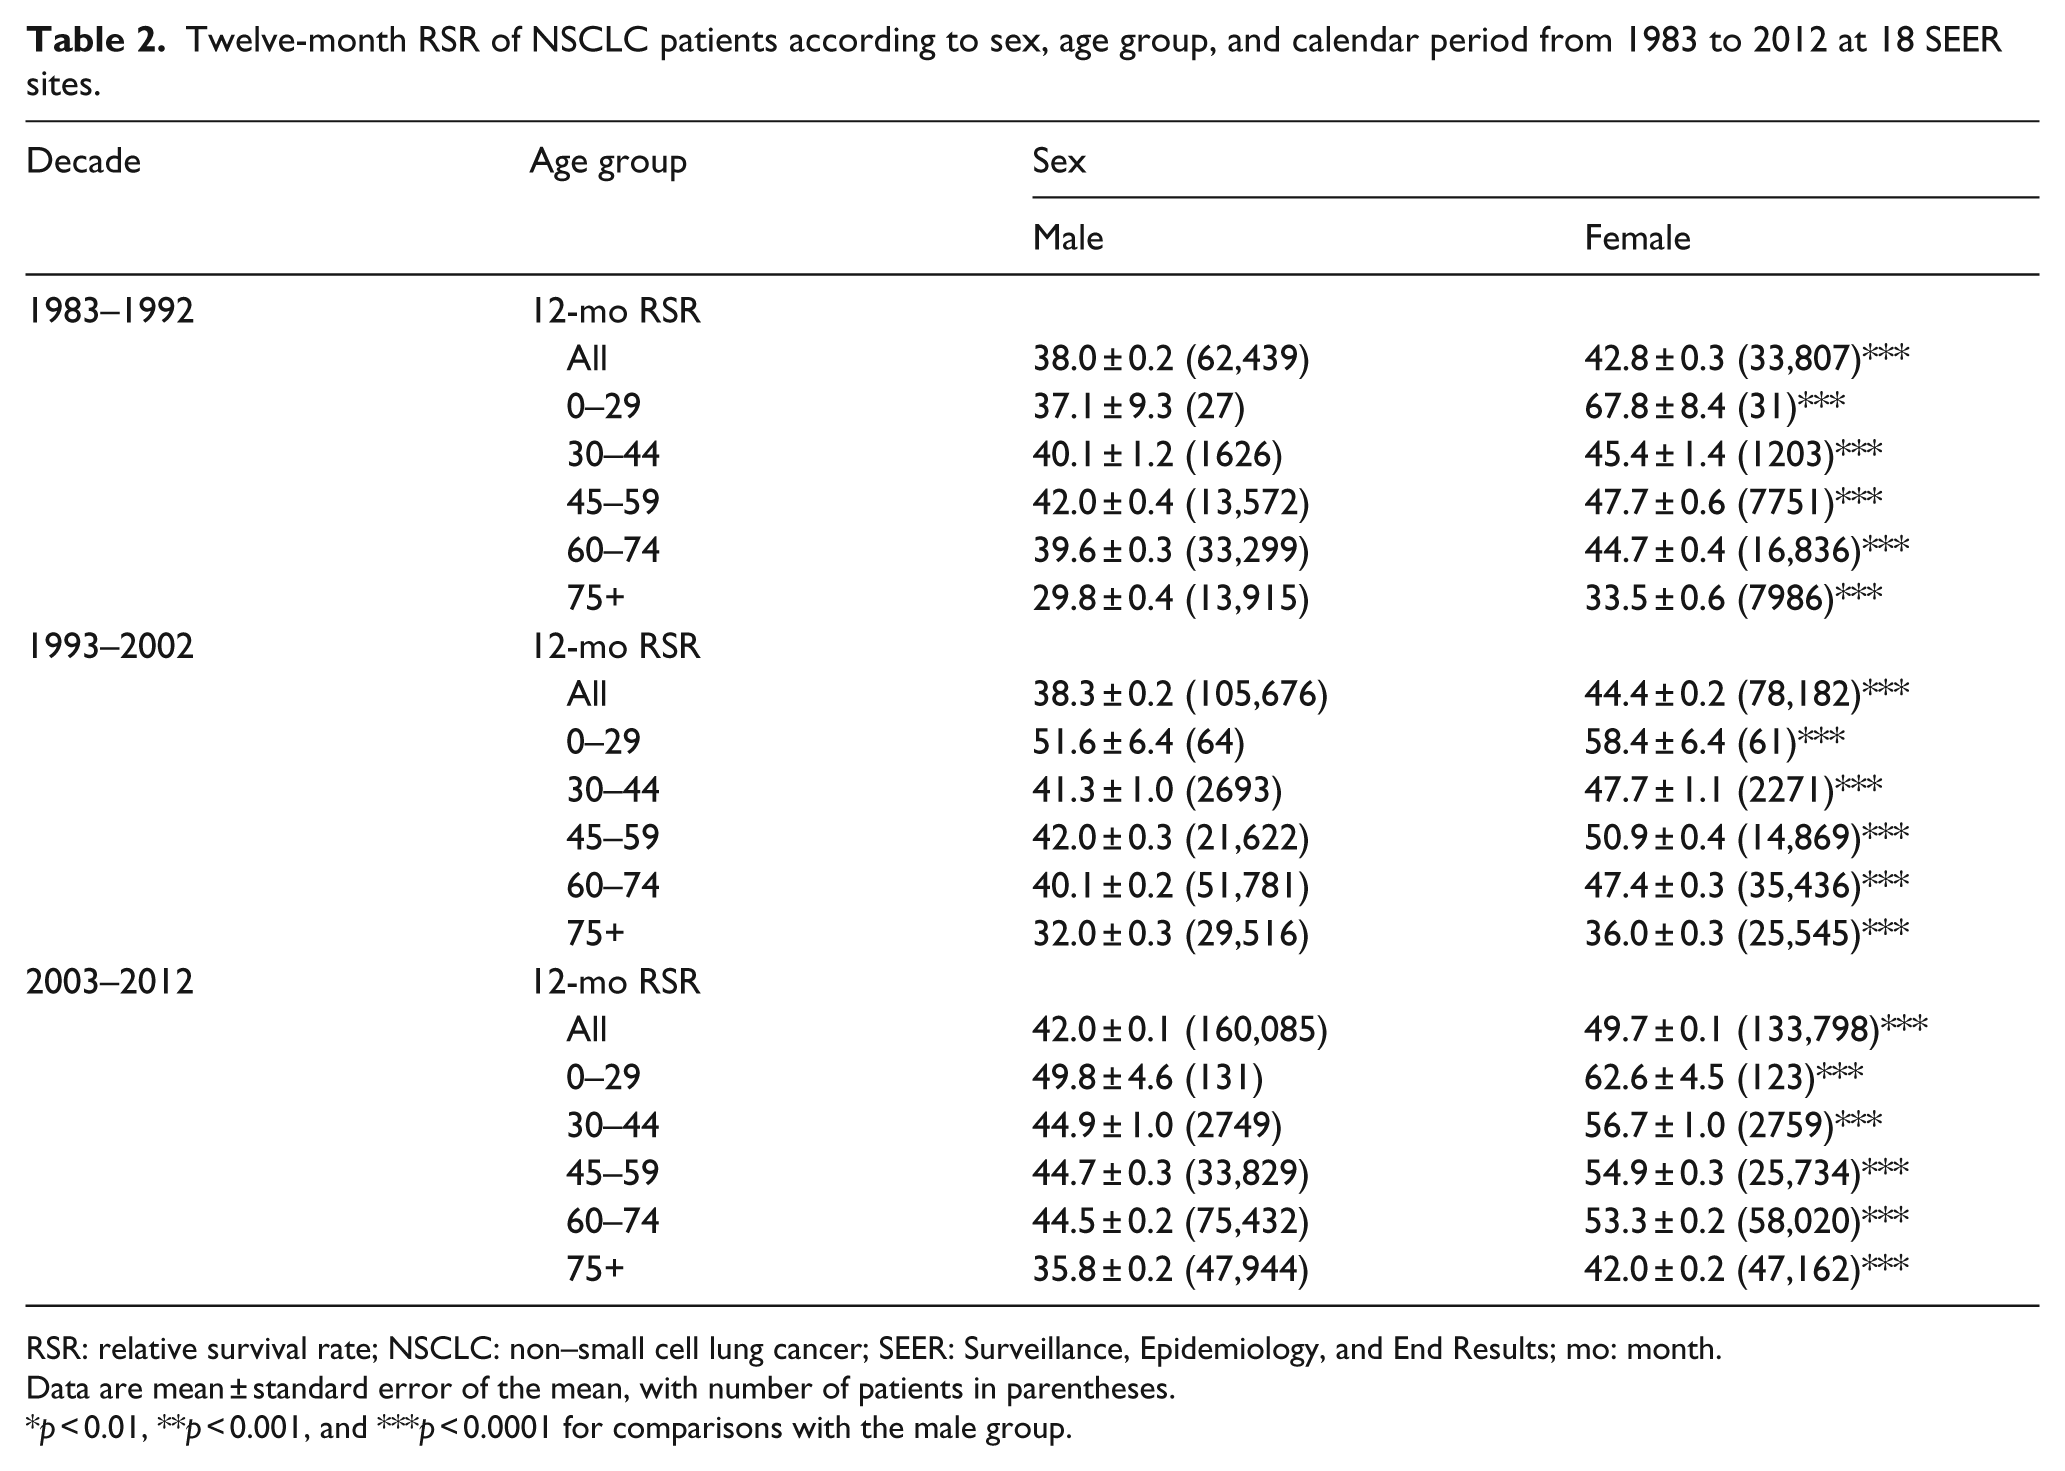
RSR: relative survival rate; NSCLC: non–small cell lung cancer; SEER: Surveillance, Epidemiology, and End Results; mo: month.
Data are mean ± standard error of the mean, with number of patients in parentheses.
p < 0.01, **p < 0.001, and ***p < 0.0001 for comparisons with the male group.

(a) Twelve-month-relative survival rates from 1983 to 2012 (b) and Kaplan–Meier survival analyses from 1983 to 2012 for patients with NSCLC at 18 SEER sites according to sex by age group (total and ages: 0–29, 30–44, 45–59, 60–74, and 75+ years).
In addition, survival differences were more pronounced in some age groups (Table 2 and Figure 3(a)). Females showed a significantly higher 12-month RSR than did males in patients aged 45–59 years in each decade (47.7% vs 42.0% in 1983–1992, 50.9% vs 42.0% in 1993–2002, 54.9% vs 44.7% in 2003–2012; p < 0.0001 for each). Similar survival advantage in females was found in patients aged 30–44 years (45.4% vs 40.1% in 1983–1992, 47.7% vs 41.3% in 1993–2002, and 56.7% vs 44.9% in 2003–2012; p < 0.0001 for each). However, the survival superiority in females was less obvious in the 60–74 years group and 75+ years group than in the 45–59 years group. A similar trend in RSR differences between both the sex was noted in 6-month and 36-month RSRs (Supplementary Table S2 and Figure S3). Kaplan–Meier survival analyses of the three decades confirmed a significant age-dependent RSR difference between both the sex in most age groups, except for the 0–29 years group (p = 0.0881 for 0–29 years group and p < 0.0001 for the rest; Figure 3(b)).
Furthermore, Cox regression analyses of overall survival showed that age, SES, race, and sex were significantly associated with overall survival over the three decades and in each decade analyzed (p < 0.001; Table 3). Females with a hazard ratio (HR) of 0.828 were associated with lower risk of death during the three decades, and the risks continued to decrease each decade, with the HR decreasing from 0.865 to 0.845 to 0.818, with males as the reference. In addition, older age (HR = 1.229), Blacks (HR = 1.120), and med-high-poverty (HR = 1.062) were associated with higher risks of death across the three decades, and the risk of death in Blacks and med-high-poverty increased each decade, with HRs increasing from 1.105 to 1.116 to 1.130 and from 1.056 to 1.068 to 1.095, with younger age, Whites, and low-poverty as references, respectively.
Summary data for Cox regression analysis of survival in patients with NSCLC in each decade from 1983 to 2012 at 18 SEER sites.

NSCLC: non–small cell lung cancer; SEER: Surveillance, Epidemiology, and End Results; CI: confidence interval; SES: socioeconomic status.
NSCLC survival by race and by SES
White patients showed a significantly higher 12-month RSR than did Black patients during 1983–1992 (39.9% vs 37.7%; p < 0.0001; Figure 4(a) and Table 4). This survival advantage in White patients was more obvious in the second decade (41.1% vs 38.2%; p < 0.0001) and in the third decade (45.5% vs 42.2%; p < 0.0001). A widening survival difference can also be found in 6-month and 36-month RSR (Supplementary Table S3).

(a) The 6-month, 12-month, and 36-month-relative survival rates according to race. (b) SES/county-level poverty rates. (c) Kaplan–Meier survival analysis according to race. (d) SES/county-level poverty rates for patients with NSCLC at 18 SEER sites from 1983 to 2012.
Twelve-month RSR of NSCLC patients according to race, age group, and calendar period from 1983 to 2012 at 18 SEER sites.

RSR: relative survival rate; NSCLC: non–small cell lung cancer; SEER: Surveillance, Epidemiology, and End Results; mo: month.
Data are mean ± standard error of the mean, with number of patients in parentheses.
p < 0.01, **p < 0.001, and ***p < 0.0001 for comparisons with the White group.
After being stratified by SES, the low-poverty group showed the highest 12-month RSR, whereas the lowest 12-month RSR was found in the high-poverty group. Similar RSR differences among different SES groups could also be found in the 6-month RSR and 36-month RSR (Figure 4(b), Table 5, and Supplementary Table S4). All SES groups have shown improvement in RSR over the three decades. In addition, statistically significant difference in RSR among the three SES groups could be found over the three decades (p < 0.0001 for each); more importantly, the survival gaps among the various SES groups widened in each decade. It is noteworthy that there was a higher percentage of low-poverty individuals among White patients than among Black patients (43.7% vs 18.1%) and a higher percentage of medium-poverty individuals among Black patients than among White patients over the three decades (70.9% vs 48.9%; Supplementary Figure S4 and Table S5). The correlation between race and SES was illustrated by Spearman’s rank correlation coefficient of 0.173 with p < 0.001. Indeed, the survival difference between Whites and Blacks reflected their different distribution in SES. In addition, significant survival differences between Whites and Blacks were confirmed by Kaplan–Meier survival analysis (p < 0.0001; Figure 4(c)). Similarly, significant survival differences between the three SES groups were also confirmed by Kaplan–Meier survival analysis (Figure 4(d)).
Twelve-month RSR of NSCLC patients according to SES, age group, and calendar period from 1983 to 2012 at 18 SEER sites.

RSR: relative survival rate; NSCLC: non–small cell lung cancer; SES: socioeconomic status; SEER, Surveillance, Epidemiology, and End Results; mo: month.
Data are mean ± standard error of the mean, with number of patients in parentheses.
p < 0.01, **p < 0.001, and ***p < 0.0001 for comparisons with the low-poverty group.
Discussion
In this study, our data demonstrated that the incidence of patients with NSCLC continued to decrease during the three decades, whereas the RSR improved in each decade, with median survival increasing from 9 to 10 to 11 months across the three decades. RSR disparities in the sex, race, and various SES groups were observed, and, more importantly, these disparities widened over the three decades.
We found that the incidence of NSCLC decreased each decade in the total population analyzed and in most age groups except for the 75+ years group, in which the incidence increased each decade. Risk factors for NSCLC cover a broad spectrum of conditions, including tobacco consumption, outdoor pollution, and exposure to occupational and environmental carcinogens, such as asbestos, arsenic, radon, and polycyclic aromatic hydrocarbons.13,14 Epidemiology studies revealed that variation of lung cancer rates and trends reflected the changing trends of tobacco use.15–17 In the United States, comprehensive tobacco control programs have markedly lowered smoking rates and reduced lung cancer occurrence.18,19
Although the RSR of patients with NSCLC improved each decade, long-term survival remained at a low level. There were several reasons for the slight survival improvement. First, more than 74.6% of NSCLC patients were older than 60 years when diagnosed; thus organ function was relatively poor, indicating that they were not strong enough to endure radical treatment. More importantly, the incidence peak shifted from 60–74 to 75+ years in the last two decades, indicating that the NSCLC population was aging. Second, the treatment had certain limitations, including lack of effective chemotherapy drugs, limitation of radical surgery due to impaired lung function, and contraindicated conditions such as metastasis and invasion into vital organs such as the aorta.
In terms of sex, males showed a higher incidence of NSCLC than did females in each decade, whereas the incidence gap between both the sex continued to decline. It is noteworthy that the incidence of NSCLC in males decreased dramatically, whereas the incidence of NSCLC in females remained stable across the three decades. The slightly increased incidence of NSCLC in females can be attributed to the poorer outcome of tobacco cessation programs in females.20,21 We observed an improved survival rate over time in both the sex. Females had a significant 12-month survival advantage over males during the three decades. Survival advantage in females could be attributed primarily to the fact that the dominant pathological type is adenocarcinoma, which is usually peripherally located. Compared with squamous cell carcinoma, a higher percentage of adenocarcinoma harbors mutations that can be clinically targeted by molecular-targeted agents such as the epidermal growth factor receptor (EGFR) mutation by EGFR-TKI (tyrosine kinase inhibitor) or cetuximab and anaplastic lymphoma kinase (ALK) mutation by crizotinib. In addition, the peripheral location of adenocarcinoma provides better postoperative survival than squamous cell carcinoma, as the squamous cell carcinoma is usually located centrally and easily invades vital organs such as the heart and aorta. Moreover, when patients were divided into different age groups, females showed higher 12-month survival rate than did males in each decade in any age group. Similar tendencies could also be found in the 6-month and 36-month RSRs. Kaplan–Meier survival analysis confirmed survival advantages in females in most age groups except the 0–29 years group (p = 0.0881 for the 0–29 years group and p < 0.0001 for the rest), and these survival advantages were more pronounced in the 30–44 years and 45–59 years groups. This age-related survival advantage and lower incidence of NSCLC in females may indicate behavioral disparities and intrinsic genomic differences between both the sex.
The incidence of NSCLC in all three races decreased each decade, with Blacks having a higher NSCLC incidence than Whites and Others. The incidence gap between Black and White groups started to shrink in the last two decades because of the more rapidly decreasing incidence in Blacks diagnosed in that period. Incidence disparities may be partly attributed to the different SES distribution between Blacks and Whites. Whites showed higher 6-month, 12-month, and 36-month survival rates than did Blacks. Kaplan–Meier survival analysis further confirmed the survival advantages in Whites with widening curves (p < 0.0001). Interestingly, a higher percentage of Black patients were categorized as high-poverty and medium-poverty than White patients were. Similar survival differences between the race and SES groups may have been due to the SES distribution between Blacks and Whites, since patients with fewer financial resources were believed to have been less likely to resort to proper medical care, ultimately leading to worse outcomes.
There were differences in the incidence of NSCLC among the various SES groups, with the highest incidence in the medium-poverty group, which shared a similar incidence with the low-poverty groups. The incidence of high-poverty group was dramatically lower than that of the medium-poverty group. The incidences of three different SES groups continued to decrease across the three decades. Lower incidence in the high-poverty group could have been due to lower consumption of cigarettes and living in less-industrialized regions where air was less polluted. Similarly, the low-poverty group showed the highest survival over the three decades, and the survival difference between low-poverty groups and medium-poverty groups widened over time, especially in the last two decades. Kaplan–Meier survival analysis showed significantly higher survival in the low-poverty group over the three decades (p < 0.0001 for each) than in the medium-poverty group, with widening curves. Lower RSRs in the high-poverty group were related to lower awareness of regular testing and therefore less likelihood to resort to medical care. Cox analysis confirmed the independent predictor roles of sex, age, race, and SES with higher risks of death in males, older age group, Blacks, and the med-high-poverty group. The increasing risks of death in males in these groups, demonstrated by changing HRs, were consistent with the widening Kaplan–Meier survival analysis curves.
In order to enroll patients who could best reflect the incidence and survival tendency of NSCLC, we included those who had been diagnosed with NSCLC for the first time and without prior malignancy and excluded those in whom NSCLC had been diagnosed by autopsy or by only death certificate. In this case, the incidence and survival rates, we calculated, were close to the real facts. In addition, we did not stratify patients by pathologic types or stages or clarify their relationship with survival because these were not the aims of this study, and the standards for staging and for determining pathologic types have been upgraded over time.
It should be noted that although we extracted a large sample size from the SEER database covering diverse populations, this study was limited by the fact that SEER data can reflect only the tendencies of selected areas and therefore were not applicable to other areas. Furthermore, this study may face bias and error from under-registration and misclassification. 22
In general, this study showed a decreasing incidence of NSCLC and slight improvement in survival time in patients with NSCLC. The incidence continued to decrease due to an effective tobacco control programs, improved protection from carcinogen, and so on; however, the medical burden caused by NSCLC remains huge due to massive numbers of NSCLC cases. Furthermore, despite the fact that prolonged progression-free survival could be achieved in many clinical trials such as IPASS, NEJ002, and OPTIMAL, improved overall survival could be barely seen in these studies. Therefore, comprehensive prevention measures must be implemented. Despite the fact that survival time improved each decade, long-term survival remains very low.
Analyzing the incidence and survival of NSCLC in the past three decades shows us the picture of previous clinical management of NSCLC and helps predict the future tendency of incidence and survival. The survival disparities between the sex, race, and various SES groups that were quantitatively evaluated in the study reveal the heterogeneity of NSCLC between these groups. This study will aid in promoting the design of clinical trials by balancing these disparities and thereby improving the clinical management of NSCLC.
Footnotes
Acknowledgements
S.W., T.S., H.S., and X.L. contributed equally to this work.
Declaration of conflicting interests
The author(s) declared no potential conflicts of interest with respect to the research, authorship, and/or publication of this article.
Funding
The author(s) disclosed receipt of the following financial support for the research, authorship, and/or publication of this article: This research was supported by the National Natural Science Foundation of China (81500030) and the Natural Science Foundation of Guangdong Province (2016A030313272 and 2016A030313277).
References
Supplementary Material
Please find the following supplemental material available below.
For Open Access articles published under a Creative Commons License, all supplemental material carries the same license as the article it is associated with.
For non-Open Access articles published, all supplemental material carries a non-exclusive license, and permission requests for re-use of supplemental material or any part of supplemental material shall be sent directly to the copyright owner as specified in the copyright notice associated with the article.