
Abstract
To understand the mechanism involved in gefitinib resistance, we established gefitinib-resistant human HCC827/GR-8-1 cell line from the parental HCC827 cell line. We compared the micro-RNA expression profiles of the HCC827 cells HCC827/GR-8-1 using Agilent micro-RNA microarrays. The micro-RNAs, such as the miR-149-5p, were up- or downregulated and associated with acquired gefitinib resistance. Quantitative real-time polymerase chain reaction was then performed to verify the expression patterns of different micro-RNAs. The result showed that miR-149-5p was upregulated in the HCC827/GR-8-1 cell line. To investigate the biological function of miR-149-5p in non–small cell lung cancer cells acquired gefitinib resistance, we examined cell proliferation using a cell counting kit-8 assay. Cell viability was evaluated after the miR-149-5p mimics, inhibitors, and negative control were separately transfected into the non–small cell lung cancer cells. The results showed that the non–small cell lung cancer cells transfected with miR-149-5p mimics exhibited reduced cell motility. The drug-sensitivity assay results revealed that the overexpression of miR-149-5p effectively evaluates the half maximal inhibitory concentration values of the cell in response to gefitinib, and the downregulation of miR-149-5p can attenuate the half maximal inhibitory concentration values of the cell lines in response to gefitinib. Furthermore, the levels of miR-149-5p in the HCC827 and HCC827/GR-8-1 cells were inversely correlated with caspase-3 expression. In conclusion, this study revealed that miR-149-5p is upregulated in the HCC827/GR-8-1 cells and involved in the acquired gefitinib resistance.
Introduction
Micro-RNA and lung cancer
Lung cancer is the main cause of cancer-related mortality. Approximately 80% of non–small cell lung cancer (NSCLC) patients were diagnosed at an advanced stage. 1 The mutations within the epidermal growth factor receptor (EGFR) gene were discovered in some NSCLC patients, especially East Asian female patients. Treatments targeting EGFR mutations, such as those caused by gefitinib, result in extended survival and increased quality of life of NSCLC patients. 2 However, most NSCLC patients developed resistance to gefitinib. 3 The long-term survival of NSCLC cancer patient with advanced high grade is limited by the occurrence of acquired resistance to chemotherapy. Acquired drug resistance remains the main stumbling block in cancer therapy. 4 However, the molecule mechanisms of gefitinib resistance remain unclear, and little is known about how lung cancer tissues develop resistance to initial treatment.
Thus, understanding the mechanisms underlying drug resistance is paramount to NSCLC therapy. Drug resistance is either intrinsic or acquired during therapy via variable biological mechanisms. Therefore, identifying biomarkers is fundamental to predict drug resistance and improve therapy efficiency.
Micro-RNAs (miRNAs) are a family of endogenous and small noncoding RNAs with 18–24 nucleotides in length. Presently, over 2500 potential human miRNAs are already identified, and this number is still expected to increase further in the future. 5 miRNAs are involved in post-transcriptional regulation of oncogenes or tumor suppressor genes. Thus, miRNA expressions are extensively examined in many cancer tissues and blood samples. Furthermore, the abnormal expression of miRNAs is widely investigated in numerous cancer types, including bladder cancer, 6 breast cancer, 7 gallbladder cancer, 8 and lung cancer. 9 Furthermore, miRNAs play a critical role in various cancer cellular processes, such as development, proliferation, apoptosis, migration, invasion, and drug resistance. 10
To identify the biological role of miRNAs in gefitinib-resistant cells, we examined the genome-wide miRNA expression in the parental HCC827 cells and gefitinib-resistant HCC827/GR-8-1 cells. Previous studies showed that miRNAs regulate the EGFR gene pathway and are a predictor of response to EGFR-tyrosine kinase inhibitor (TKI) therapy in cancer. Genomic-dysregulated miRNAs capable of downregulating EGFR offer more robust targets for EGFR-TKIs. 11 In this study, we investigated the expression profiles of miRNAs in gefitinib-resistant NSCLC cell line. We then attempted to investigate the role of miRNA in acquired gefitinib resistance.
Materials and methods
Reagents and cell culture
RPMI 1640 (Gibco, Life Technologies Corporation, NY, USA) were supplemented with 10% fetal bovine serum (FBS; Wisent, QC, Canada). Dimethyl sulfoxide (DMSO) was purchased from Sigma–Aldrich (St Louis, MO). Gefitinib (Iressa, Gef) was purchased from AstraZeneca UK Limited (Macclesfield, Cheshire, UK). Cell counting kit-8 (CCK-8) was purchased from Dojindo (Kumamoto, Japan). Penicillin-streptomycin solution was purchased from Gibco. The antibodies against casepase-3, β-actin, and Bcl-2 were purchased from Cell Signaling Technology (Danvers, MA). The gefitinib-sensitive human NSCLC cell lines (HCC827) were obtained from the Shanghai Institutes for Biological Sciences, China Academy of Cell Resource Center (Shanghai, China). The gefitinib-resistant HCC827/GR-8-1 cell lines were cultured in the cancer hospital of Jiangsu Province. For the development of gefitinib-resistant sublines, a stepwise selection method was used according to a previously described method. 12 Initially sensitive HCC827 cells were incubated with 100 nM gefitinib. The doubling of the drug concentration was performed every time the treated cells reached the growth rate of the untreated cells. Doubling was then performed until the cells exhibited stable gefitinib resistance. The final concentration of 1 µM gefitinib was obtained. All the cells were maintained in RPMI 1640 (Gibco) containing 10% FBS (Wisent), 100 IU/mL penicillin, and 100 IU/mL streptomycin. The cells were then cultured at 37°C in a humidified atmosphere with 5% CO2.
RNA isolation for microarray analysis
The total RNAs, including miRNAs, were harvested from the sorted cells using a mirVanaTM RNA Isolation Kit AM1561 (Ambion, Life Technologies Corporation, CA, USA) according to the instructions of the manufacturer. The total RNA was quantified using NanoDrop ND-2000 (Thermo Fisher Scientific, NanoDrop Products, Wilmington, DE, USA) and RNA integrity was assessed using Agilent Bioanalyzer 2100 (Agilent Technologies, CA, USA). Sample labeling, microarray hybridization, and washing were performed according to the standard protocols of the manufacturer. The total RNA was transcribed to double-stranded complementary DNA (cDNA), synthesized into complementary RNA (cRNA), and finally labeled with cyanine-3-CTP. The labeled cRNAs were hybridized onto the microarray. After washing, the arrays were scanned using an Agilent scanner G2505C (Agilent Technologies).
miRNA expression, gene ontology, and pathway analysis
Feature Extraction software (version 10.7.1.1; Agilent Technologies) was used to analyze the array images and obtain raw data. Genespring software (version 12.5; Agilent Technologies) was then used to finalize the basic analysis of the raw data. The raw data were normalized with quantile algorithm. The probes, which are at least 100.0% of the samples in any one of the two conditions with flags in “Detected,” were selected for further data analysis. Differentially expressed miRNAs were then identified according to the fold change, and the p-value was calculated using t-test. The threshold set for the up- and downregulated genes was a fold change of ⩾2.0 and a p-value of ⩽0.05. The target genes of the differentially expressed miRNAs were the intersections predicted with three databases (TargetScan, microRNAorg, and PITA). The result was considered reliable when the predicted target was identified by at least two of the aforementioned computer applications. The identified targets were then intersected with messenger RNAs (mRNAs) significantly altered in the expression. Gene ontology (GO) and Kyoto Encyclopedia of Genes and Genomes (KEGG) analyses were used to determine the roles of these target genes. Hierarchical clustering was performed to show the distinguishable miRNA expression pattern among the samples.
miRNA-gene-network analysis
A miRNA gene network was constructed through quantification of the relationship between miRNAs, differential gene expression values, and their interactions in the miRNA databases (PITA, TargetScan, and microRNAorg). The circles in the miRNA gene network represent one edge. The center of the network is represented by a degree, which is the contribution of one miRNA to the genes in the vicinity or the contribution of one gene to the miRNAs in the vicinity. The key miRNA and gene in the network exhibit the biggest degrees in most cases.
Cell transfection and treatment
To further explore the effects of miR-149-5p, we performed two sets of experiment. The HCC827 and HCC827/GR-8-1 cells were transfected with miR-149-5p mimics or miR-149-5p inhibitors. The miRNA mimics and inhibitors were purchased from RiboBio Co., Ltd (Guangzhou, China). For the miRNA transfection, the cells were placed in flat bottom six-well plates after 12–24 h incubation at 37°C, the cells were transfected with miR-149-5p mimics and negative control (NC), as well as miR-149-5p inhibitors and NC using Lipofectamine 2000 and Opti-MEM (Gibco) according to the manufacturer’s recommendation. After the 24-h transfection, the cells were treated with the indicated concentrations of gefitinib.
Quantitative real-time polymerase chain reaction
For quantitative real-time polymerase chain reaction (qRT-PCR), the total RNAs, including the miRNAs, were harvested from the sorted cell using TRIzol Reagents (Invitrogen, Carlsbad, CA) according to the manufacturer’s specifications. The total RNA was quantified with a spectrophotometer (NanoDrop Technologies, Wilmington, DE, USA). Approximately 2 µg of the total RNA was reverse transcribed using Moloney murine leukemia virus reverse transcriptase (Promega, Madison, WI) according to the manufacturer’s instructions. Afterward, qRT-PCR was performed to validate the miRNA expression level. The expression levels of mature miRNAs were then amplified using SYBR Green qRT-PCR on an ABI7300 RT-PCR machine (Applied Biosystems, Foster City, CA, USA). For the miRNA quantification, a Bulge-Loop™ miRNA qRT-PCR primer set (one RT primer and a pair of qPCR primers for each set) specific for miR-149-5p, miR-6865-3p, miR-4725-5p, miR-1825, let-7b-3p, miR-8089, miR-572, miR-6734-5p, and miR-3648, which were designed by RiboBio Co., Ltd. U6 was used as the housekeeping gene to measure the levels of the representative miRNAs. The relative levels of gene expression were determined using the ΔΔCt method. All the reactions were repeated three times for each sample. In addition, three individual experiments were repeated.
CCK-8 assay
CCK-8 assay was used to analyze cell proliferation. The HCC827/GR-8-1 cells were transfected with miR-149-5p mimic or NC mimic or with miR-149-5p inhibitor or NC inhibitor. The transient transfected cells were planted in 96-well plates at a density of 5000 cells per well. After culturing for 12 h, the cells were treated with gefitinib at the following concentrations successively: 1, 5, 10, 20, and 40 µM for resistant cell line and 1, 5, 10, 20, and 40 nM for sensitive cell line. After the cells were incubated with 10 µL of CCK-8 reagents for 1–4 h, the spectrometric absorbance at a wavelength of 450 nm was measured on microplate reader ELX800 BIO-TEK. The half maximal inhibitory concentration (IC50) values were then calculated according to the percentages. Each experiment was performed in triplicate, and the results were averaged.
Colony-forming assay
The stable transfected cells were plated in six-well plates at the densities of 200 cells per well. The cells were then cultured for 2 weeks. After culturing the cells, they were stained with 0.5% crystal violet for 30 min. The excess dye was rinsed off thrice with phosphate-buffered saline (PBS). The number of colonies was then counted. Each experiment was performed in triplicate, and the results were averaged.
Flow cytometric analysis
Flow cytometry was performed to analyze cell apoptosis and cycle distribution. For cell apoptosis analysis, the cells were seeded in flat-bottomed six-well plates. After the cells were transfected for 24 h, they were cultured in the absence (control) or presence of gefitinib (5 µM). After re-suspension of the cells in the cell-culture media, the cells were counted and washed with PBS containing 0.5% bovine serum albumin (BSA) and then collected by centrifugation. Apoptosis was detected by Annexin-V-FITC/PI apoptosis detection kit (BD Biosciences, San Diego, CA, USA). The cells were analyzed by FACSCalibur System (BD Biosciences, San Diego, CA, USA). The relative ratio of the apoptotic cells was compared with that of the control transfection group.
Western blot
The cells were transfected with miR-149-5p and NC mimic or miR-149-5p inhibitor and NC inhibitor. The total protein was extracted from the cells using radioimmunoprecipitation assay (RIPA) lysis buffer (Beyotime, Jiangsu, China) after washing with normal saline (NS). The lysates were resolved on 10% gradient sodium dodecyl sulfate polyacrylamide gel electrophoresis (SDS-PAGE) gels and then transferred to a polyvinylidene difluoride (PVDF) membrane. After blocking with 5% BSA for 2–4 h, the PVDF was incubated at 4°C with the primary antibodies. The primer antibodies used in this study were Bcl-2, β-actin, and caspase-3 (1:2000; Cell Signaling Technology). The membranes were incubated with the secondary antibodies after washing with tris-buffered saline and Tween 20 (TBST). The protein band was detected by chemiluminescence using a BeyoECL Plus kits (Beyotime). Each experiment was performed in triplicate, and the results were averaged.
Statistical analysis
Statistical analysis was performed using SPSS 16.0. All the values were represented as mean ± standard deviation (SD).
Results
Establishment of gefitinib-resistant cell subline
The HCC827/GR-8-1 cell line was derived from the parental HC827 cells using the stepwise increasing concentrations of gefitinib. Cell viability was determined by CCK-8 assay to assess the resistance index of gefitinib-resistant cell. The IC50 value of HCC827 for gefitinib was 72.32 ± 1.98 × 10⁻³ µM. However, the IC50 of HCC827/GR-8-1 was 30.5175 ± 0.19 µM gefitinib. The HCC827/GR-8-1 cell line was 435.7-fold more resistance to gefitinib than in the corresponding parental cells (Figure 1).

The establishment of gefitinib-resistant HCC827/GR-8-1 cell lines. Cell viability and IC50 values of gefitinib in parental HCC827 as well as in gefitinib-resistant HCC827/GR-8-1 cell lines (p < 0.05). Cells were treated with indicated concentrations of gefitinib for 48 h in a medium containing 5% FBS. Cell viability and IC50 values were determined using CCK-8 assay.
miRNA dysregulation in cells with acquired gefitinib resistance
The molecule mechanisms of the acquired gefitinib resistance remain unclear. Previous research reported that the involvement of miRNAs in the innate resistance of the NSCLC cell lines contributes to acquired drug resistance. 13 Therefore, we analyzed the miRNA expression profile in the HCC827 and HCC827/GR-8-1 cell lines using the Feature Extraction software (version 10.7.1.1; Agilent Technologies). We then compared the normalized ratio of the miRNA microarray hybridization signal and the fold increase levels of the miRNA assay. When the unsupervised hierarchical clustering analysis was performed, the differentially expressed miRNAs were used to generate a heat map. The results showed that the miRNAs self-segregated into HCC827 and HCC827-8-1 clusters as shown in Figure 2(a). Finally, the clustering result showed that 44 miRNAs displayed at least a twofold changed expression in the HCC827 and HCC827/GR-8-1 cell lines. Notably, the observed differences between the abnormal miRNA expression levels and the expression levels in gefitinib-resistant cells were considerably greater. Among these miRNAs, 12 were downregulated in the HCC827/GR-8-1 cells (p < 0.05) and 32 were upregulated in the HCC827/GR-8-1 cells (p < 0.05). As shown in Table 1, for example, miR-3934-5p that had the greatest increase was increased by 123.9-fold in the gefitinib-resistant cells relative to that in the gefitinib-sensitive cells. By contrast, miR-6734-5p had the largest decrease (20.4-fold). Compared with the HCC827 cells, the HCC827/GR-8-1 cells had genome-wide profiles in which miR-6734-5p showed the greatest decrease (20.4-fold decrease), whereas miR-3934-5p showed the greatest increase (123.9-fold). Several miRNAs, including miR-149-5p, were found drastically upregulated in the HCC827/GR-8-1 cell line.

(a) Several miRNAs were found dysregulated. In total, 32 miRNAs were upregulated and 12 miRNAs were downregulated in the HCC827/GR-8-1 cells compared with the parental HCC827 cells. (b) GO analysis revealed the significant GO categories (p < 0.05): GO:0007399 (nerve system development; GO, biological processes), GO:0005654 (nucleoplasm; GO, cellular components), and GO:0005515 (protein binding; GO, molecular functions); pathway analysis of the results (fold changes ⩾ 2) showed that the most altered pathway was axon guidance, adrenergic signaling in cardiomyocytes, and cGMP-PKG signaling pathway. The x-axis shows the number of miRNAs annotated, and the y-axis shows the GO annotations.
The greatest increased miR-3934-5p was increased by 123.9-fold in gefitinib-resistant cells relative to gefitinib-sensitive cells, while miR-6734-5p, the most-decreased miRNA, showed a 20.4-fold decrease.

The functions of the differentially expressed miRNAs were predicted by the GO and KEGG pathway annotations of their co-expressed mRNAs (Figure 2(b)). In the GO pathway analysis, the most common pathways involving the dysregulated miRNAs were GO:0007399 (nervous system developmental pathway; GO, biological processes), GO:0005654 (nucleoplasm; GO, cellular components), and GO:0005515 (protein binding; GO, molecular functions). miRNA affects the pathways by regulating the pathway members. Pathway analysis results revealed the 20 pathway categories affected by dysregulated miRNA targets were enriched with a p-value of <0.01. In addition, the axon guidance, adrenergic signaling in cardiomyocytes, cGMP-PKG signaling pathway, focal adhesion, platelet activation, and PI3K-Akt signaling pathway were significantly enriched.
Potential biological effect of altered miRNA on gene expression
To investigate the underlying mechanisms of how genes affect the behavior of HCC827/GR-8-1 cells, we performed a genome-wide cDNA microarray. We compared the expression levels of the miRNAs in the HCC827/GR-8-1 cell line with those in the HCC827 cell line. The HCC827/GR-8-1 cell line is an individual clone isolated from the resistant HCC827 cells and 348-fold more resistant to gefitinib than the highly stable HCC827 cells. 14 As previously described, 12 miRNAs were downregulated in the HCC827/GR-8-1 cells (p < 0.05), and 32 miRNAs were upregulated in the HCC827/GR-8-1 cells. The predicted target genes for these miRNAs were then analyzed using three different online programs (PicTar 2012, microRNAorg 2012, and TargetScan 2012) to further study the potential biological effect. As shown in Figure 2, among the 44 miRNAs, 11 (miR-128-3p, miR-149-5p, miR-1825, miR-196a-5p, miR-221-3p, miR-222-3p, miR-338-5p, miR-342-3p, miR-513b-5p, miR-550a-5p, and miR-572) were found specifically targeting multiple genes. This finding was confirmed by the PicTar, microRNAorg, and TargetScan programs.
qRT-PCR validation of differentially expressed miRNAs
The results from the qRT-PCR analyses confirmed the overexpression of the miRNAs in the HCC827 and HCC827/GR-8-1 cell lines (Figure 3). Based on the significance of the difference (fold change and p-value) and favorable expression levels, nine miRNAs were selected for further validation by qRT-PCR. We focused on these upregulated miRNAs in the expression levels of miR-149-5p, miR-6865-3p, miR-4725-5p, miR-1825, let-7b-3p, miR-8089, miR-572, miR-6734-5p, and miR-3648. Data were normalized using U6, which was selected as the best endogenous control. The expression levels of miR-149-5p, miR-6865-3p, miR-4725-5p, miR-1825, let-7b-3p, miR-8089, miR-572, miR-6734-5p, and miR-3648 increased in the HCC827/GR-8-1 cell line compared with those in the parental HCC827 cell line (Figure 4). The qRT-PCR results were consistent with those of the microarray data.

The arrow shapes represent miRNAs, and the green dots represent target genes; the lines between them mean that the miRNAs are potentially regulated by the target genes. The most frequently predicted functions of the differentially expressed miRNAs involved were miR-128-3p, miR-149-5p, miR-1825, miR-196a-5p, miR-221-3p, miR-222-3p, miR-338-5p, miR-342-3p, miR-513b-5p, miR-550a-5p, and miR-572.

Real-time quantitative PCR results of the nine chosen miRNAs which validate those of the microarray (p < 0.05; Student’s t-test). The heights of the columns in the chart represent the mean fold change in expression for each of these miRNAs. Bars represent SD. Fold change was positive when the expression was upregulated (HCC827-8-1/HCC827 cells).
Treatment of miR-149-5p inhibitors attenuate cell gefitinib resistance
First, the cells were transfected with miR-149-5p inhibitors. Figure 5(a) shows that miR-149-5p expression was significantly downregulated by the inhibitors in the HCC827 and HCC827/GR-8-1 cells. Based on the CCK-8 assay, Figure 5(b) shows that the downregulation of miR-149-5p expression significantly attenuated the gefitinib sensitivity of both the HCC827 and HCC827/GR-8-1 cells and significantly reduced their IC50 value. This result suggests that miR-149-5p enhanced the gefitinib response in these cell lines. Induced apoptosis is an important factor in the target therapeutic sensitivity of cancer cells, and thus flow cytometry was used to detect the apoptosis of the HCC827 and HCC827/GR-8-1 cells. This assay revealed that low miR-149-5p expression increased cell apoptosis in both the HCC827 and HCC827/GR-8-1 cells. Figure 5(c) shows that the apoptosis rates were significantly different in the cells transfected with the miR-149-5p inhibitors or NC. Furthermore, the number of apoptotic cells was higher in groups treated with gefitinib compared with those expressing the NC. The expressions of caspase-3 and Bcl-2 proteins were detected by Western blot to further verify that cell apoptosis is regulated by the miR-149-5p. The caspase-3 protein level was upregulated through the inhibition of miR-149-5p (Figure 5(d)). The Bcl-2 levels decreased in gefitinib-resistant cells transfected with miR-149-5p inhibitor compared with those in the cells transfected with NC inhibitors. The inhibition of miR-149-5p expression attenuated the plate colony formation ability of the HCC827/GR-8-1 and HCC827 cells, as measured by the number of clones (Figure 5(e)). The inhibition effect was evident upon the treatment of gefitinib. The results showed that both the HCC827 and HCC827/GR-8-1 cells transfected with miR-149-5p inhibitors had a significantly higher cytostatic effect compared with the cells transfected with NC inhibitors with gefitinib. These data offer further confirmation that the acquired gefitinib resistance is regulated by miR-149-5p.
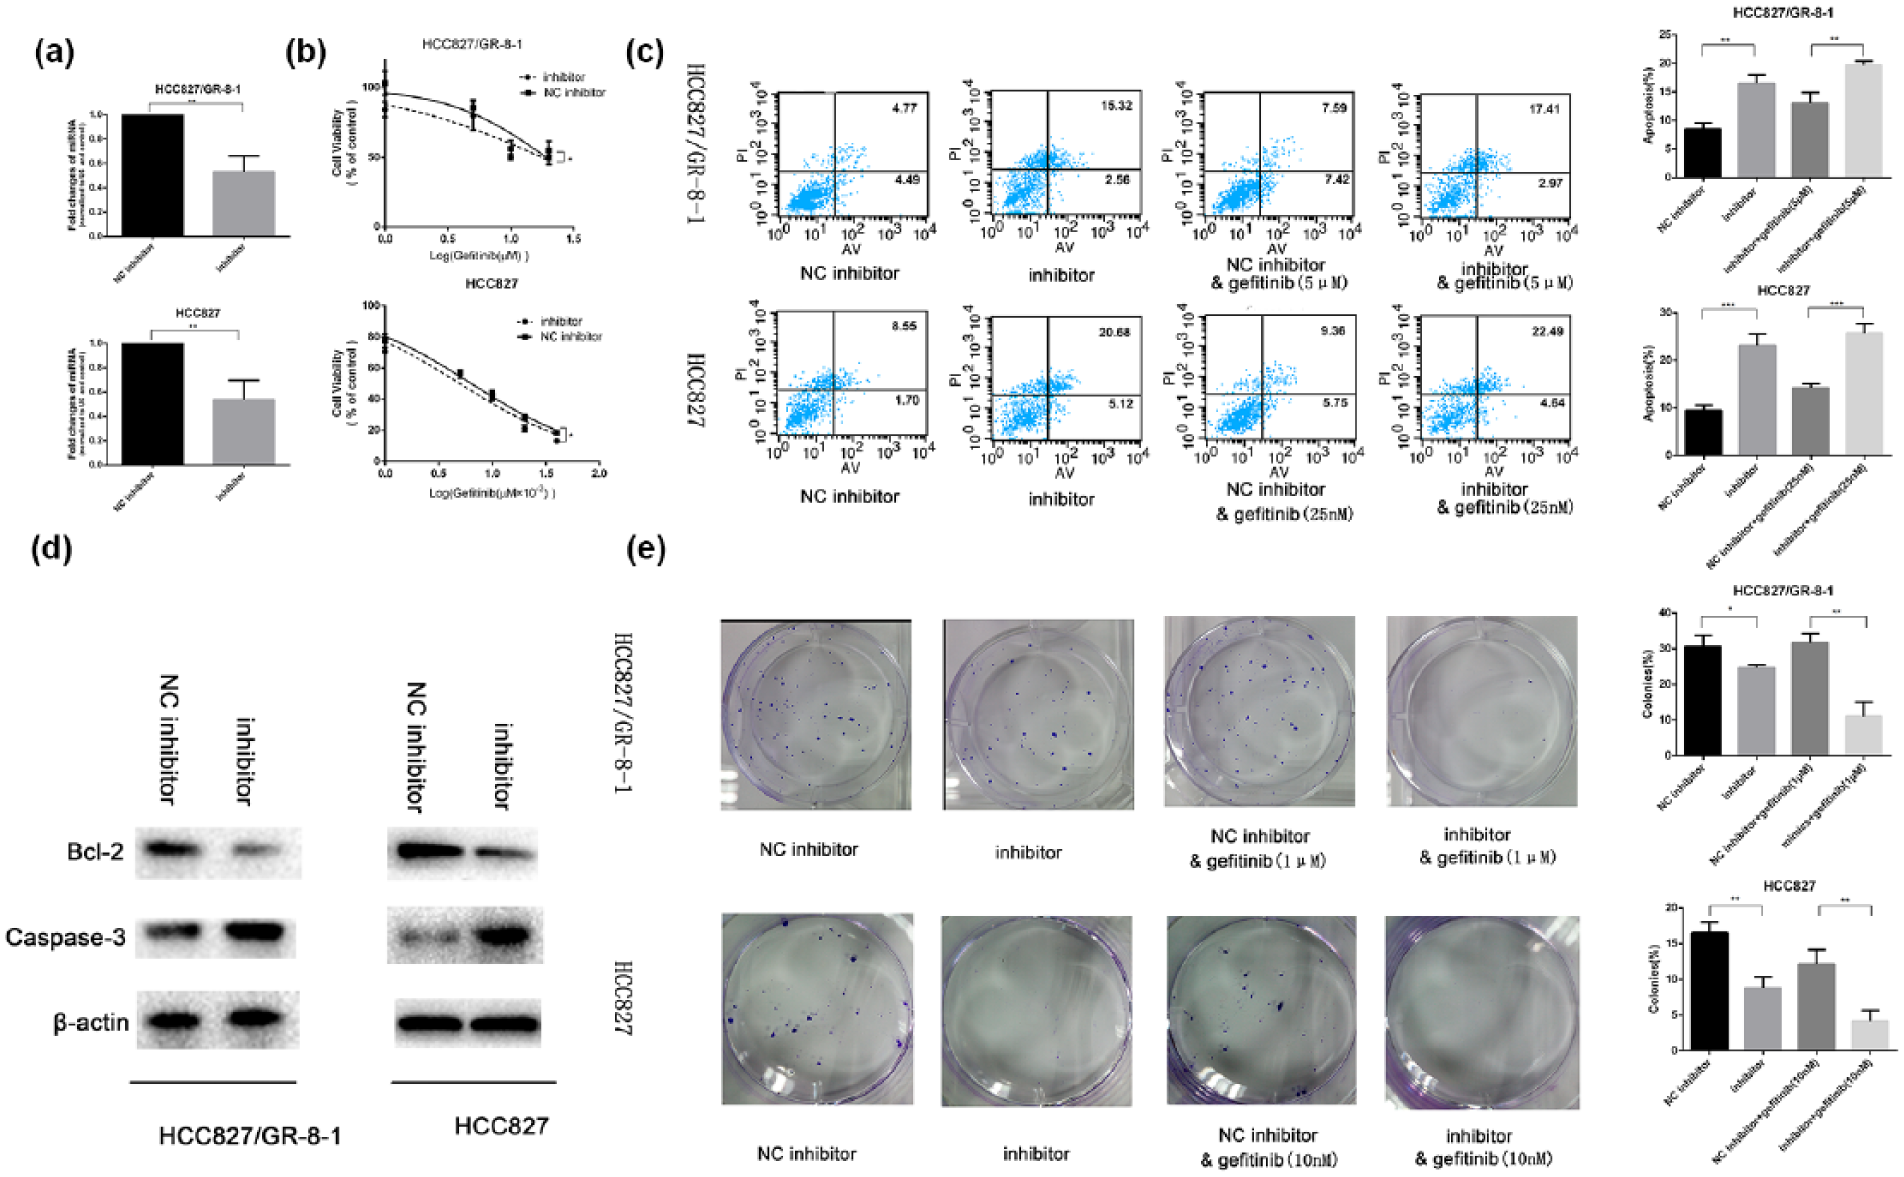
miR-149-5p was involved in gefitinib resistance: (a) miR-149-5p inhibitor can significantly inhibit the expression level of miR-149-5p both in the HCC827 and HCC827/GR-8-1 cells. (b) HCC827 and HCC827/GR-8-1 cells were treated with cisplatin plus miR-182 or cisplatin plus NC, and cell viability was assayed using CCK-8 assay according to the manufacturer’s protocol (p < 0.05). (c) Cell apoptosis rate was higher in cells treated with miR-149-5p inhibitors compared with that of the NC inhibitors. When treated with 5 µM gefitinib, the cell apoptosis rate was still higher than the NC group (p < 0.05). (d) The expression of caspase-3 was downregulation and Bcl-2 was upregulation in HCC827 or HCC827/GR-8-1 cells with low expression of miR-149-5p. (e) The colony formation results show that the inhibition rate was increased in the inhibitor group compared with the NC group. Moreover, the inhibition rate was higher in cells transfected with miR-149-5p inhibitors treated with 5 µM gefitinib than in cells that were only transfected NC (p < 0.05).
Treatment of miR-149-5p mimics promote cell gefitinib resistance
We examined whether or not the miR-149-5p mimics enhance gefitinib resistance. The HCC827 and HCC827/GR-8-1 cells were transfected with miR-149-5p mimics for 48 h (Figure 6(a)). The CCK-8 assay results showed that these cell lines had considerably reduced IC50 values because of the overexpression of miR-149-5p compared with the NC group. Figure 5(b) showed that the increased expression of miR-149-5p significantly inhibited the sensitivity of both the HCC827 and HCC827/GR-8-1 cells to gefitinib treatment (p < 0.05). We quantified the apoptosis of the miR-149-5p mimics in the HCC827 and HCC827/GR-8-1 cells. As shown in Figure 6(b), the transfected cells of the miR-149-5p mimics had higher rates of apoptosis than the NC. Similarly, the cells treated with gefitinib also had lower rates of apoptosis than the NC. The results revealed that miR-149-5p is involved in gefitinib resistance in the NSCLC cells. According to the flow cytometry results on the cells transfected with miR-149-5p mimics, both the early apoptosis and late apoptosis of the HCC827 and HCC827/GR-8-1 cells decreased (Figure 6(c)). The differences in the apoptosis rates between the miR-149-5p mimics group and the NC mimic group were statistically significant (p < 0.05). Through the upregulation of miR-149-5p, caspase-3 protein level was downregulated, whereas the Bcl-2 levels increased compared with those in NC-mimics-transfected cells (Figure 6(d)). As shown in Figure 5(e), the introduction of miR-149-5p increased cell proliferation. The overexpression of miR-149-5p in the HCC827 and HCC827/GR-8-1 cell lines induced a relatively high proliferation rate when treated with gefitinib (Figure 6(e)). These results verified the role of miR-149-5p in EGFR-TKI resistance. In addition, miR-149-5p affected not only cell growth but also acquired gefitinib resistance.

miR-149-5p increases cell viability during gefitinib treatment: (a) miR-149-5p mimics can significantly increase the expression level of miR-149-5p. (b) The CCK-8 assay confirmed that miR-149-5p overexpression markedly improve the resistance of gefitinib both in the HCC827 and HCC827/GR-8-1 cells (p < 0.0.5). (c) Cell apoptosis rate was lower in cells treated with miR-149-5p mimics compared with that of the NC mimics. When treated with 5 µM gefitinib, the cell apoptosis rate was significantly lower than the NC group (p < 0.05). (d) The detection of the expression of caspase-3 and Bcl-2 to evaluate the apoptotic activity of HCC827 or HCC827/GR-8-1 cells ectopically expressing miR-149-5p treated with gefitinib. (e) The colony formation results further showed that the clone-forming ability of the miR-149-5p mimics group was significantly higher than that of the NC group. Cell proliferation was significantly higher upon treatment with the miR-149-5p inhibitor compared with that of the NC group when treated with 5 µM gefitinib (p < 0.05).
Discussion
miRNAs are attractive therapeutic targets for various therapy-resistant tumors. 15 Several studies reported that miR-30b, miR-30c, miR-221, and miR-222 affect the gefitinib-induced apoptosis and epithelial-to-mesenchymal transition of NSCLC cells by inhibiting the expression of some important oncogenes. 16 Furthermore, evidence showed that miRNAs regulate genes associated with resistance to EGFR-TKIs. The downregulation of miR-223 can induce the activation of the PI3K/Akt pathway in EGFR-TKI-resistant cells and is responsible for the resistance of NSCLC cells to TKI. 17 Another research revealed that miR-26a is upregulated in gefitinib-refractory NSCLC. Furthermore, miR-26a is a downstream of EGFR signaling, and miR-26a inhibition can considerably improve NSCLC responses to gefitinib. 9 In addition, miR-200a expression renders the cells more sensitive to gefitinib treatment. 18 These data revealed the novel mechanism of NSCLC resistance to TKI treatment.
Acquired resistance to EGFR-TKI gefitinib is a critical issue for the treatment of EGFR mutant-positive NSCLC. However, the underlying molecular mechanism of miRNAs in mediating NSCLC drug resistance requires further investigated.
We used HCC827-8-1 cells to study the EGFR-TKI resistance mechanisms and obtain more accurate results. We identified 44 abnormally altered miRNAs (significantly decreased, 12 miRNAs; significantly increased, 32 miRNAs) in the HCC827/GR-8-1 cells and compared them with those in the parental HCC827 cells via miRNA expression analysis. Furthermore, this study provides insight into a unique mechanism. In this mechanism, which was discovered through the microarray study, the overexpression levels of miRNAs in the acquired gefitinib-resistant cells cause differentially expressed genes because of the parental gefitinib-sensitive HCC827 cells. The most enriched biological process was the nervous system developmental pathway, the most enriched cellular component was the nucleoplasm, and the most enriched molecular function was protein binding. These factors induce acquired gefitinib resistance. Moreover, the results from the KEGG analyses of the differentially expressed miRNAs revealed their potential involvement in axon guidance, adrenergic signaling in cardiomyocytes, cGMP-PKG signaling pathway, focal adhesion, platelet activation, and PI3K-Akt signaling pathway. The activation of these pathways can be a mechanism for acquired gefitinib resistance.
Of all, the dysregulated miRNAs, such as miR-128-3p, miR-149-5p, miR-1825, miR-196a-5p, miR-221-3p, miR-222-3p, miR-338-5p, miR-342-3p, miR-513b-5p, miR-550a-5p, and miR-572, were previously identified as potential regulators in cancer. Activating miR-196a-5p in bladder cancer cells was reported to confer resistance of cisplatin or gemcitabine. 19 In addition, miR-221-3p plays a crucial role in a wide variety of cancers and drug resistance. 20 By suppressing estrogen receptor alpha (ERα) expression, miR-222-3p increases raloxifene resistance in cancer cells. 21 Meanwhile, miR-342-3p overexpression in triple-negative breast cancer increases sensitivity to paclitaxel or cisplatin. 22
We found that the expression of miR-149-5p was upregulated significantly in the NSCLC samples. 23 Using microarray technology, a recent study reported that miR-149-5p is overexpressed in NSCLC patients. 24
However, miR-149-5p appears to either positively or negatively regulate carcinogenesis depending on cell types and intracellular signaling context. miR-149-5p is upregulated in nasopharyngeal carcinoma (NPC), and the expression of miR-149-5p is higher in NPC cell lines than that in a normal immortalized nasopharyngeal epithelial cell line. miR-149-5p possibly promotes tumor progression and can promote proliferation, mobility, and invasion of the NPC cell lines. 25 It is also expressed at substantially high levels in glioma. Furthermore, enforced miR-149-5p expression can promote cell viability, inhibit apoptosis, and induce xenografted tumor growth in vivo, whereas the knockdown of miR-149-5p renders the cells sensitive to apoptotic stimulation. 26 In addition, the suppression of miR-149-5p inhibits cell growth considerably and eventually induces senescence. Notably, miR-149-5p promotes cell proliferation. 27 Recent study revealed that miR-149-5p expression is significantly downregulated and plays an important role as a tumor suppressor 28 in some cancers, such as gastric cancer, 29 astrocytomas, 30 glioma, 31 colon, and rectum carcinoma (colorectal cancer (CRC)). 32 Overexpression of miR-149-5p was found to inhibit the viability and invasion of cells in vitro and have prognostic and therapeutic implications on CRC. 32 miR-149-5p works as tumor suppressor and is involved in the proliferation and invasion of glioma cells. 31 Ectopic expression of miR-149-5p in gastric cancer cells inhibits proliferation and cell cycle progression. 29 Furthermore, the expression of miR-149-5p was previously demonstrated to have inverse correlation with the invasive capability and epithelial-to-mesenchymal transition of the NSCLC cells. The ectopic transfection of miR-149-5p increases E-cadherin expression. 33 However, a previous study reported that restoring E-cadherin expression can increase sensitivity to EGFR-TKIs. 34
The miRNAs identified in our study serve as markers to predict the mechanisms of acquired drug resistance in NSCLC without biopsy. The enforced miR-149-5p expression significantly induced the resistance of acquired-resistant cells to gefitinib treatment. In addition, our results indicated that miR-149-5p can suppress apoptosis by targeting the expression of the pro-apoptotic Bcl-2 proteins DP5 and PUMA and consequent cell apoptosis. 35 The enforced miR-149-5p expression promoted cell survival, whereas the knockdown of miR-149-5p rendered the cells sensitive to apoptotic stimulation. 36 Furthermore, the anti-apoptotic effect of miR-149-5p was confirmed by Western blot assay.
In conclusion, the altered expression of miRNAs and targeted mRNAs affect gefitinib resistance. Our results provide a new avenue for the analysis of miRNAs in NSCLC. Our study reveals that miR-149-5p promotes gefitinib resistance. Although the role of miR-149-5p in NSCLC tumorigenesis requires further investigation, miR-149-5p provides us with a new potential target for the treatment of acquired gefitinib resistance. Longitudinal studies must be conducted to examine the long-term effects of gefitinib exposure. The results of our study revealed that miR-149-5p expression level can be used as a prognostic tool for the prediction of gefitinib resistance.
Footnotes
Acknowledgements
Y.H. and X.Q. contributed equally to this work.
Declaration of conflicting interests
The author(s) declared no potential conflicts of interest with respect to the research, authorship, and/or publication of this article.
Funding
This work was supported by grants from the National Nature Science Foundation of China (81372396).