
Abstract
Objectives
To build a lamotrigine (LTG) physiologically based pharmacokinetic (PBPK) model (LTG PBPK) and compare it to the clinical data from South Asian Indian patients and use this model to understand the drug interactions of LTG and explore the optimal doses.
Methods and Material
The PBPK model was developed using the PK-Sim software platform and qualified with LTG plasma concentration data from an Indian study. The European population database was chosen as the patient setting in the software. Physiochemical data of LTG and enzyme kinetic data were incorporated from the literature. Dosing protocols were as per the previous study. Interaction models for drug interactions with carbamazepine and valproate were also simulated.
Results
Most of the model predicted concentration-time profiles of LTG at steady-state were well within the observed concentrations. The developed models were suitably qualified. The drug interaction model was used to assess the impact of induction and inhibition of the pharmacokinetic profile of LTG.
Conclusions
The predicted plasma concentrations of the developed PBPK models using the European population database were very similar to the data from Indian patients. The developed LTG PBPK models are applicable in predicting the impact of drug interactions and can yield appropriate LTG doses to be administered.
The PBPK model, developed using European population database, was suitably qualified with LTG pharmacokinetic data from Indian patients. The developed model, when tested for induction and inhibition effect, was able to provide an insight into the needed dosage adjustments.
Introduction
Lamotrigine (LTG) is approved by the Food and Drug Administration (FDA) for partial seizures and as an adjunct primary therapy for Lennox-Gastaut syndrome and generalized tonic-clonic seizures. 1 Maintaining the LTG concentration within the therapeutic window is essential, especially when co-administered with enzyme inducers/inhibitors, given that they interfere with LTG clearance, which might warrant suitable dosage adjustments. 2 Physiologically based pharmacokinetic (PBPK) modeling is a technique that focuses on the general concept of mathematically describing relevant physiological and biochemical processes that elucidate the pharmacokinetic (PK) behavior of a chemical compound. 3 This is a significant benefit over static models which are unable to anticipate such dynamic PK correlations because of their reliance on steady-state assumptions and usage of only a few in vitro factors. 4 Even though PBPK models first emerged in the 1980s and have progressively gained in popularity since then, their use in clinics has been minimal. 5 Despite the vast usage of LTG and the hazards associated with probable drug-drug interactions (DDIs), very few PBPK models of LTG exist, with none known to be evaluated in the Indian population.3, 6 The aim of this study was to develop a PBPK model of LTG using an open-source software platform that can be easily replicated by others and validate it with data from Indian epileptic patients. Thereby helping us to predict LTG concentrations when administered alone or in combination with carbamazepine (CBZ) or valproic acid (VPA), and further recommend necessary dosage adjustments in case of concomitant medications.
Materials and Methodology
PBPK models of LTG were built using PK-Sim software version 9.1.2 (Open Systems Pharmacology Suite, Bayer Technology Services, Leverkusen, Germany). The model was then qualified for both intravenous and oral routes. The data used for the qualification of the model was extracted from published literature using the WebPlotDigitizer version 4.4. The model was also validated using the pharmacokinetic and the demographic data obtained from a previously conducted study by Mallaysamy et al. in Indian epileptic patients. 7 The study was conducted after Institutional Ethics Committee’s approval. It comprised of patients on LTG monotherapy alone, LTG along with CBZ, and LTG with VPA. The data included patients on LTG 25 mg to 300 mg, having reached a steady state of LTG for a month. This model employed anonymized datasets which included sparse sampling information from 64 patients on LTG therapy. The predicted plasma concentration-time profiles from the developed model were compared with observed plasma concentrations from the study. The impact of DDI between LTG and CBZ as well as VPA was also studied to further understand the altered clearance of LTG. All the pharmacokinetic data was extracted from PK-Sim, and the plots were generated using R studio Version 1.4.1717.
Model Building
Individual and Population Building Blocks (LTG Monotherapy)
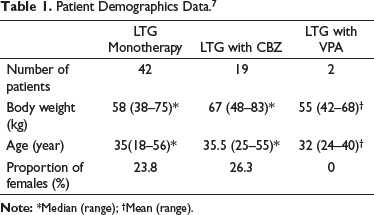
PK-Sim is a Pharmacokinetic simulation tool for whole-body PBPK modeling with a user-friendly environment. 8 Using the software’s built-in building components, a whole-body PBPK model was constructed. A typical subject symbolizing the entire population was generated using the European database with intrinsic values for subject demographics, organ volumes, and flow rates. A population of 100 virtual persons was created based on the median individual patient information from Mallaysamy et al. 7 as shown in Table 1. This model uses an approach comparable to a case study reported by Kuepfer et al. 9 Certain assumptions were made to make the present model fit the previously published models because of the use of a different construction platform (PK-Sim) compared to other previous publications. LTG is a small molecule (molecular weight (MWt) less than 900 daltons), 10 and PK-Sim assumes that the PBPK model for small compounds is permeability-limited by default, and hence PK-Sim standard method is used to calculate cellular permeability. 11 Although it uses demographic data to determine Ka, flow rates, organ volumes which are significant factors in determining onset time, there are options to change them.
Patient Demographics Data. 7
Compound Parameters
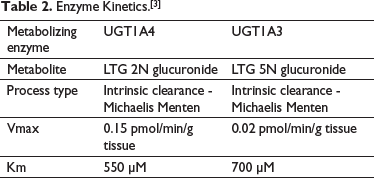
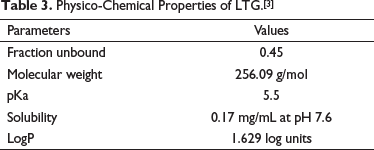
LTG is completely and rapidly absorbed with minimal first-pass effect, having a bioavailability estimated to be 98%. It is 55%, plasma protein bound, thus does not contribute to any clinically significant drug interactions via competition for binding sites on plasma proteins. LTG metabolism predominantly occurs through glucuronidation in the liver, forming LTG-2-N-glucuronide (76% of the administered dose) and LTG-5-N-glucuronide (10% of the administered dose) via UGT1A4 and UGT1A3, respectively. Metabolism of LTG in liver catalyzed by UGT1A3 and UGT1A4 follows mixed order kinetics. Michaelis Menten constants for the Uridine 5’-Diphospho-Glucuronosyl Transferase (UGT) isoenzymes have been mentioned in Table 2. It is excreted in urine and feces. Approximately 10% of the administered dose is excreted unchanged in the urine, with LTG-2-N-glucuronide accounting for the majority of the remainder. 12 The compound parameters such as lipophilicity, pKa, etc., are presented in Table 3.
Enzyme Kinetics.[3]
Physico-Chemical Properties of LTG.[3]
Drug Interaction Models
Different sets of models were built to assess the effect of an enzyme inducer CBZ and an enzyme inhibitor VPA separately, when co-administered with LTG and to ideally recommend suitable dosage adjustment. The induction model was simulated for LTG 100 mg twice a day (BID), subject to the availability of observed data. The patients’ demographic details included in the induction model have been summarized in Table 1. Based on the reported mean reduction of LTG concentration (40%), 13 the total clearance was altered (increased by 100%) in order to match the reported decrease of concentration in the induction model. For dosage recommendation, the simulation of LTG concentration-time profile in the induction model was compared with the LTG monotherapy model using the same demographics. The dose of LTG in the Induction model was increased by 10 mg, and many simulations were carried out until the simulated profile matched with the concentration profile of LTG monotherapy. 14
The inhibition model was simulated for LTG 25 mg once daily (OD) as the observed data was available for this level of dosing. The patients’ demographic details included in the inhibition model are listed in Table 1. Based on the reported mean increase of LTG concentration (2-fold), 13 the total clearance was altered (reduced by 50%) in order to match the reported increase of concentration in the inhibition model. For dosage recommendation, the simulation of LTG concentration-time profile in the inhibition model was compared with the LTG monotherapy model using the same demographics. The dose of LTG in the Inhibition model was reduced by 10 mg, and many simulations were carried out until the simulated profile matched with the concentration profile of LTG monotherapy.
Formulation and Administration Protocol
A standard dose of 100 mg LTG was administered orally Q12hourly to each simulated individual. As it was known that all participants in the study had already attained a steady-state, the protocol end time was adjusted to measure plasma concentrations of LTG at steady state.
Model Qualification
The developed model was qualified by comparing it with previously published reports. Simulations with IV Bolus of 67.8 mg, 100 mg oral OD, 200 mg oral OD were carried out to compare it with previously published literature.6, 15–17 The comparison was made based on maximum concentration (Cmax) and area-under-the-curve (AUC) of the model predicted profile and observational data from earlier studies. The fold error was estimated using observed-to-predicted (obs/pred) ratios. The prediction estimates are regarded to be within the acceptable threshold if the ratio is inside the two-fold error margin (0.5–2).18, 19 Predicted and observed parameters of the mean individuals were also compared using the percentage error of the predicted model. This was calculated by ([Predicted concentration – Observed Concentration]/Observed Concentration) ×100.
Results
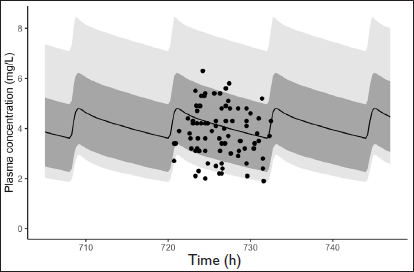
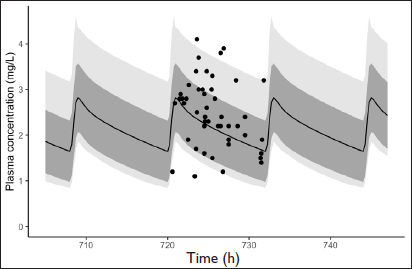
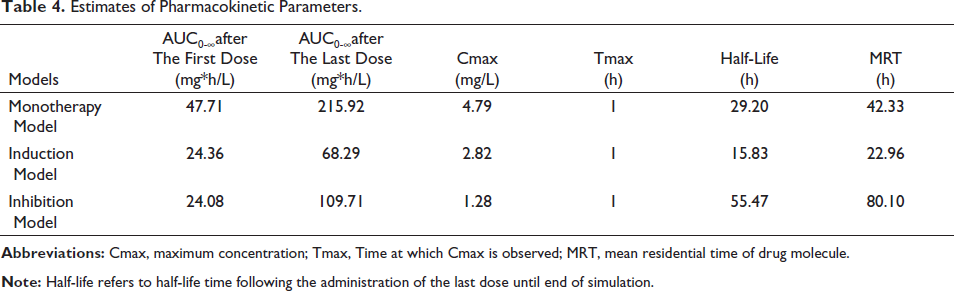
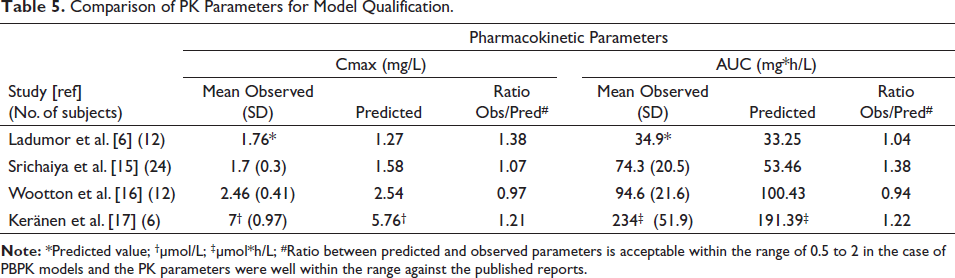
Most of the model predictions study were well within observed concentrations from the clinical studies with the most extreme outlier having a prediction error of 20% for the monotherapy model and 30% for the interaction models. The observed to predicted ratios of mean individuals in case of model qualification ranged from 0.97 to 1.38 and 0.94 to 1.38 for Cmax and AUC, respectively, with the ratios being close to 1 signifying the closeness between observed and predicted values. The prediction error for Cmax and AUC of mean individuals was within 27% and 28% respectively. The simulated Pharmacokinetic profiles of LTG dosing at steady-state for the whole population as well as interaction models along with observed concentrations from the clinical study are shown in Figures 1 to 3. Appropriate dosage adjustments in case of DDIs are shown in Figures 4 to 5. The Pharmacokinetic parameter estimates representing the mean individual of each population resulting from various LTG model simulations are shown in Table 4. The comparison of predicted and observed pharmacokinetic parameters for studies included in model qualification are shown in Table 5.
LTG Monotherapy Simulated Pharmacokinetic Profile; Black Circles Represent Observed Concentrations and Solid Black Line Represents Mean Predicted Concentrations. Dark Grey Shaded Area Represents Standard Deviation and Light Grey Area Represents Prediction Interval Ranging from 2.5% to 97.5%.
LTG + CBZ Simulated Pharmacokinetic Profile; Black Circles Represent Observed Concentrations and Solid Black Line Represents Mean Predicted Concentrations. Dark Grey Shaded Area Represents Standard Deviation and Light Grey Area Represents Prediction Interval Ranging from 2.5% to 97.5%.
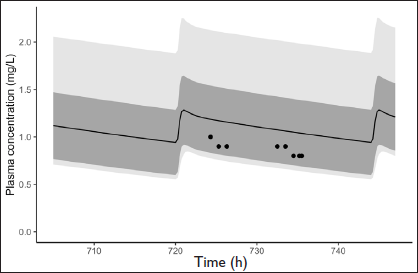
LTG + VPA Simulated Pharmacokinetic Profile; Black Circles Represent Observed Concentrations and Solid Black Line Represents Mean Predicted Concentrations. Dark Grey Shaded Area Represents Standard Deviation and Light Grey Area Represents Prediction Interval Ranging from 2.5% to 97.5%.
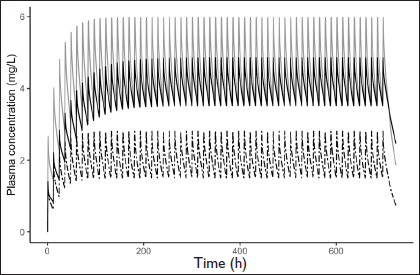
Dosage Adjustment in Induction Model; Grey Line Represents LTG Concentration Following 100 mg Monotherapy. Dashed Line Represents LTG Concentration Following 100 mg LTG Along with CBZ. Black Line Represents LTG Concentration After Dosage Adjustment to 200 mg LTG Along with CBZ.
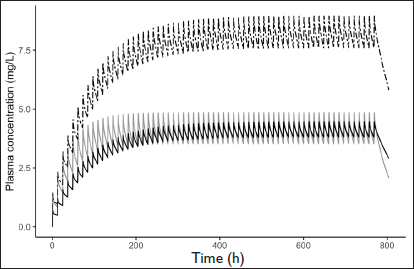
Dosage Adjustment in Inhibition Model; Grey Line Represents LTG Concentration Following 100 mg Monotherapy. Dashed Line Represents LTG Concentration Following 100 mg LTG Along with VPA. Black Line Represents LTG Concentration After Dosage Adjustment to 50 mg LTG Along with VPA.
Estimates of Pharmacokinetic Parameters.
Comparison of PK Parameters for Model Qualification.
Discussion
Epilepsy is a neurological disorder that affects people of all ages.20, 21 It is easily managed with anti-epileptic drugs (AEDs). These drugs can maintain the control of seizures without adverse effects only when their concentrations are maintained within therapeutic ranges. 2 Maintaining AEDs within their therapeutic levels is a challenge many physicians and patients face. Therapeutic monitoring of AEDs is a common practice to maintain therapeutic concentrations even though they add to the cost of management.
Simulation software tools are available in recent decades that could use mathematical models to describe the physiological and biochemical mechanisms that influence a compound’s pharmacokinetic activity within an individual or a given population. 22 One such software is PK-Sim version 9.1.2 (Open Systems Pharmacology Suite, Bayer Technology Services, Leverkusen, Germany), a PBPK modeling tool that we have used for the current study. Our study focuses on the AED LTG which is widely prescribed AED for a spectrum of seizure conditions and other neurological illnesses. Even though there are other PBPK models available for LTG3, 6 this study was an attempt to develop a PBPK model for LTG using an open-source platform like PK-Sim and employing the data from the European population as the standard population to simulate and compare concentrations reported from an Indian study. 7 The present study attempted to use the developed PBPK model to assess the impact of drug interaction on the LTG concentrations. Such predictions are useful in appropriate dosage regimen design when multiple drugs like inducers or inhibitors are administered along with LTG.
The developed model was validated using the PK data of LTG from an Indian study. The study revealed that the European database in PK-Sim was appropriate for portraying LTG pharmacokinetics in Indian patients.
The AED CBZ has been reported to induce UGT enzymes. 13 Thus, when co-administered with LTG, it results in enhanced clearance of the latter. 23 This has been reported by many publications.14, 24–27 The model designed to replicate enzyme induction had an increased clearance of LTG (increased by 100%), and its predicted concentration-time profile is presented in Figure 2. For dosage recommendations, the dose of LTG in the induction model was increased by 10 mg with every simulation until it matched with the Cmin of LTG monotherapy model simulation. The concentrations reached similar levels at a dose of 200 mg BID of LTG (doubled) in the induction model. A similar dosage recommendation was seen in the product information of LTG. 13
VPA, on the contrary, is reported to inhibit UGT enzymes. 13 When co-administered with LTG, it results in a decreased clearance of LTG and an increased half-life. The model built to depict this had reduced LTG clearance (reduced by 50%), and its predicted concentration-time profile is shown in Figure 3. For dosage recommendations, the dose of LTG in the inhibition model was decreased by 10 mg with every simulation until it matched with the Cmin of LTG monotherapy model simulation. The concentrations reached similar levels at a dose of 50 mg BID of LTG (reduced by 50%) in the inhibition model. A similar dosage recommendation was seen in the work of Kanner and Frey 28 and the product information of LTG. 13
Our models were then qualified with four published studies to assess the precision.6, 15–17 This qualification was performed by comparing simulated and observed pharmacokinetic parameters of LTG IV and oral dose states, as seen in Table 5. Prediction values of Cmax and AUC were noted for each model, and the quantitative relationship between observed-to-predicted (obs/pred) for these parameters was determined to express the closeness of simulated data with the observed data. The qualification results affirmed the reasonable predicting ability of our model as all the predicted Cmax and AUC values were between 0.5 to 2 times of the observed values, which is reasonable for PBPK models.18, 19
Certain discrepancies in the model were addressed by making essential assumptions because of differing software platforms (PK-Sim vs. Simcyp vs. GastroPlus). Because of a lack of enzyme-specific information of UGT enzymes like half maximal effective concentration (EC50), maximum effect (Emax) or inhibitor constant (Ki) value in the interaction model, the overall clearance was altered based on the reported change in concentration. Using clearance as a surrogate was a limitation, but it makes clinical sense, so this approach was used for this study. The patient information used for the inhibition model prediction comparison has demographic data of just two patients. This is a limitation, and the model requires validation with more clinical data. Differences in the creation of PBPK models, as well as variations in their methodologies, may restrict their application. These differences have been addressed in the study, and the developed PBPK model has to be clinically evaluated in prospective studies. 29
Conclusion
To summarize, a mechanistic, quantitative framework predicting multiple pharmacokinetic profiles of LTG has been developed in the present study. A combination of in silico, in vitro, and in vivo data was used for our PBPK simulations and qualifications. With the results of our study, we are able to infer that the European template data in PK-Sim can be used as the standard population in PBPK simulators in place of the South Asian Indian population. We are also able to recommend the use of our LTG PBPK model to predict further drug interactions and devise appropriate dosage adjustments required. Our model can also be scaled from one population to another that is from adults to pediatrics or pregnant women, thus providing flexibility to our model.
Footnotes
Ethical Statement
This study did not require any Institutional Ethics Committee approval or Informed consent as the clinical data used for validation was taken from an already published study.
Declaration of Conflicting Interests
The authors declared no potential conflicts of interest with respect to the research, authorship, and/or publication of this article.
Funding
The authors received no financial support for the research, authorship, and/or publication of this article.