
Abstract
Objective
To optimize dosing adjustments in patients with renal impairment who were coadministered with P-glycoprotein inhibitors—verapamil or amiodarone—using a physiologically based pharmacokinetic model.
Methods
The developed physiologically based pharmacokinetic model was corroborated using previously reported pharmacokinetic parameters across multiple doses, ratio values in drug–drug interactions, and pharmacokinetic ratio values in patients with renal impairment.
Results
The physiologically based pharmacokinetic model exhibited fold errors between 0.7 and 1.3 and effectively illustrated changes in pharmacokinetic ratios in patients with renal impairment. The model suggested that the dosing regimen of betrixaban should be reduced to 40 mg once daily in patients with mild renal impairment who were administered with verapamil or amiodarone. Additionally, it is advised that the dosing regimen of betrixaban be reduced to 40 mg once daily in patients with moderate renal impairment who were administered with amiodarone, whereas no suitable dosing is recommended for those administered with verapamil. For patients with severe renal impairment, it may be reasonable to avoid concurrent use of betrixaban with P-glycoprotein inhibitors.
Conclusions
The coadministration of P-glycoprotein inhibitors elevates the exposure of betrixaban and may heighten the risk of major bleeding. Reduced dosing regimens are recommended for patients with renal impairment when betrixaban is coadministered with P-glycoprotein inhibitors.
Keywords
Introduction
Thrombosis, also known as pathological blood clotting, is the leading cause of death globally, accounting for 25% of all deaths worldwide. 1 There are two main types of thrombosis: venous thrombosis and arterial thrombosis. Anticoagulation therapy is crucial in preventing venous thromboembolism (VTE). 1 Direct oral anticoagulants (DOACs) have emerged as preferred agents owing to their ease of use, improved tolerability, and reduced bleeding risk compared with warfarin.2–4 However, the narrow therapeutic index of DOACs requires careful consideration of drug–drug interactions (DDIs) and individualized dosing regimens.2,5–7
Betrixaban (BET) is a factor Xa inhibitor, administered at a dose of 80 mg once daily (OD), indicated for the prophylaxis of VTE in adult patients.8,9 It belongs to the class of DOACs with a narrow therapeutic index. 10 The pharmacokinetic (PK) properties of BET in humans have been well-studied. The primary route of elimination is hepatobiliary, with approximately 85% of BET recovered in feces and 11% in the urine following oral administration. 11 Furthermore, the absolute oral bioavailability of BET is 34%. 11 It is also a substrate of P-glycoprotein (P-gp) and exhibits minimal metabolism by cytochrome P450 enzymes (<1%). 10 The renal clearance of BET exceeds the glomerular filtration rate (GFR) and accounts for approximately 25% of total systemic clearance,10,12 which can be attributed to active apical P-gp-mediated secretion in renal tubular epithelial cells. In human plasma, the two primary metabolites—PRT062802 and PRT063069—have been identified with an approximately 18% area under the curve (AUC) ratio to the parent (BET). None of them have been shown to be active for factor Xa. 10
Verapamil (VER), a strong P-gp inhibitor, and amiodarone (AMI), a moderate P-gp inhibitor, are among the most commonly used P-gp inhibitors.13,14 DDIs involving VER or AMI often raise concerns when coadministered with P-gp substrates. For instance, the coadministration of VER and AMI has been shown to significantly increase the plasma concentration of certain non-vitamin K antagonist oral anticoagulants that are substrates of P-gp. 15 An increased risk of bleeding events has been associated with the concurrent use of P-gp inhibitors. 11 The concurrent use of VER, AMI, and oral anticoagulants is common in clinical practice, as they are essential for managing atrial fibrillation. Previous PK studies have suggested that the coadministration of VER and AMI can lead to a 2.0-fold and more than 3.0-fold increase in the trough plasma concentration of BET and AUC ratio, respectively.4,10
An increased risk of bleeding events has been associated with severe renal impairment after BET administration.10,12 The plasma protein binding capacity of BET is 60%, and approximately 11% BET is renally excreted. Therefore, the excretion of BET can be significantly affected by renal impairment. Furthermore, the complex drug elimination mechanisms and the potential for DDIs pose significant challenges in the application of BET in special populations, such as those with renal impairment, especially when coadministered with P-gp inhibitors. An improper dosing regimen in these populations, combined with complicated co-medications, could significantly increase BET exposure, subsequently leading to a markedly elevated risk of bleeding events.
Physiologically based PK (PBPK) models are robust tools for predicting DDIs and PK changes in diseased populations.16,17 Moreover, PBPK models have been extensively applied in simulating PK-related DDIs and predicting PK changes in populations with renal impairment.18–20 Miyake et al. 21 reported a PBPK study on BET, wherein they evaluated the P-gp-mediated DDI in human MDR1 mice. In the current study, we aimed to develop a PBPK model for BET that includes renal clearance mechanisms such as GFR, passive tubular reabsorption, and active apical P-gp-mediated secretion. This model was subsequently utilized to simulate complex PK-related DDIs between BET and two P-gp inhibitors in populations with renal impairment. Dose adjustment of BET is recommended when coadministered with P-gp inhibitors in patients with renal impairment during VTE management.
Methods
PBPK model development and verification
PBPK model development and PK and DDI simulations were performed using PK-Sim software (Version 9.1, Bayer Technology Services, Leverkusen, Germany). The observed clinical PK and DDI data in individuals with normal renal function and patients with renal impairment were obtained from the literature.10,22 System-specific parameters of individuals with normal renal function were sourced from the existing PK-Sim database, whereas those of patients with renal impairment were sourced from the relevant studies. 23 Detailed drug-specific parameters are presented in Table 1.10,11,21,24
Pharmacokinetic properties of BET used in PBPK simulations.

BET: betrixaban; GFR: glomerular filtration rate; PBPK: physiologically based pharmacokinetic; P-gp: P-glycoprotein; Peff: human effective permeability, CLH: hepatic clearance, CLPTF: passive tubular filtration.
PBPK model development
The distribution of BET across various organs and tissues, along with cellular permeability calculations, was determined using the built-in Rodgers and Rowland method and standard PK-Sim, respectively. Additionally, the organ-to-plasma partition coefficient (Kp scale) was optimized to 3.0 for a better description of BET distribution. The model also incorporated the active efflux clearance of BET mediated by P-gp. The intrinsic transport velocities (Vmax and Km) for P-gp related to BET were sourced from the literature. 21 Other drug-specific parameters for BET were obtained from published studies. All parameters used in the PBPK model for VER, AMI, and the active metabolite MDEA were derived from the literature.25,26 The virtual demographic characteristics for the DDI simulations were set based on the published studies. 22 BET was administered for 14 days to achieve a steady state.
PBPK model verification
The multiple clinically observed PK data of BET at various doses were utilized to validate the predictive accuracy of the PBPK model for BET. The dosing regimens of BET were consistent with those described in previous studies.10,22 The model’s prediction accuracy was assessed using the ratio of predicted to observed values of AUC, Cmax (peak concentration), and Cmin (trough concentration at steady state). Similarly, the PBPK models for VER and AMI were verified using the ratio of predicted to observed values of AUC and Cmax. Although the commonly accepted criterion ranges from 0.5 to 2.0, 25 our study established a more stringent acceptable criterion of 0.7–1.3 for improved prediction accuracy.
Prediction of DDIs with P-gp inhibitors
The developed PBPK model for BET was integrated with the PBPK models for VER and AMI to predict the DDI risks associated with BET. The inhibition constants for VER and AMI against P-gp are detailed in Table 2.27,28 In DDI simulations, the dosage regimen for BET was set at 40 mg OD, whereas VER and AMI were administered at dosages of 80 mg three times daily (TID) and 400 mg TID, respectively. The dosing regimens used in this study were consistent with those employed in the referenced clinical trials.10,22 BET was coadministered with the two P-gp inhibitors for 14 days. The virtual demographic characteristics used in the DDI simulations were sourced from published studies. 22 All DDI simulations were conducted using a population of 10 individuals in a fasting state. The PBPK models for VER and AMI were developed based on the literature.25,26 The DDI simulations were validated against clinically observed DDI studies involving BET and VER as well as AMI.10,22
The inhibition constant of P-gp inhibitors.

VER: verapamil; AMI: amiodarone; P-gp: P-glycoprotein; NDEA: N-desethylamiodarone.
Metabolite of AMI.
Prediction of PK for BET in patients with renal impairment
PKs were simulated in a virtual population with renal impairment, categorized as mild (estimated GFR, 60–90 mL/min), moderate (eGFR, 30–60 mL/min), and severe (eGFR, 15–30 mL/min) renal impairment. The physiological parameters of patients with renal impairment were obtained from the literature. 23 The plasma protein scale factor in PK-Sim was adjusted to reflect changes in plasma albumin concentration and the free drug fraction.29,30 Additional modified physiological parameters used in the model for patients with renal impairment are provided in Supplementary Table S1. Simulations for renal impairment were conducted using a 40 mg dose of BET.
Simulation of DDI risk and optimum dosing regimen for BET in patients with renal impairment who were coadministered with P-gp inhibitors
To evaluate the impact of renal impairment on the DDIs of VER/AMI and BET, DDIs were simulated in a virtual population with renal impairment. We referred to the research methods presented in the literature. 31 The mean BET Cmax and Cmin at steady state, along with respective 95% confidence interval (CI) values among patients with VTE and those with moderate renal impairment, were defined as the efficacy window of BET for the simulations of long-term treatment.
Based on previous studies,10,22 the dosing regimen of 80 mg OD for BET in patients with VTE and those with moderate renal impairment is clinically effective, with an acceptable bleeding risk. To ensure clinical efficacy and safety, it is recommended to maintain the plasma Cmin of BET between 14.5 and 37.8 ng/mL and the Cmax below 118.5 ng/mL. The Cmin of 14.5 ng/mL is defined using the Cmin value of BET following 80 mg OD in patients with VTE, whereas the Cmin of 37.8 ng/mL is based on the upper 95% CI values of Cmin following 80 mg OD in patients with VTE and moderate renal impairment. The value of 118.5 ng/mL was derived from the mean Cmax of BET values following 80 mg OD in patients with VTE and moderate renal impairment.
To meet these criteria in patients with renal impairment, various dosage regimens of BET, ranging from 10 mg to 40 mg OD when coadministered with P-gp inhibitors, were simulated. The demographic characteristics of the virtual population were aligned with those of the clinical study conducted by Gibson. 22 Through these simulations, the PBPK model can predict plasma Cmax and Cmin for different BET dosage regimens, facilitating the identification of bleeding risk and the development of an optimal dosing strategy for clinical treatment.
Results
PBPK model verification for BET
As shown in Table 3, the population-based PBPK model predicted the geometric mean PK parameters (AUC and Cmax) for BET after oral administration of 40, 80, and 120 mg BID for 10 consecutive days. The mean Cmin was predicted following oral administration of 40 and 80 mg OD for 14 consecutive days. The simulations indicated that the observed and predicted PK parameters were closely aligned.10,22 The ratios of AUC, Cmax, and Cmin consistently fell within the acceptable range of 0.7–1.3, demonstrating a high degree of concordance between the simulated and observed PK parameters. The simulation demonstrates that the developed PBPK model can accurately predict the PK data of BET in humans.
Predicted and observed geometric mean PK parameters for BET.

BID: twice daily; AUC: area under the PK curve; Cmax: peak concentration; Cmin: trough concentration at steady state; OD: once daily.
Verification of DDI models with P-gp inhibitors
The PK-DDI ratios predicted by the population-based PBPK model are summarized in Table 4. The Cmax and AUC336–360 ratios for 40 mg of BET coadministered with 80 mg of VER were approximately 3.26 and 3.49 times higher, respectively, than those for BET alone. The predicted AUC ratio aligned well with the observed AUC ratio, whereas the predicted Cmax ratio was lower than the clinically observed ratio. 10 Conversely, the predicted Cmin ratios for BET at 40 mg and 80 mg OD coadministered with 400 mg of AMI were 1.34 and 1.36, respectively (Table 4), which were very close to the observed values. 22 The prediction results indicated that the PBPK model can accurately predict the PK-DDI ratios of BET when used concurrently with P-gp inhibitors
PK parameter changes of BET with P-gp inhibitors.

BET: betrixaban; VER: verapamil; AUC: area under the curve; AMI: amiodarone; P-gp: P-glycoprotein.
Prediction and verification of PK in patients with renal impairment
Population-based PBPK simulations for BET were performed in patients with renal impairment using repeated daily doses of 40 mg and 80 mg OD for 14 consecutive days. The predicted and observed ratios of PK parameters are presented in Table 5. The simulations indicated that the predicted Cmax and AUC ratios were in line with the observed PK ratios in patients with mild and moderate renal impairment. 10 However, the predicted Cmin, Cmax, and AUC ratios were slightly higher than the observed values at 40 mg OD in patients with severe renal impairment. Additionally, the predicted Cmin ratios were consistent with the observed values, except for Cmin at 40 mg OD in patients with severe renal impairment, where the value was overestimated. Overall, the simulations demonstrate that the PBPK model is capable of predicting the PK changes of BET in patients with renal impairment.
Comparison of means for PK parameters of BET in patients with renal impairment.

AUC: area under the curve; PK: pharmacokinetic.
Simulation of DDI risk and optimum dosing regimen for BET in patients with renal impairment who were coadministered with P-gp inhibitors
Prediction of DDIs in patients with renal impairment
For patients with VTE and moderate renal impairment, the Food and Drug Administration (FDA) suggested that no dose adjustment is necessary, as these patients had no clinically meaningful bleeding risk compared with those with normal renal function. 10 Therefore, a dosing regimen of 80 mg OD for patients with moderate renal impairment was used as the reference regimen. The PBPK model for BET has been extensively validated against various clinically observed PK data under different dosing regimens. Additional verifications were conducted to confirm the predictive capabilities of the DDI simulations when coadministered with P-gp inhibitors as well as the application of PBPK models in patients with renal impairment.
As shown in Figure 1, the coadministration of VER in patients with renal impairment increased the exposure to BET. For patients with moderate renal impairment, an 80 mg OD dose of BET resulted in Cmax, Cmin, and AUC ratios of 1.38 (90% CI: 0.80–2.39), 1.24 (90% CI: 0.82–2.02), and 1.51 (90% CI: 0.85–2.12), respectively. In contrast, for patients with severe renal impairment, a 40 mg OD dose of BET led to Cmax, Cmin, and AUC ratios of 1.76 (90% CI: 0.94–2.48), 1.94 (90% CI: 1.23–2.70), and 1.80 (90% CI: 1.07–2.70), respectively. In comparison, the coadministration of AMI had a smaller impact on BET exposure than concurrent use with VER. For patients with moderate renal impairment, an 80 mg OD dose of BET resulted in Cmax, Cmin, and AUC ratios of 1.15 (90% CI: 0.77–1.77), 1.09 (90% CI: 0.72–1.85), and 1.17 (90% CI: 0.94–1.58), respectively. In patients with severe renal impairment, the ratios were 1.27 (90% CI: 0.81–2.48), 1.52 (90% CI: 0.90–1.98), and 1.36 (90% CI: 0.68–2.46), respectively. Additionally, larger variabilities (90% CI) in DDIs were observed in patients with moderate renal impairment than in those with severe renal impairment.

Predicted Cmax, Cmin, and AUC ratio of BET under different dosing regimens coadministered with VER and AMI for patients with renal impairment. The Cmax, Cmin, and AUC ratio were computed against the reference values when BET 80 mg OD and 40 mg OD were administered in patients with moderate and severe renal impairment, respectively. The horizontal line represents 90% CI of the simulated data, and the square represents the geometric mean of the data. AMI: amiodarone; AUC: area under the curve; BET: betrixaban; CI: confidence interval; Cmax: peak concentration; Cmin: trough concentration at steady state; VER: verapamil; OD: once daily.
Model-based dosing adjustment
It was reported that patients using a P-gp inhibitor concomitantly have an increased risk of bleeding, with the incidence of major or clinically relevant nonmajor bleeds rising from 2.6% to approximately 3.7%–4.8%. 10 For patients with severe renal impairment, the bleeding risk associated with BET increased to 7.3% when the treatment duration exceeded 30 days. Therefore, dosing regimens of BET in patients with renal impairment who are coadministered with a P-gp inhibitor should be carefully considered.
Additional simulations were conducted to refine dosing regimens (Figure 2). Following 14 days of BET treatment at various doses in patients with renal impairment, the simulations indicated that a reduced dosing regimen of BET at 40 mg OD is necessary when coadministered with VER or AMI, in accordance with the dosage adjustment criteria mentioned in section 2.4. Similarly, it is recommended that the dosing regimen of BET be reduced to 40 mg OD in patients with moderate impairment taking AMI. However, no suitable dosing regimen for BET is recommended for patients with moderate impairment when coadministered with VER. A 20 mg OD dose may be considered for patients with severe renal impairment when coadministered with AMI or VER based on the PBPK model.
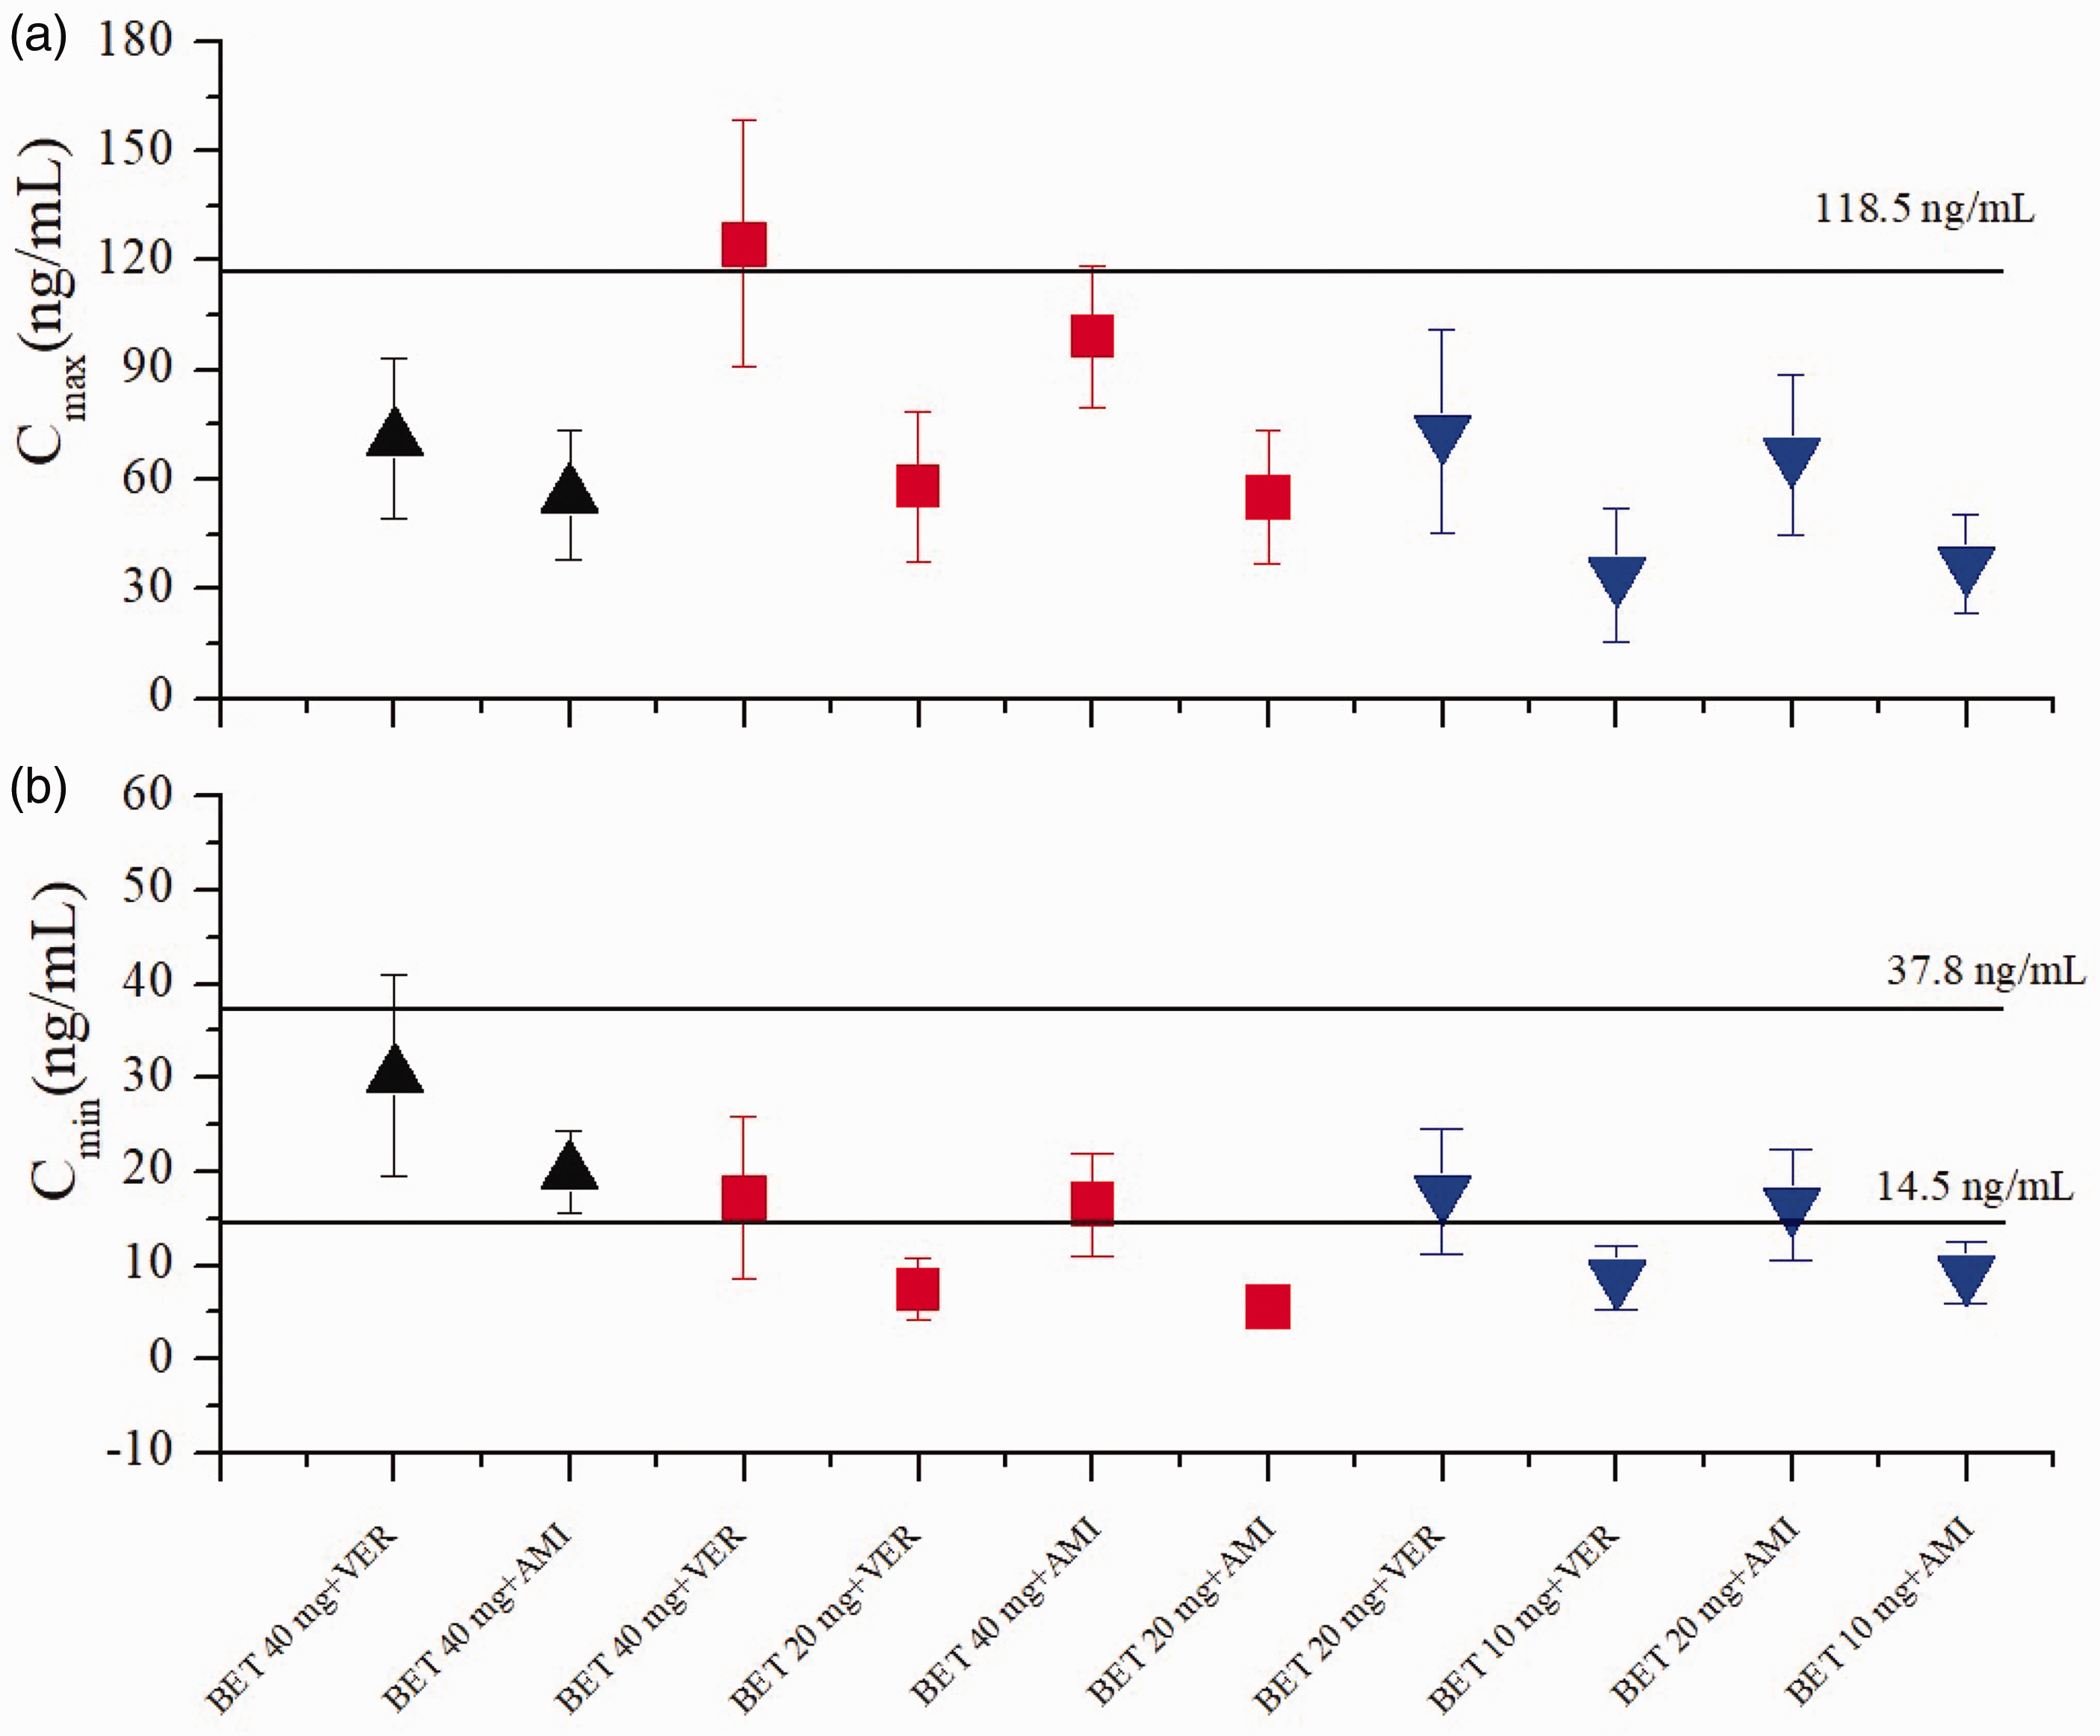
Simulated plasma Cmax (a) and Cmin (b) of BET among patients with renal impairment who were coadministered with P-gp inhibitors. Horizontal solid black lines (a) represent the maximal safety plasma concentration. Horizontal solid black lines (b) indicate the reported mean Cmin range of BET, which defines the efficacy window. Black solid upward triangles represent patients with mild renal impairment, red solid squares represent patients with moderate renal impairment, and blue solid downward triangles represent patients with severe renal impairment. BET: betrixaban; Cmax: peak concentration; Cmin: trough concentration at steady state; P-gp: P-glycoprotein.
Discussion
This study successfully developed a PBPK model for BET in patients, enabling simulations of PK data in the plasma. To date, we identified only two published clinical plasma PK studies10,22 for comparison with our predicted results. The PBPK predictions were validated using these two clinical plasma PK datasets, along with DDI data involving the two P-gp inhibitors, and PK ratios in patients with renal impairment (Tables 3–5).10,22
To the best of our knowledge, this is the first reported assessment of the increased exposure and major bleeding risk associated with BET in patients with renal impairments when coadministered with VER and AMI, utilizing a PBPK model. In this study, a Cmin of 14.5–37.8 ng/mL was identified as a predictor of clinical efficacy and safety, based on the exposure–response relationship in patients with moderate renal impairment at a dose of 80 mg of BET. 22 Additionally, a plasma Cmax of <118.5 ng/mL was used as a threshold of clinical safety, derived from the Cmax values in patients with moderate renal impairment at the same dose of 80 mg of BET. Moreover, food can affect the PK of BET, with the FDA reporting an approximately 60% reduction in Cmax and AUC. However, it is important to note that the clinical DDI study was performed in a fasting state. 10 Therefore, to accurately compare our predicted results with the observed clinical data, we also obtained our results a fasting condition. Additionally, the effect of food on BET’s steady-state Cmin is relatively small. The established Cmin range in this study would theoretically increase the associated safety.
The major challenge in accurately predicting P-gp-mediated DDIs lies in identifying or obtaining the appropriate Ki values for P-gp inhibitors, which are crucial inputs for the PBPK model. 27 However, different Ki values have been reported across various studies, stemming from in vitro inhibition experiments. Due to multiple influencing factors, using Ki values from in vitro studies directly can lead to significant discrepancies. Therefore, optimization and verification of in vitro parameters against in vivo DDIs are warranted in the current study. In this study, a Ki value of 0.1 µM for VER against P-gp was utilized. This value was validated as reasonable in the literature, 27 using VER and the classical P-gp substrate digoxin as the probe substrates. Additionally, Ki values for AMI and its active metabolite N-desethylamiodarone against P-gp were set at 8.94 and 5.36 µM, respectively. Both values were derived from the literature and verified through the prediction of metabolic and P-gp-mediated DDIs upon concomitant administration. 28 These verified Ki values for the two inhibitors against P-gp were incorporated into the current PBPK model to ensure prediction accuracy.
It has been reported that patients using a P-gp inhibitor concomitantly experience an increased risk of bleeding, with the incidence of major or clinically relevant nonmajor bleeds rising from 2.6% to approximately 3.7%–4.8%. For patients with severe renal impairment, the bleeding risk associated with BET increases to 7.3% when the treatment duration exceeds 30 days. 10 Furthermore, the exposure–response relationship for safety indicates that the correlation between BET plasma concentration and major bleeding risk is significant in multivariate testing. 32 Therefore, dosing regimens of BET in patients with renal impairment who are coadministered with a P-gp inhibitor should be carefully considered. Based on the simulations (Figure 1), compared with the VTE population with corresponding renal impairment, the increase in major bleeding risk with BET in patients with moderate renal impairment when coadministered with VER is relatively smaller (1.38-fold) than in those with severe renal impairment (1.94-fold). Similar results were observed when BET was administered with AMI, showing an increase of 1.15-fold in moderate renal impairment compared with 1.52-fold in severe renal impairment.
The PBPK model indicates that the dosing regimen of BET should be reduced to 40 mg OD in patients with mild renal impairment when coadministered with VER or AMI. Additionally, it is recommended that the dosing regimen of BET also be reduced to 40 mg OD in patients with moderate renal impairment taking AMI, whereas no appropriate dosing is suggested with VER. These recommendations align with the clinical study. 32 For patients with severe renal impairment, the PBPK model suggests a further reduction of the dosing regimen to 20 mg OD. However, since the minimum dosage strength available is 40 mg, it may be more reasonable to avoid concurrent use of BET with P-gp inhibitors in patients with severe renal impairment. This recommendation is also consistent with clinical suggestions. 9 It is important to note that with VER, the BET Cmin is below the efficacy threshold at a dose of 20 mg OD, whereas the BET Cmax surpasses the safety threshold at 40 mg OD. This indicates that no suitable BET dosing regimen is available for patients with moderate renal impairment receiving VER (Figure 2).
The widely accepted 2-fold criterion for fold error serves as a metric for PBPK modeling assessment in the contemporary pharmaceutical industry.25,33 In this study, a fold error criterion of 0.7–1.3 was employed as the metric for evaluating model performance. The AUC among PK parameters often exhibits significant variability due to uncertainties arising from different clinical trials or analytical methods. 34 In this study, more precise Cmin and Cmax values were utilized as the criteria to establish the threshold values for safety and efficacy, drawing upon methodologies outlined in the published literature.25,35,36 It is also important to acknowledge that PBPK modeling relies on prior knowledge, which may introduce uncertainties in the prediction of DDIs involving DOACs.
This study had several limitations. First, although some physiological parameters in patients with renal impairment were incorporated into the PBPK model, not all altered physiological parameters could be included. Second, the virtual populations generated within the PBPK model did not fully replicate real-world patients. Moreover, although the relationship between major bleeding risks and BET plasma concentration within the population has been explored and confirmed, there is an absence of a systematic mathematical quantification of the relationship between multiple plasma concentrations and bleeding risk. Additionally, renal impairment constitutes an independent risk factor for bleeding events due to pathological changes in coagulation systems. 37 Consequently, the clinical outcomes of the proposed dosing strategies, including the incidence of stroke or bleeding risks, remain to be validated in prospective clinical trials.
Conclusion
This study represents the first PBPK modeling-based study of DDIs involving BET and VER or AMI in patients with renal impairment. The coadministration of BET with VER or AMI can significantly elevate plasma exposure to BET, potentially increasing the major bleeding risk associated with BET. Therefore, it is advisable to reduce dosing regimens for patients with VTE and mild or moderate renal impairment who are concurrently administered VER or AMI. Additionally, concurrent use with P-gp inhibitors should be avoided in patients with severe renal impairment. Overall, the PBPK model provides valuable insights for optimizing BET dosing regimens in patients with renal impairment when coadministered with P-gp inhibitors.
Supplemental Material
sj-pdf-1-imr-10.1177_03000605251346587 - Supplemental material for Predicting drug–drug interactions and optimal dosing of betrixaban with physiologically based pharmacokinetic modeling in patients with renal impairment who were coadministered with P-glycoprotein inhibitors
Supplemental material, sj-pdf-1-imr-10.1177_03000605251346587 for Predicting drug–drug interactions and optimal dosing of betrixaban with physiologically based pharmacokinetic modeling in patients with renal impairment who were coadministered with P-glycoprotein inhibitors by Xiaoping Yan, Lirong Xiao and Weina Xie in Journal of International Medical Research
Footnotes
Acknowledgements
We thank Zhongjian Wang for his technical support in PK-Sim calculation. Moreover, we have used ZhiPU QingYan (version 1.0.33, Beijing Zhipu AI Technology Co., Ltd) for language improvement during the preparation of this manuscript.
Author contributions
Xiaoping Yan was responsible for drafting the manuscript, creating all tables and figures, and conducting the investigation, methodology conceptualization, and conceptualization of the study. Lirong Xiao was responsible for data curation. Weina Xie was responsible for software calculations. All authors critically reviewed the manuscript.
Data availability statement
The study contains original contributions that are detailed in the article and Supplementary Material.
Declaration of conflicting interests
The authors declare no conflict of interest.
Funding
This research received no external funding
References
Supplementary Material
Please find the following supplemental material available below.
For Open Access articles published under a Creative Commons License, all supplemental material carries the same license as the article it is associated with.
For non-Open Access articles published, all supplemental material carries a non-exclusive license, and permission requests for re-use of supplemental material or any part of supplemental material shall be sent directly to the copyright owner as specified in the copyright notice associated with the article.