
Abstract
Introduction:
Genetic testing has revolutionized the clinical landscape by enabling rapid diagnosis, promoting translational research, and improving chances for actionability. With plummeting sequencing costs, Whole Genome Sequencing is becoming widely accessible and is paramount in identifying novel disorders or atypical presentations. The pipelines are now robust enough to uncover substitutions, small indels and also those which are typically not elucidated by sequencing strategies like copy number changes, repeat expansions, etc.
Methods:
We present two clinical cases, one with a copy number variation and another with a triplet repeat expansion, both of which were missed on the exome sequencing and fragment analysis, respectively, and eventually were diagnosed with Whole Genome Sequencing.
Results:
Whole Genome Sequencing may not be the primary test of choice in either case. However when limited panel tests fail despite being sensitive and specific, it might lead to unnecessary broader-spectrum testing and distress. Therefore, it is worth looking into the possibility of common errors before ordering expensive and extensive tests. Rechecking the previous data in clinical cases with classic presentations and strong family history may be cumbersome, but it is a valuable exercise before proceeding with the chase for rarer and novel genetic disorders.
Keywords
Introduction
Next-generation sequencing (NGS) has transformed modern medicine by uncovering novel genes, disease-gene relationships, and deepening the understanding of diseases. Exome sequencing, which comprises the coding portions of the genome (1%–2%), became a ubiquitous clinical tool in view of its efficacy, cost-effectiveness, and ease of bioinformatics analysis. Its utility has expanded beyond the simple point substitutions to reveal other genetic variations like small copy number changes, small repeat expansions, rearrangements, etc. However, large copy number variations (CNVs) still pose an impediment for detection due to probe design limitations, exon-focused coverage, and poor representation of intronic or intergenic regions.[1]
We present two cases where large pathogenic variants were missed on initial testing, underscoring the need for complementary testing approaches in genetic diagnostics.
Case 1
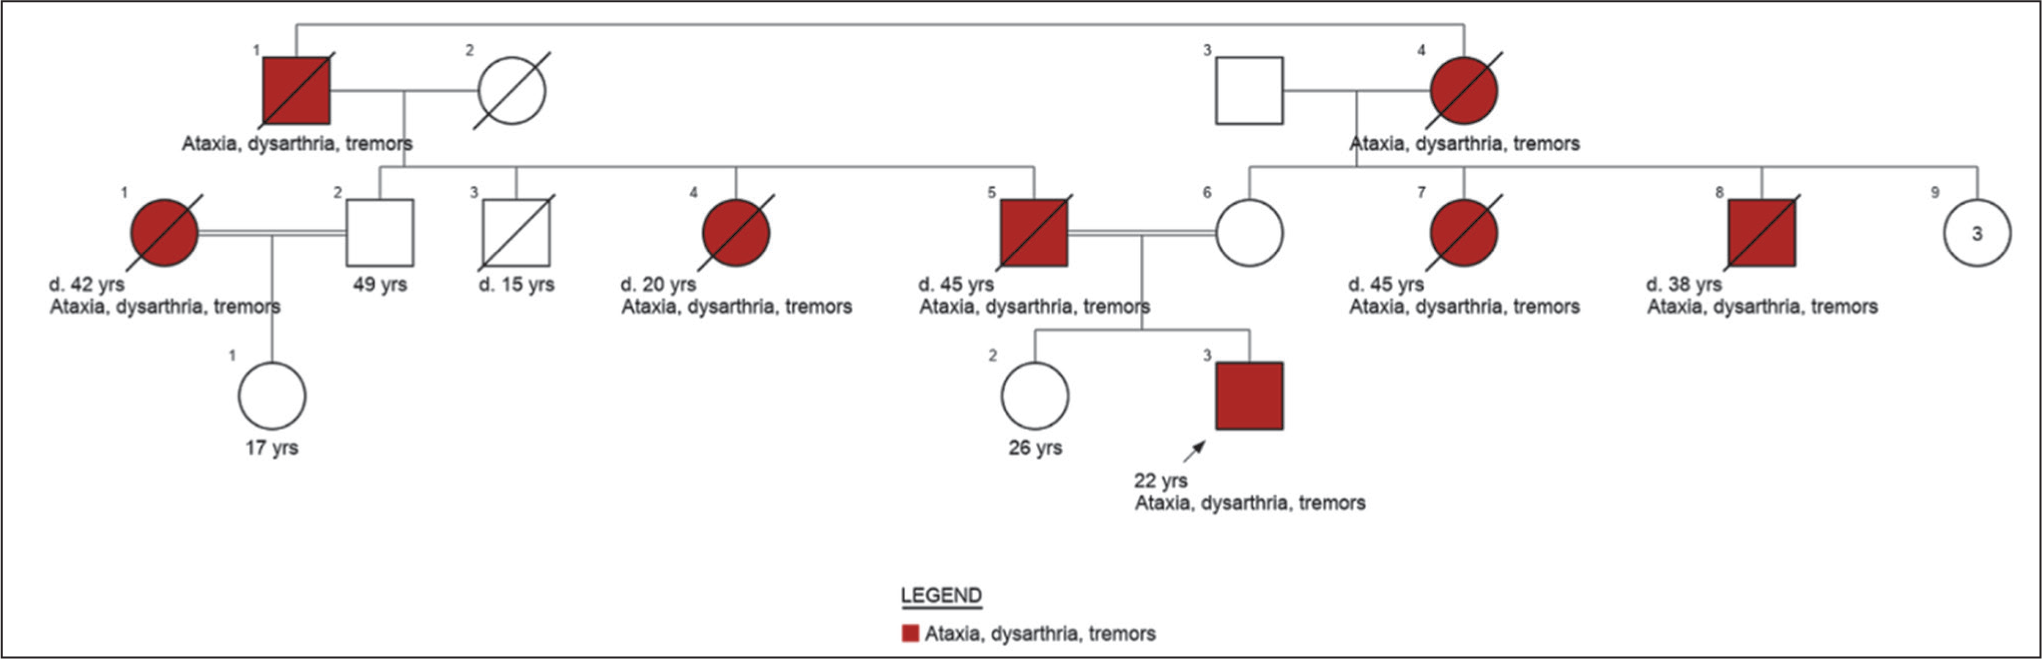
A 22-year-old male presented with progressive cerebellar symptoms since 16 years of age, including postural unsteadiness, altered gait, hand tremors, reduced sandal grip, and paraesthesia in hands and feet. His father passed away due to a similar illness at 45 years of age. Given parental consanguinity, there was a strong history of symptoms on both sides of the family, across three generations [Figure 1]. MRI brain showed prominent cerebellar atrophy. This led to a provisional diagnosis of SCA or Friedreich ataxia (FA). However, samples sent to a standard accredited lab for fragment analysis for common SCA types 1, 2, 3 and FA by Triplet primed polymerase chain reaction (PCR) were negative. Exome sequencing was requested from the same lab to identify rarer de novo and autosomal recessive SCAs, which also turned out negative. Genome sequencing was reluctantly discussed, and the family agreed, despite the costs and the samples were sent to another private accredited lab. While novel variants were absent, a repeat expansion in the Ataxin 3 gene was suspected, corresponding to SCA type 3. Fragment analysis followed on the same sample, and to our utter astonishment, it was indeed Spinocerebellar ataxia, type 3!
Pedigree of case 1 (made using Invitae Family History tool)
Case 2
A 5-year-old female child was presented with global developmental delay, intellectual disability, seizures, and microcephaly. She was the first offspring of non-consanguineous parents, born via a term caesarean section. An antenatal scan done at the fifth month detected bilateral ventriculomegaly measuring 13–15 mm, persisting throughout the gestation. The maternal TORCH test was negative. The couple was not referred to a Geneticist and therefore, not subjected to any genetic testing, until the seizures manifested.
On clinical examination, the child was cheerful with responses to some simple queries. Dysmorphism included microcephaly, open anterior fontanelle, sloping forehead, hypertelorism, narrow, up-slanting palpebral fissures (left > right), malar hypoplasia, broad nasal bridge with bulbous nasal tip and thick alae nasi, short philtrum, wide mouth, high arched palate, premature eruption of secondary dentition, low set, large, deformed ears and a pointed chin. The child also displayed appendicular hypotonia, laxity of elbow joints and thumbs, cutaneous syndactyly and a proximally placed anus. The head circumference was –3 standard deviations (SD), length at –2.8 SD, and weight at –3.3 SD for the age, as per World Health Organization growth charts.
WES ordered by primary clinician revealed a heterozygous c.2479A>C (p.Lys827Gln) missense variant of uncertain significance in PACS2, associated with developmental epileptic encephalopathy 66 (DEE 66). The variant had partial phenotypic overlap and segregated in the asymptomatic mother through Sanger sequencing. Considering the possibility of a missed CNV, further testing options like high-resolution chromosomal microarray or Whole Genome Sequencing were discussed. The latter revealed the same PACS2 variant, but also uncovered two pathogenic CNVs.
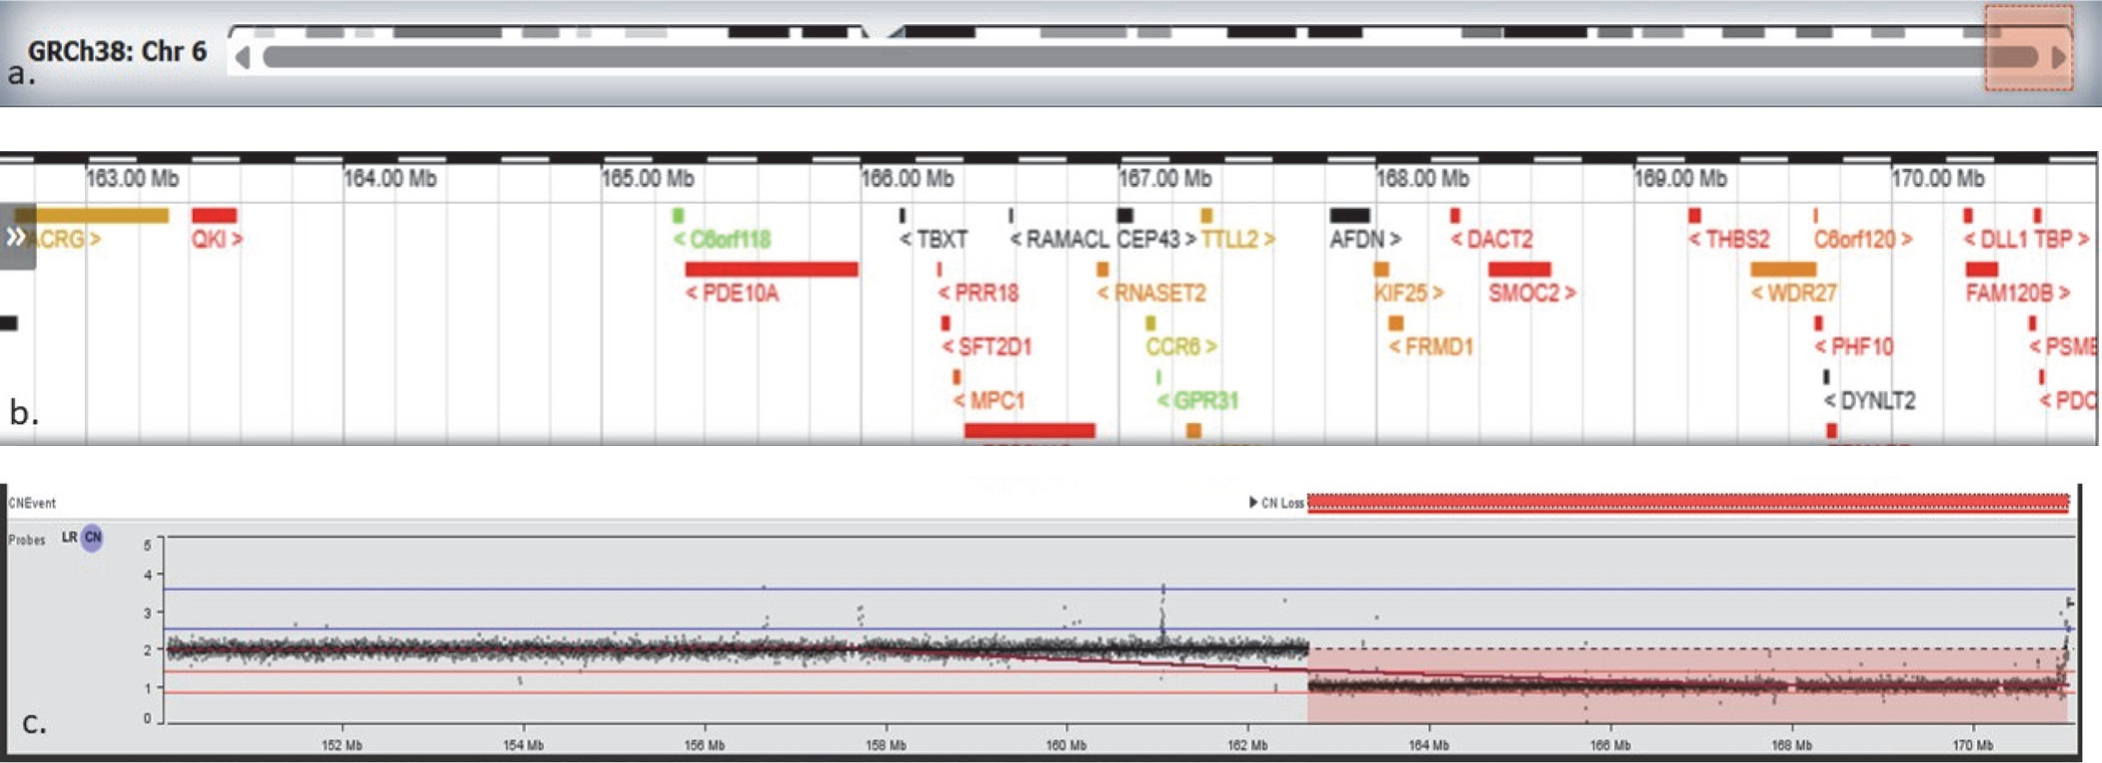
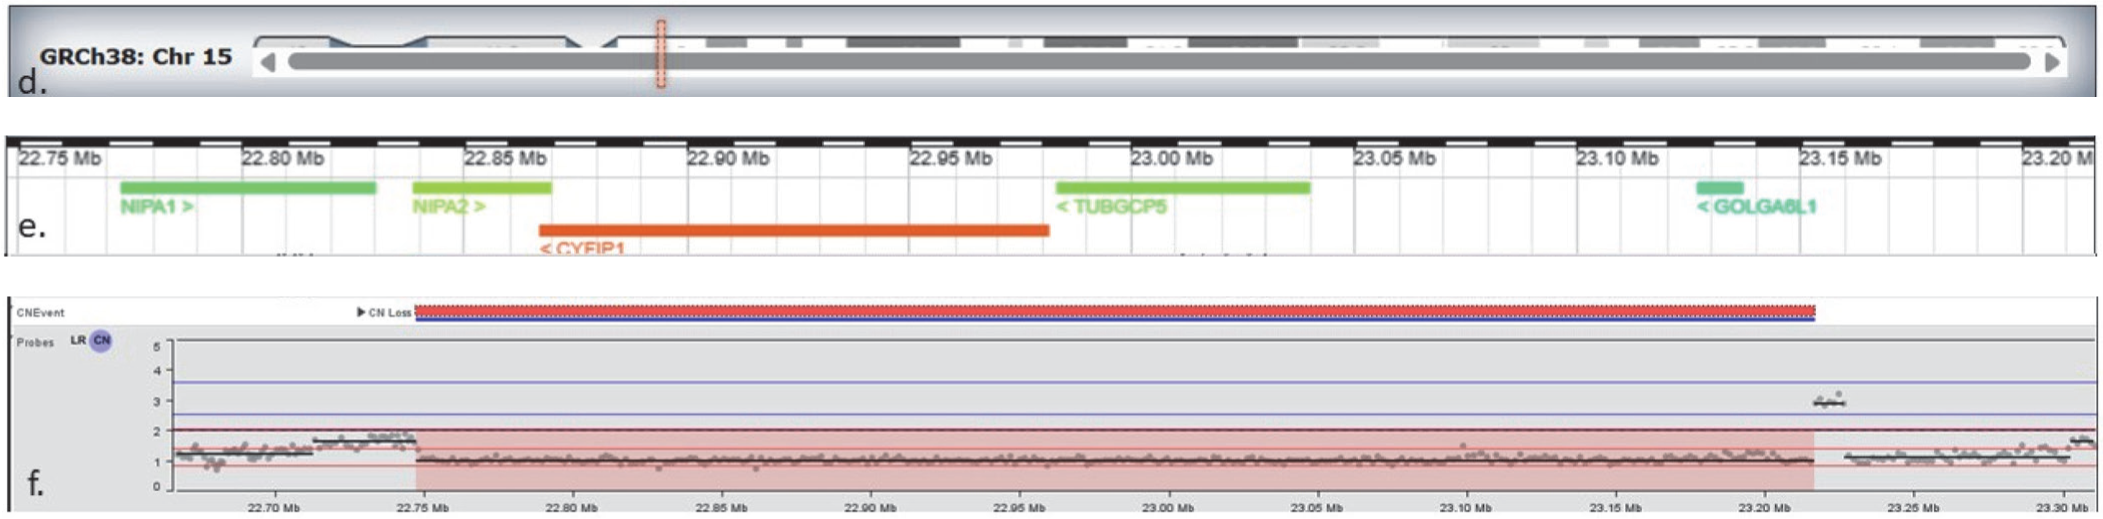
The first one was an 8.4 Mb terminal deletion of chromosome 6q26-q27 encompassing 28 OMIM genes [Figure 2A]. This deletion was reported in other individuals with similar symptoms and was a complete phenotypic match to our patient. The second was a 469.3 kb deletion of chromosome 15q11.2, encompassing 4 OMIM genes including TUBGCP5, CYFIP1, NIPA2, and NIPA1 [Figure 2B]. This copy number loss spans chromosome 15 breakpoints 1 to 2 (BP1-BP2) and is associated with 15q11.2 deletion syndrome (OMIM# 615656). Although our patient had a few overlapping symptoms, we could not be sure if her symptoms resulted from a single diagnosis (like 6q26–q27 deletion) or a blended phenotype. A chromosomal microarray (750K) was ordered for the parents, and it revealed the mother to be an asymptomatic carrier of 15q11.2 deletion.
Chromosomal analysis showing terminal deletion on chromosome 6q26–q27. The top panel (a) shows the location of the deleted segment on chromosome 6. The panel (b) displays genes located within this region. The panel (c) shows probe signal intensity across chromosome 6; values around 2 represent the normal two copies of DNA, while the drop to approximately 1 in the shaded region indicates loss of one copy (deletion) on chromosome 6. This deleted segment contains 28 OMIM genes
Chromosomal analysis showing terminal deletion on chromosome 15q11.2. The panel (d) shows chromosome 15 with the location of the deleted segment highlighted. The panel (e) displays genes within this region, including TUBGCP5, CYFIP1, NIPA2, and NIPA1, which are associated with 15q11.2 deletion syndrome.The bottom panel (f) shows probe signal intensity across the region: values around 2 correspond to the normal two copies of DNA, while the drop to approximately 1 in the shaded region indicates loss of one copy (deletion) on chromosome 15. (Figure created using IGV snapshot of the CNV and Deciphergenomics.org browser displaying results for the deletion detected on chromosome 6q and 15q.)
Discussion
Laboratory errors are not uncommon, and every opportunity must be utilised to understand the precise reasons behind them. The two clinical cases highlight that even gold-standard tests can fail, underscoring the need to consider lab errors alongside the chase for novel variants when classic presentations do not align with results.
Many SCAs are caused by trinucleotide repeat expansions in specific genes, producing abnormal protein production, causing the neurological symptoms of ataxia. Fragment analysis using PCR and CE is a key method for diagnosing SCA and quantifying the repeat expansions.[2] The PCR amplifies the repeat region, and CE measures the DNA fragments in the target gene and compares them with known standards. Despite its advantages, limitations include morphologically/numerically abnormal peaks, low DNA concentration, maligned migration, contamination, ambient conditions, and peak analysis errors.
We corresponded with the respective labs regarding the reasons behind missing these conspicuous variants. In the first case, after extensive deliberation and retrospective scrutiny, the only plausible reason appeared to be a switch in the brand of DNA extraction kits, causing extremely small peaks on fragment analysis. As per the laboratory records, that particular batch of samples had been subjected to six rounds of fragment analysis and was consistently found to have no expansion and, therefore, reported as negative. A careful relook into the raw data files revealed the typical expansion associated peaks in one out of the six files, after several folds of magnification. Besides this obvious hitch, we also postulate that shorter alleles may have been preferentially amplified over the larger pathogenic alleles during the PCR reaction, resulting in the false negative result on multiple experiments.
NGS can detect repeat expansions using long and short reads. Long reads encompass the entire repeats, facilitating the most accurate repeat size determination. However, current costs and restricted access have limited their utility.[3] Short reads are more accessible yet face alignment and sizing challenges, requiring complicated bioinformatic tools for reliably counting the repeats.
Tools such as ExpansionHunter and Straglr enable repeat expansion analysis from ≥10× genome data. ExpansionHunter uses graph-based realignment, while Straglr detects insertions and then genotype repeats. Until long-read sequencing becomes widely available, affordable, and accurate, these platforms will reign as an alternative method.
In the second case, the CNVs, especially the one as large as 8.4Mb, should not have been missed on exome sequencing, since CNV screening is routinely included in the analysis. The concordance rate of CNV detection by orthogonal versus WES has been reported to vary between 85% and 96%, and the CNV detection size varies between 200 bases and several Mb.[4] Bias arising from the exome sequencing capture kit and GC content may lead to false positive results.[5] CNV calling from short read sequencing (WES) is challenged by variable coverage, alignment bias, read-length limits, and reduced sensitivity in repetitive or breakpoint-rich regions.[6] We hypothesised that a low copy repeat or high GC content in the region, with potential ambiguity in sequence alignment as the plausible cause in our case.
Clinical care of the patient in modern times is heavily dependent on diagnostics. Testing comes fourth in the sequence, after detailed history, clinical examination, and review of reports. This was beautifully encapsulated by Lundberg over 50 years ago, through the concept of the brain-to-brain loop. He affirms that the laboratory testing is a series of events that ideally begins and ends in the clinician’s brain.[7] In complicated or undiagnosed cases, the clinician may play an even more significant role anywhere along this loop by rechecking for common errors, recognising certain ‘testing anomalies’, and counselling the family members.
In some instances, when some laboratory errors are inevitable and are recognised, they must be duly brought to the patient’s notice, along with a discussion on the possible reasons behind them. This act instils trust and underscores the clinician’s sincerity in helping their cause.
Conclusion
Repeat expansions and copy number changes constitute a unique molecular mechanism, requiring a high index of clinical suspicion and an appropriate genetic test for detection. This is particularly relevant in current times, when sequencing studies are extensively ordered, and they are unreliable in interrogating them. Fragment analysis and Exome sequencing, although highly sensitive and specific, may fail in unforeseen circumstances. This might lead to a chain of unnecessary tests and distress. Therefore, we strongly urge you to look into the possibility of common errors before ordering expensive, broader tests. Rechecking the previous data in clinical cases with classic presentations and strong family history may be cumbersome, but it is a valuable exercise before proceeding with the chase for rarer and novel genetic disorders.
Footnotes
Acknowledgements
We thank the patients & their families for their complete cooperation. We thank Neuberg Centre for Genomics Medicine and Revvity for performing the Whole Genome Sequencing and analysis for the two patient families.
Declaration of conflicting interests
The authors declared no potential conflicts of interest with respect to the research, authorship and/or publication of this article.
Funding
The authors received no financial support for the research, authorship and/or publication of this article.
Institutional ethical committee approval number
Not applicable.
Informed consent
Written informed consent was taken.
Credit author statement
Surya Balakrishnan: Conceptualisation; Data curation; Formal analysis; Investigation; Methodology; Project administration; Supervision; Validation; Visualisation; Writing – original draft; Writing – review and editing.
Ambika Gupta: Conceptualisation; Data curation; Formal analysis; Investigation; Methodology; Project administration; Supervision; Validation; Visualisation; Writing – original draft; Writing – review and editing.
Khyati Arora: Data curation; Investigation; Methodology; Project administration; Validation; Visualisation; Writing – original draft; Writing – review and editing.
Reena Trivedi: Data curation; Investigation; Methodology; Project administration; Validation; Visualisation; Writing – original draft; Writing – review and editing.
Data availability
Not applicable.
Use of artificial intelligence
None.