
Abstract
Urban ventilation corridors (UVCs) are essential in urban planning as they enhance air movement and help disperse heat, thereby improving air quality and contributing to a more liveable urban environment. Despite their importance, the impact of UVCs on land surface temperature (LST) within local climate zones has been under-explored. This research seeks to fill this gap by investigating the relationship between UVCs and LST, particularly in the context of temporal changes in the built environment. To achieve this, this study employed a multidisciplinary approach, combining spatial data—such as building footprint and height—meteorological information and satellite imagery. These data were used to identify UVCs, delineate local climate zones and assess LST levels in the case of Colombo, Sri Lanka. By employing cost-distance–based least-cost path calculations, the study effectively mapped potential UVCs. The findings revealed that the shift from open mid- and high-rise buildings to more compact structures significantly hinders natural airflow into urban cores. Furthermore, areas within UVCs were found to have lower temperatures compared to surrounding regions. The study also highlights the importance of maintaining compensatory spaces, such as water bodies and green spaces, and regulating building façades to enhance air circulation. Urban planners and designers should prioritize land-use management policies and strategies to improve urban liveability.
Keywords
Introduction
The continuous rise in land surface temperature (LST) within urban areas presents significant challenges to environmental sustainability and human well-being (Chang et al., 2018; Fang & Zhao, 2022; Liu et al., 2022; Wang et al., 2022). Urbanization, characterized by the expansion of low albedo surfaces such as concrete and asphalt, coupled with reduced vegetation, contributes to the intensification of the urban heat island (UHI) effect (Hsieh & Huang, 2016). This phenomenon results in urban areas experiencing higher temperatures compared to surrounding rural regions, leading to increased energy demands, elevated greenhouse gas emissions and heightened public health risks, particularly during extreme heat events (Kim & Brown, 2021).
As cities grow denser and taller, the natural airflow that once mitigated these heat effects becomes increasingly obstructed. This disruption exacerbates the UHI effect, making it more difficult for urban areas to cool naturally (Chang et al., 2018; Wong et al., 2010). Rising LSTs not only strain energy resources due to higher demands for air conditioning but also pose severe health risks, especially to vulnerable populations during heatwaves (Xie et al., 2020). Addressing these challenges is critical for creating more liveable and resilient urban environments (Gu et al., 2020; Massaro et al., 2023). For instance, several major cities around the world, including Las Vegas and Los Angeles in the United States (Shiflett et al., 2017), Beijing and Shanghai in China (Chang et al., 2018; Fang & Zhao, 2022; Zheng et al., 2022), Delhi and Mumbai in India (Rahaman et al., 2021) and São Paulo and Rio de Janeiro in South America (Lucena et al., 2013), are already experiencing the adverse effects of rising LST. The situation worsens when air circulation within cities is constrained by compact urban developments, such as tall buildings, narrow streets and other obstructions to airflow. Therefore, adopting appropriate strategies to mitigate LST increases is essential for achieving a favourable urban climate (Liu et al., 2022). Potential strategies include the deployment of cool roofs, urban green initiatives, and the creation of urban ventilation corridors (UVCs) (Gu et al., 2020; Wang et al., 2022).
Urban planning strategies have traditionally focused on mitigating LST through green infrastructure, such as the implementation of cool roofs, urban forests and green spaces (Degirmenci et al., 2021). However, the role of UVCs—strategically planned open spaces that facilitate air movement and heat dispersion—has been relatively under-explored in urban heat mitigation efforts. UVCs offer a promising approach by enabling cooler air to flow into dense urban cores, thereby reducing ambient temperatures and improving air quality.
This study aims to bridge this knowledge gap by investigating the impact of UVCs on LST within local climate zones (LCZs) and examining how temporal changes in the built environment affect these corridors. By employing a multidisciplinary approach that combines spatial data, meteorological information and satellite imagery, this research provides a comprehensive analysis of how UVCs can be effectively integrated into urban planning to enhance thermal comfort and mitigate the adverse effects of urbanization.
Background
LST and UHI Effect
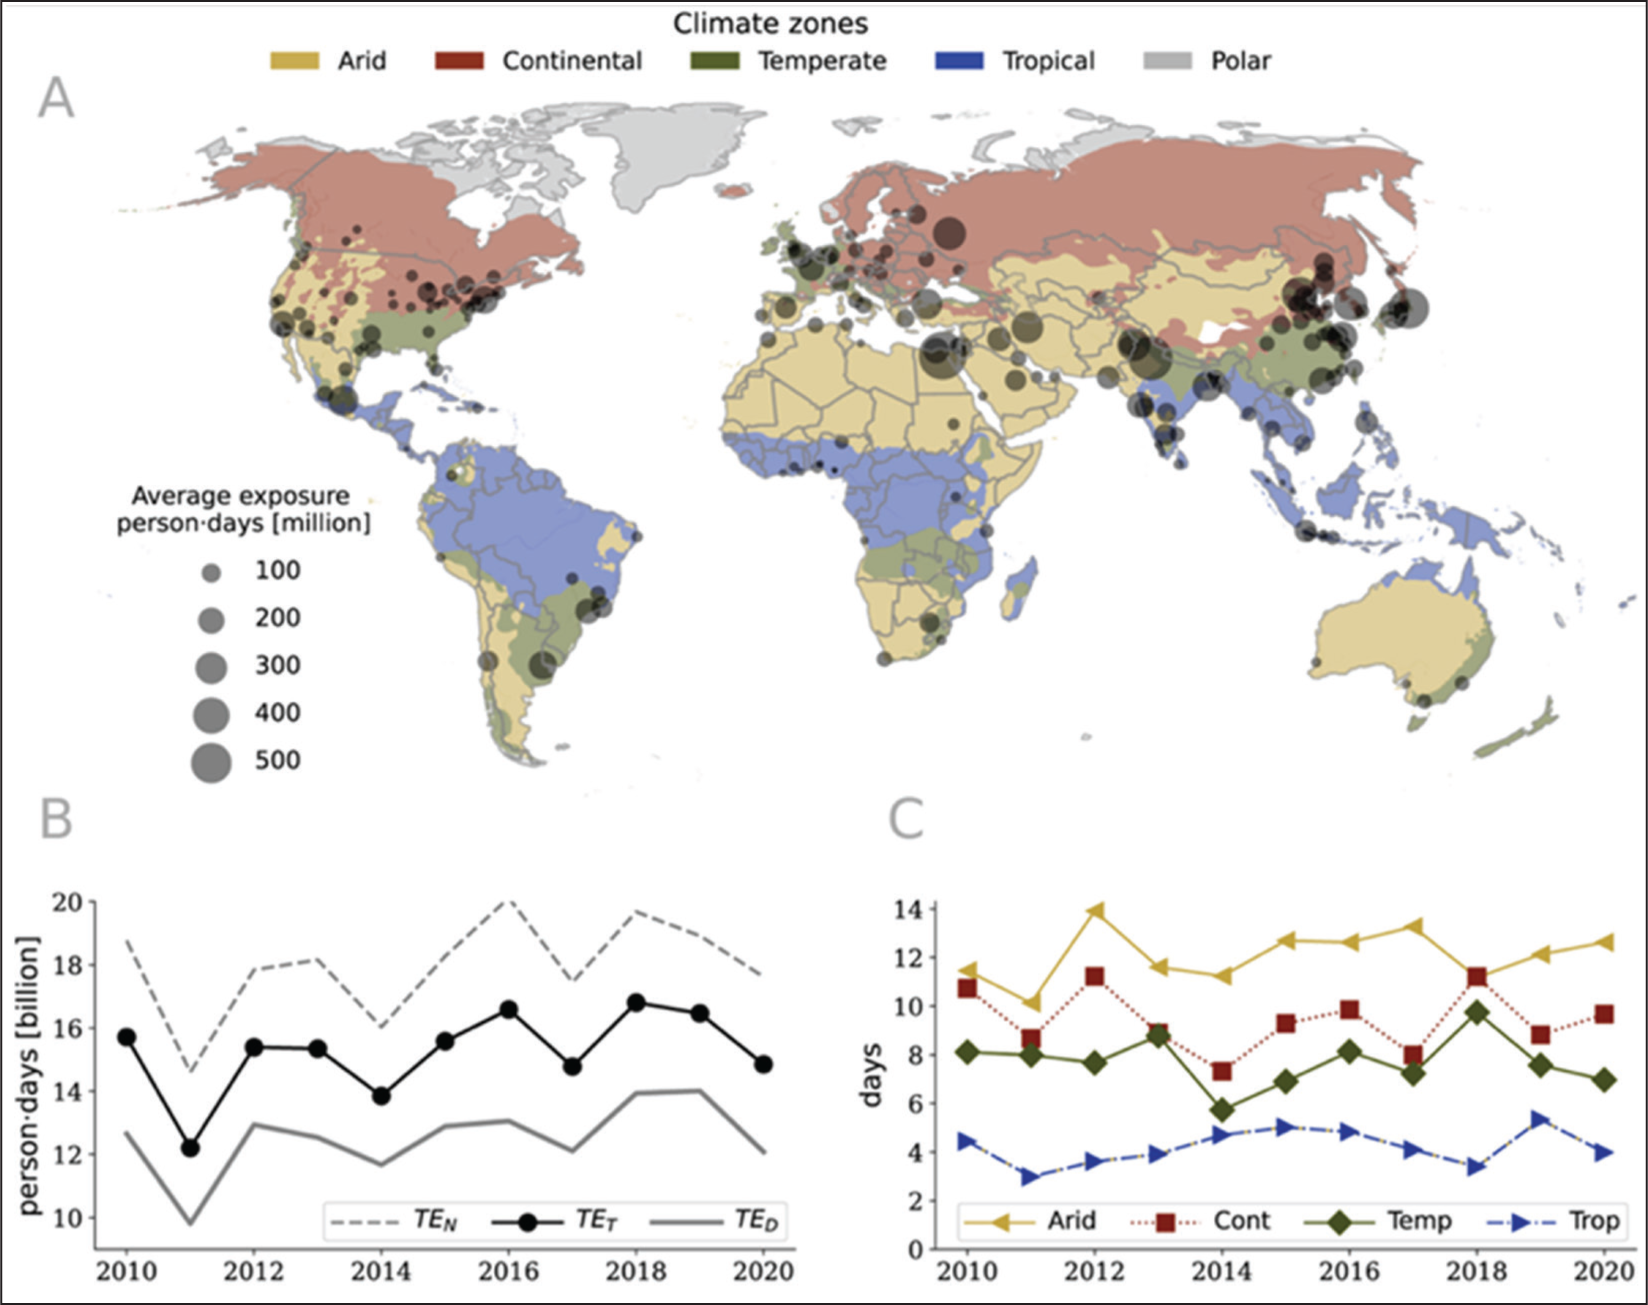
By 2050, 68% of the world’s population is projected to live in cities. Over recent decades, the rise in LST and the frequency of heatwaves have increased significantly due to climate change. The gradual increase in LST within urban areas fosters the development of UHIs. UHIs arise from anthropogenic activities and the specific layout of the built environment (Li et al., 2022). As a result, as shown in Figure 1, people in urban areas are increasingly exposed to elevated LST levels (Sobstyl, 2018; United Nations, 2018).
The severity and characteristics of high LST levels can vary widely depending on factors such as local climate, urban design, population density and geographical location. This rise in LST tends to have a more detrimental impact on people living in city centres compared to less urbanized areas. Individuals with low tolerance to extreme temperature patterns are particularly vulnerable to heat stress, which can lead to adverse health effects (Shahmohamadi, 2010; Voogt, 2004).
This, therefore, highlights the crucial role of location and surrounding land use in relation to the LST phenomenon in a given area. Therefore, LST and the resulting UHI effect can be mitigated through targeted urban planning and design interventions at the local scale (Grimm et al., 2008; Gu et al., 2020; Li et al., 2022; Ng, 2009).
Countries like Singapore, Australia, Japan, Germany and China (Fang & Zhao, 2022) have adopted various measures to mitigate the negative impacts of rising LST levels in urban areas. Singapore’s Cooling Singapore initiative includes green building standards, extensive tree planting, green roofs and vertical gardens (Xu, 2022). Melbourne’s Urban Forest Strategy aims to increase tree canopy cover and enhance shade across the city (Hartigan et al., 2021). Japanese cities incorporate extensive green spaces, parks and green roofs, with Tokyo’s Green Tokyo initiative focusing on increasing urban greenery to enhance the cooling effect of vegetation (Ismail, 2012; Nagase & Koyama, 2020). German cities have implemented cool roofing standards and urban planning strategies that prioritize green spaces and pedestrian-friendly environments (Grunewald & Syrbe, 2018). China’s Sponge City initiative seeks to reduce urban heat and manage stormwater through green infrastructure (Fang & Zhao, 2022; Li et al., 2022; Ren et al., 2018).
Urban Ventilation Corridors
Given that rising LST levels are primarily driven by anthropogenic activities in urban environments, enhancing ventilation and maintaining comfortable air temperatures and circulation is crucial. Incorporating UVCs into urban planning is increasingly recognized as a strategy for mitigating LST (Gu et al., 2020; Ren et al., 2018; Wong et al., 2010). The creation of UVCs represents a promising urban policy-level strategy, though it has yet to be widely adopted globally (Kamruzzaman et al., 2018; Liu et al., 2022). UVCs are deliberately planned or designated areas within a city designed to facilitate the movement of air (Gu et al., 2020; Shuzhen, 1994; Wong et al., 2010). These corridors typically include urban design elements such as wider streets, open spaces, parks, greenbelts, and other features that promote airflow and help reduce LST (Liu et al., 2021; Massaro et al., 2023). UVCs allow cooler air from surrounding areas to circulate into heat-affected zones, lowering temperatures (Hsieh & Huang, 2016; Wong et al., 2010). Countries like Germany, China and Japan have integrated UVCs into their urban planning strategies (Baumuller et al., 1998; Bing et al., 2021; Fang & Zhao, 2022; Perera et al., 2016). Densely populated Hong Kong uses UVCs to reduce the occurrence of heat islands (Jiang et al., 2016; Kwok et al., 2022).
Research on urban air circulation has identified three key elements essential for establishing UVCs: (a) action space, (b) compensatory space and (c) air passage. Each of these spaces has unique characteristics that contribute to the formation of UVCs (Ren et al., 2018; Shi et al., 2022).
Action space refers to functional areas within built-up zones where significant anthropogenic activities occur. Compensatory space encompasses areas where air exchanges with adjacent spaces, including water bodies and green spaces, fostering regional air circulation. Air passage is the pathway that connects action space and compensatory space. However, obstructions in the action space often hinder airflow, posing a major challenge in clearly defining ventilation corridors in cities (Shi et al., 2022). Consequently, research has shown that building density is a fundamental factor limiting the extent of a UVC (Kangana et al., 2024; Liu et al., 2022).
LCZ Analysis
LCZ analysis is an effective approach for understanding how land-use changes impact thermal conditions and variations in urban environments (Shi et al., 2022). LCZ classification schemes offer a reliable way to characterize the influence of urban land use on increasing LST and related phenomena such as UHIs.
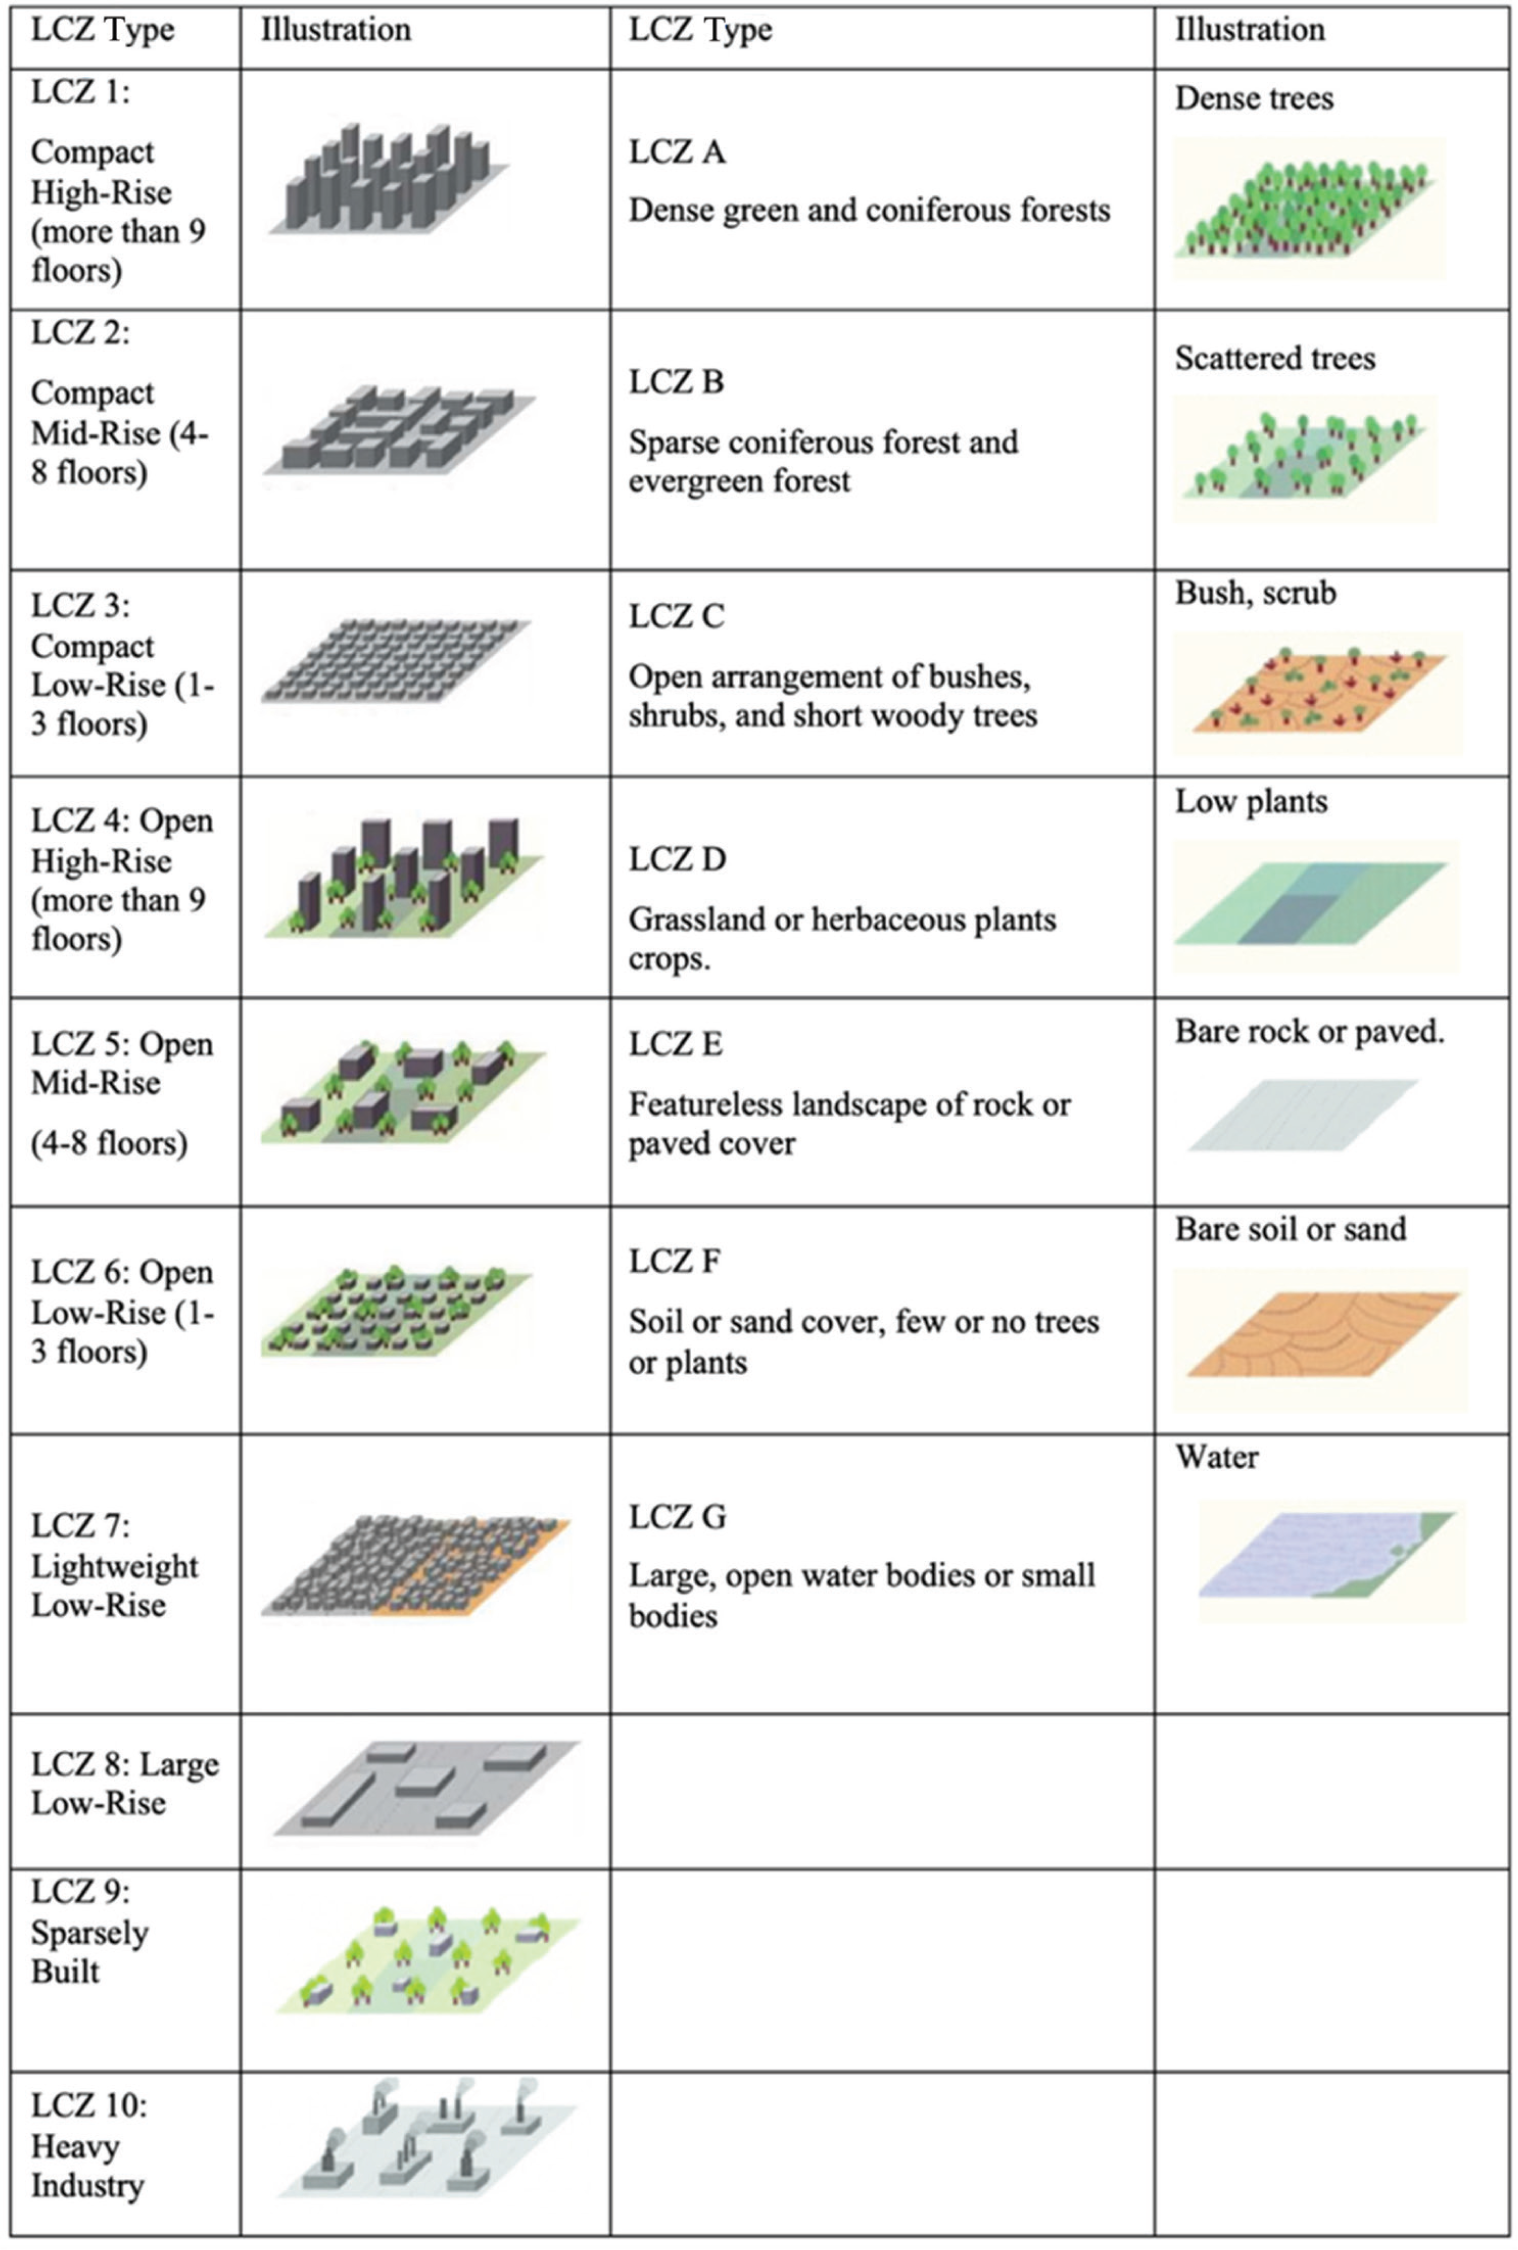
The LCZ system categorizes and describes various urban and suburban areas based on factors such as building density, vegetation cover and land-use patterns. Unlike traditional land-use analysis, LCZs provide a more nuanced understanding of local climatic conditions within urban settings (Shi et al., 2022). For microclimate analysis, urban land use is typically examined under the following ten LCZ categories: (a) compact high-rise, (b) compact mid-rise, (c) compact low-rise, (d) open high-rise, (e) open mid-rise, (f) open low-rise, (g) lightweight low-rise, (h) large low-rise, (i) sparsely built and (j) heavy industry (Stewart & Oke, 2012).
Compact high-rise areas are characterized by tall buildings with high population density, often resulting in heat retention and reduced ventilation. Compact mid-rise areas feature moderate building heights, mixed land use, and some vegetation, influencing local temperature and wind patterns. Compact low-rise areas, with low-rise buildings and more green spaces, create a distinct local climate compared to denser zones. Conversely, open high-rise areas have tall buildings but more open spaces and vegetation, allowing for better ventilation and potentially cooler microclimates. Open mid-rise areas, with medium-height buildings and significant vegetation, contribute to a cooler and more comfortable local climate. Open low-rise areas, characterized by low buildings and extensive greenery, promote cooler temperatures and improved air quality. Lightweight low-rise areas, with low-density construction and minimal building materials, affect local temperature and wind patterns differently. Large low-rise areas consist of sparsely populated areas with low-rise buildings, substantial vegetation and open spaces, resulting in unique local climate conditions. Sparsely built areas feature small or medium-sized buildings in natural settings with scattered trees and plants, while heavy industry areas consist of low- and mid-rise industrial structures with minimal tree coverage.
This LCZ-based categorization is particularly useful for identifying ventilation corridors at local and regional scales (Stewart & Oke, 2012). The LCZ classification system supports informed urban design decisions, guiding cities in infrastructure development and climate mitigation strategies. By understanding the specific LCZ of an area, planners can better predict and address issues related to LST levels, air quality, energy consumption and overall urban liveability.
Knowledge Gap
To mitigate the adverse effects of rising LST, it is essential first to identify potential UVCs within an urban environment, then to incorporate these corridors into urban planning, and finally to maintain them to ensure effective air circulation within cities. Novel methods for identifying UVCs include: (a) using backward trajectory simulations (Xu et al., 2021); (b) leveraging high-resolution LiDAR data (Peng et al., 2017) and (c) employing high-precision oblique photographic images (Chen et al., 2021). Nevertheless, it is crucial to identify cost-effective methods for pinpointing potential UVCs to optimize their effectiveness in mitigating the rise in LST.
Adopting green strategies has been the most common urban planning approach to combat rising LST (Massaro et al., 2023). In contrast, the use of UVCs is a relatively novel and under-explored method. Cities like Tokyo have been exploring the incorporation of UVCs into their urban planning to mitigate UHIs (Nagase & Koyama, 2020). These corridors are envisioned as pathways that allow cool air to flow through the city, thereby reducing heat build-up.
Previous studies have given limited attention to the impact of spatio-temporal changes along UVCs as urbanization progresses (Wicht et al., 2017). Understanding these changes is crucial for decision-making regarding the maintenance of UVCs or their re-routing through heat islands. This study, therefore, focuses on understanding the impact of rising LST levels across different land uses and building compositions in a congested urban environment within a developing country—that is, Colombo, Sri Lanka.
Research Design
Case Study
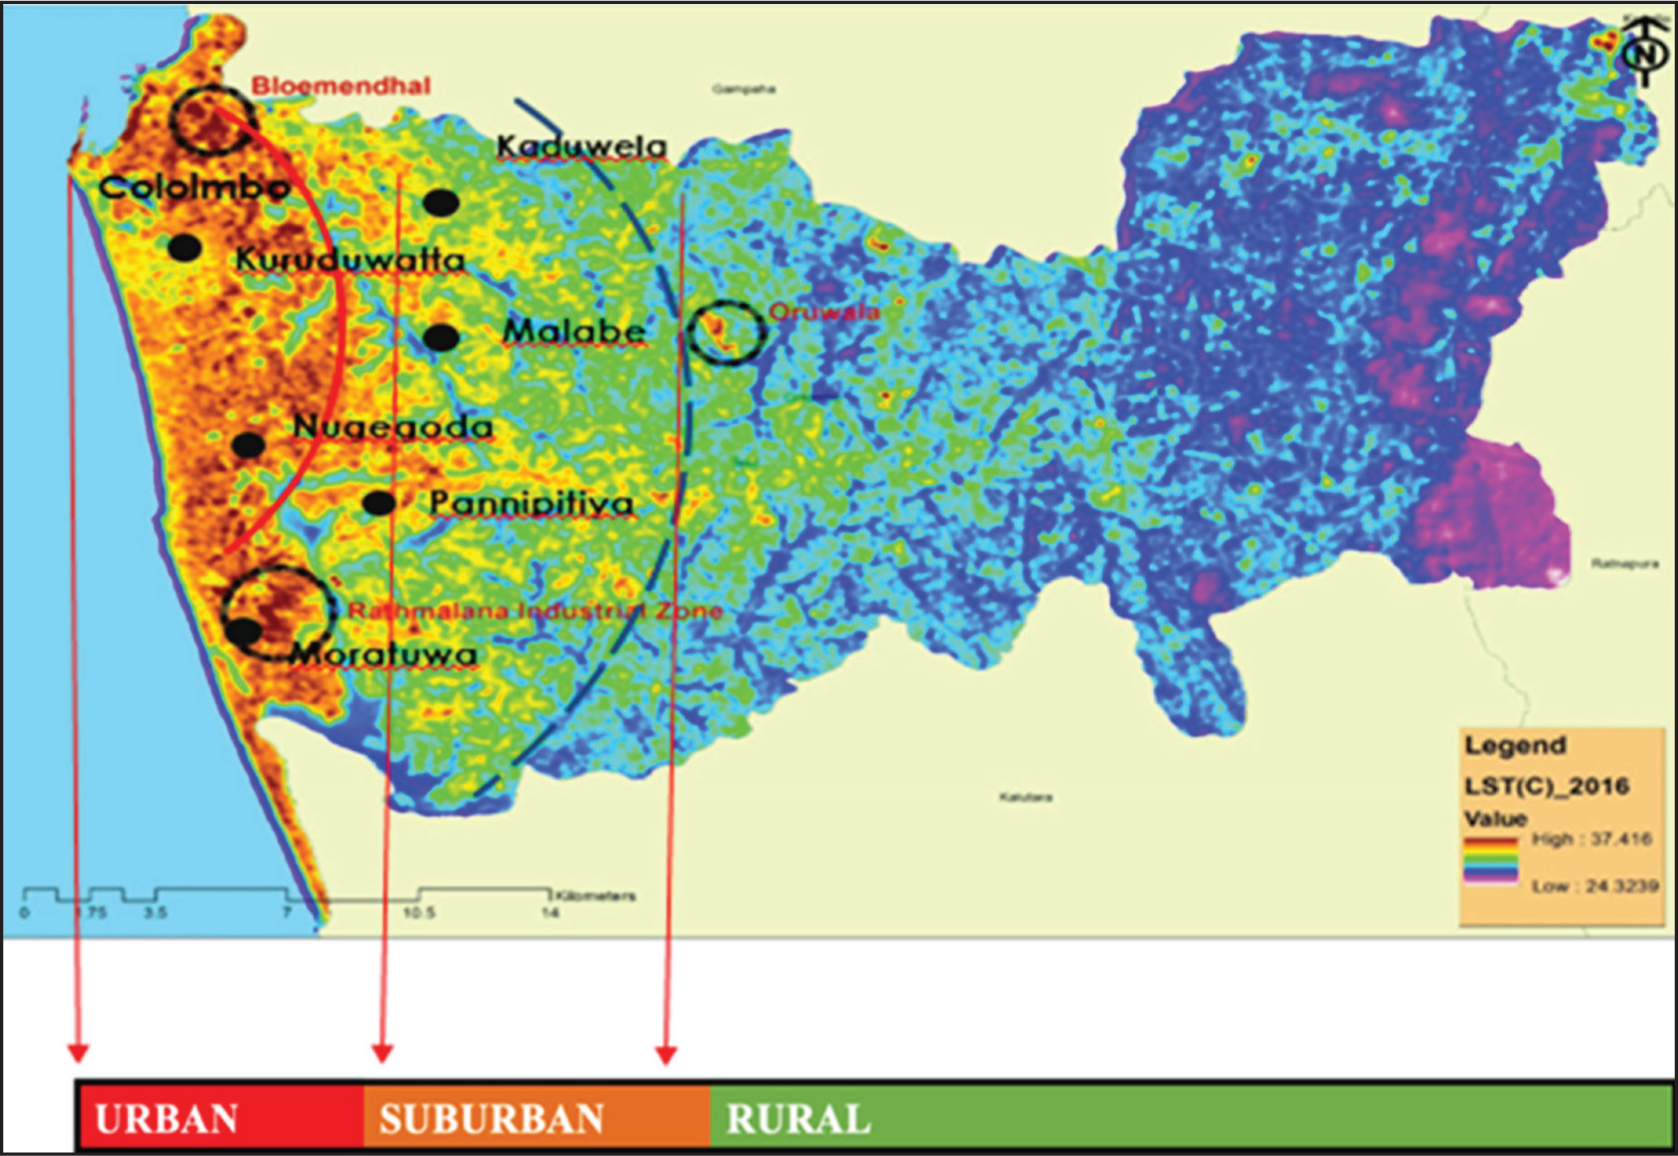
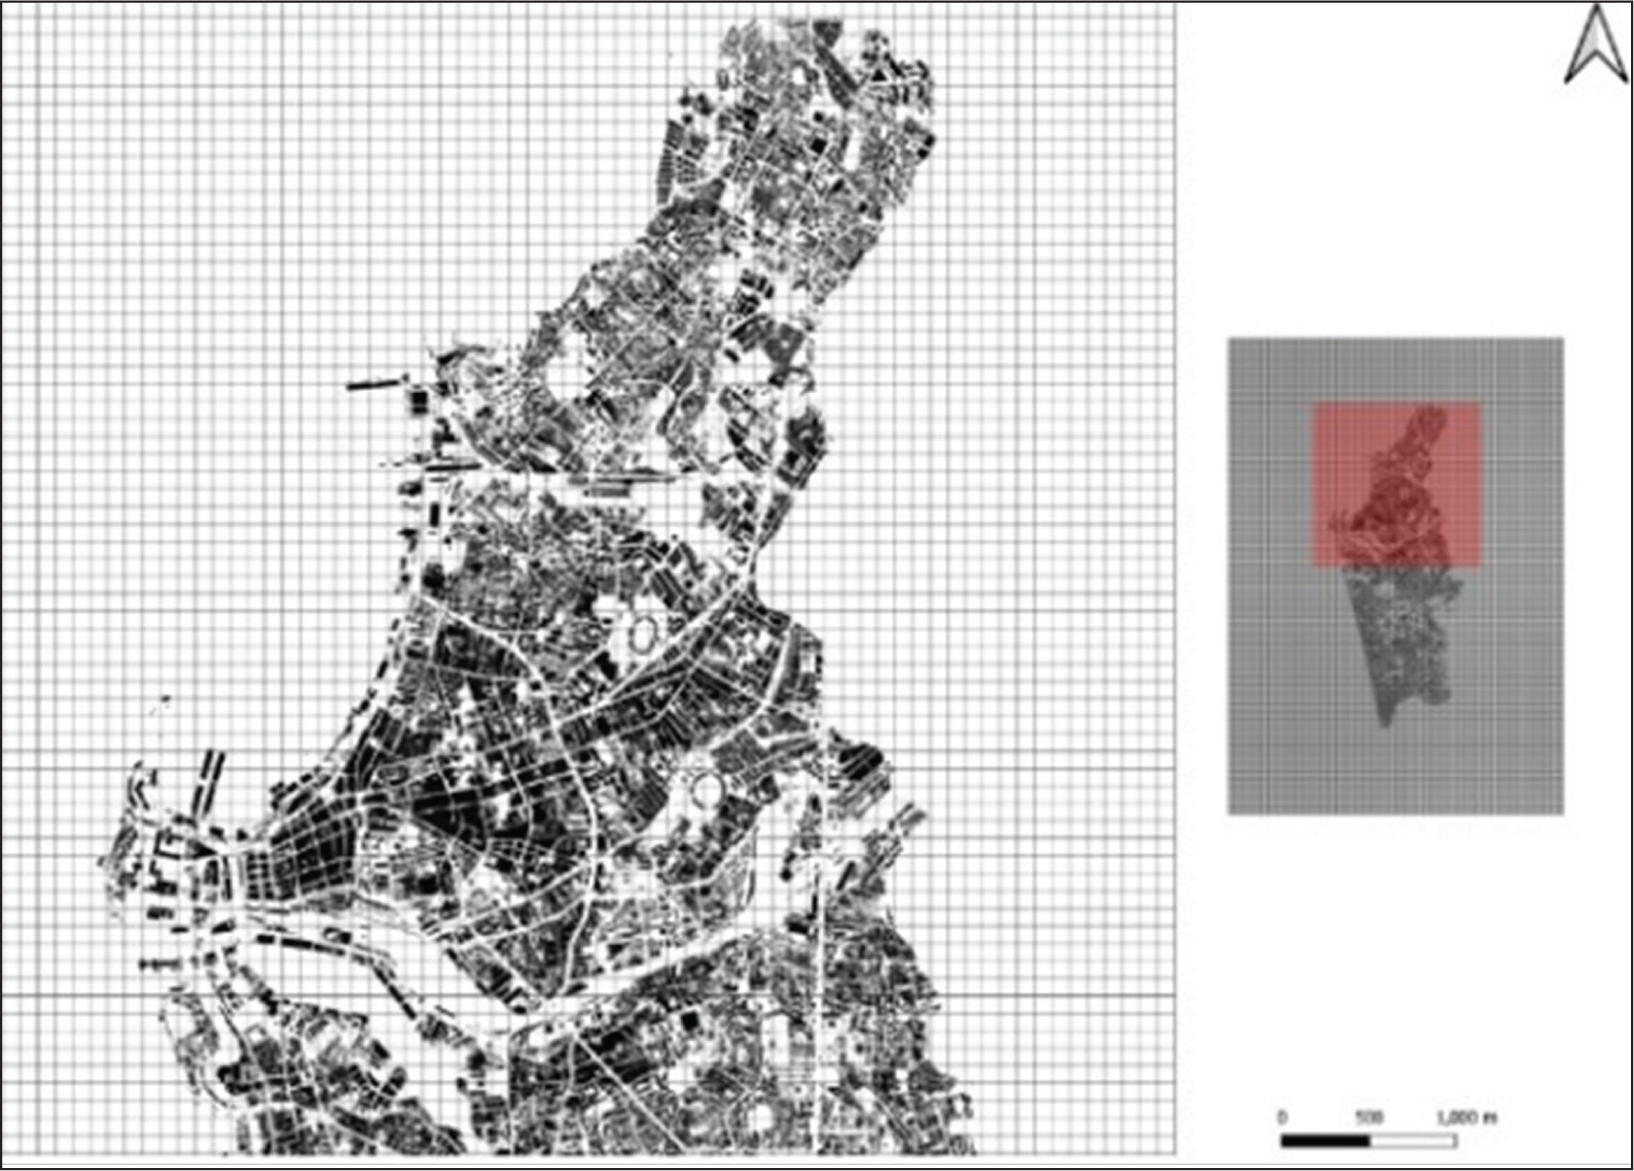
Colombo, the capital and commercial hub of Sri Lanka, is a coastal city located at the geographic coordinates of 6° 54’ N, 79° 52’ E, along the west coast. As depicted in Figure 2, Colombo experiences a hot climate, with microclimate characteristics influenced by elevated LST levels. Due to its proximity to the equator, Colombo has a tropical climate with consistently high temperatures and humidity throughout the year. The city features high building density and significant daily vehicular movement. The maximum thermal gradient between urban and rural areas in Colombo, both at night and during the day, highlights the diversity and concentration of commercial, industrial, residential and recreational activities in this region (Akalanka et al., 2024; Priyashani et al., 2023). The LST map in Figure 2 shows the temperature variation across the entire western province, and the Colombo Municipal Council (CMC) area (Figure 3) is identified as a UHI. Consequently, the CMC area was selected as the case study for this research investigation.
Land Surface Temperatures of Western Province.
Location of Colombo Municipal Council Area.
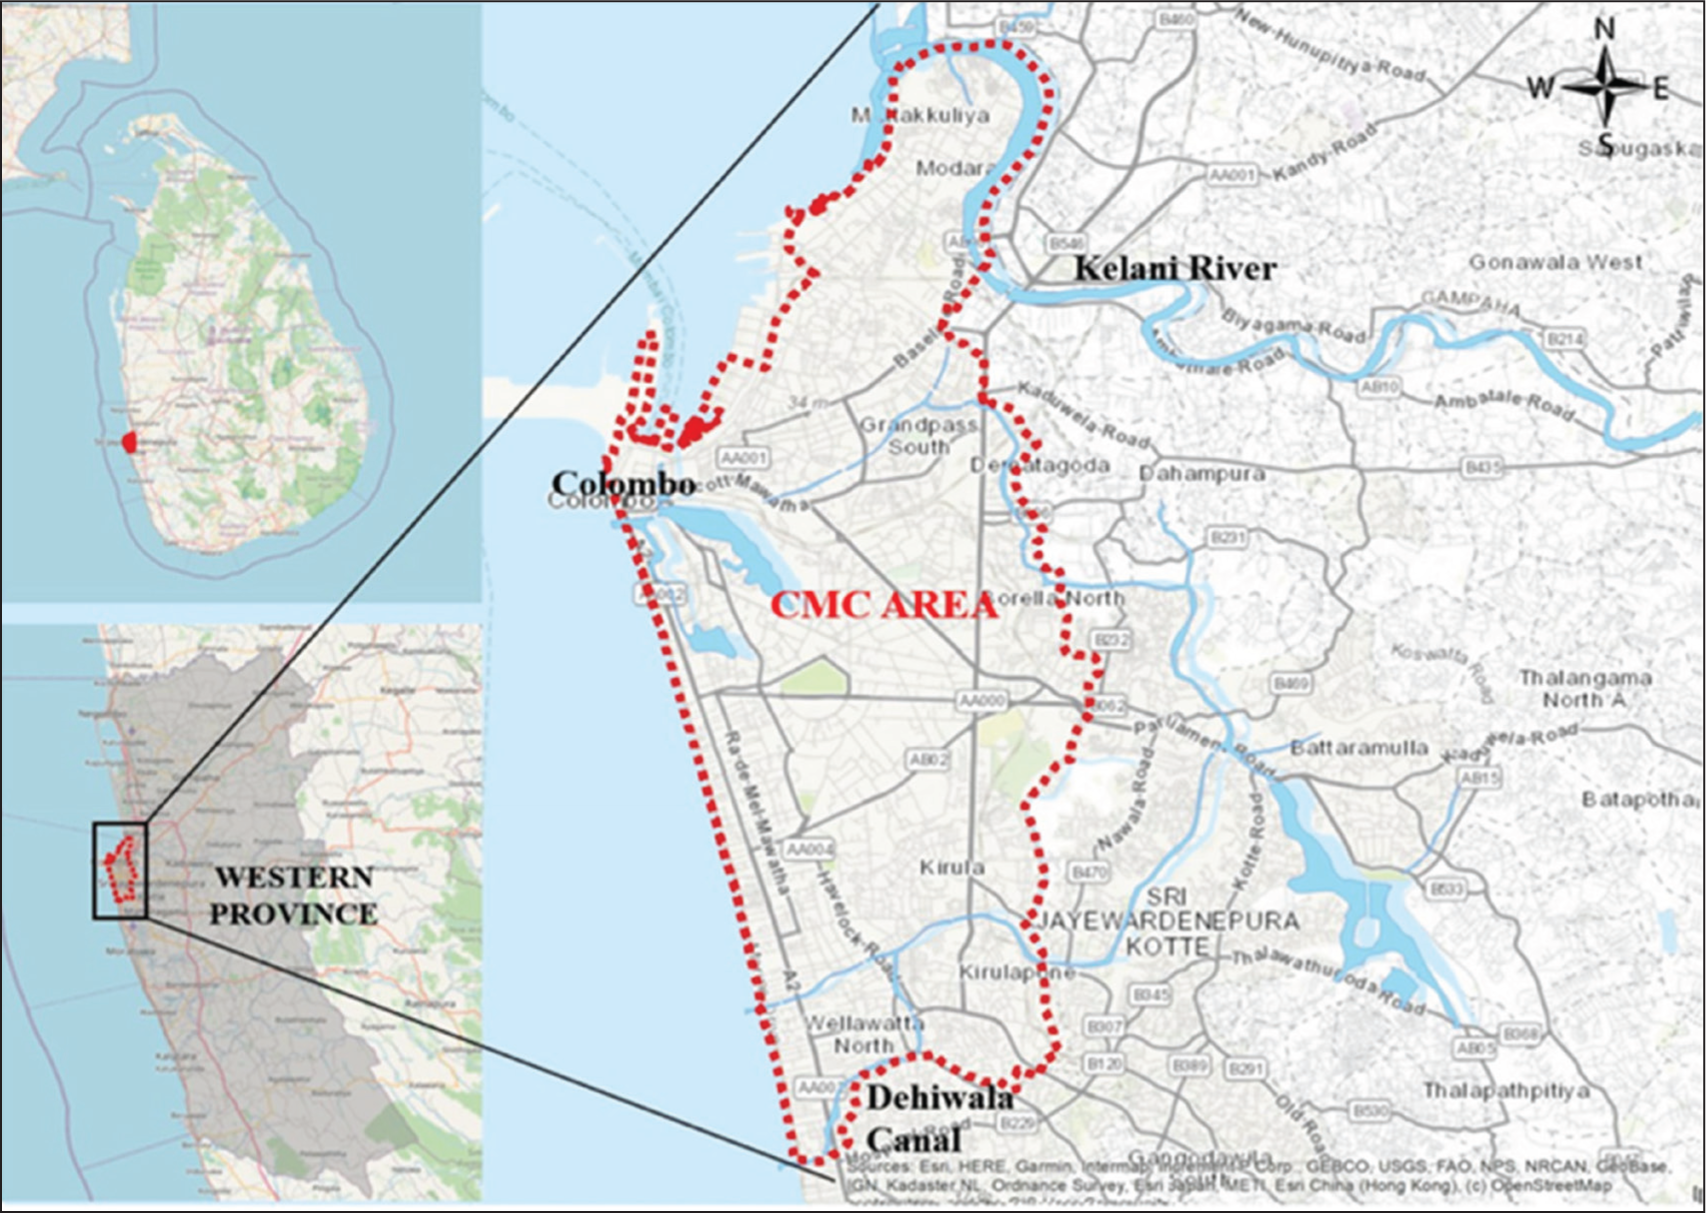
The northern boundary of the CMC area is defined by the Kelani River, while the southern boundary is marked by the Dehiwala Canal. This area encompasses 55 Grama Niladhari Divisions (GNDs), which are the smallest administrative units in Sri Lanka. The selected study area has a high likelihood of functioning as a warm micro-zone, being surrounded by water.
Data
The study utilized four types of data: (a) building data; (b) thermal bands from Landsat 8 satellite images (Bands 10 and 11) for the CMC area; (c) land-use data and (d) wind direction data. All data were collected for the years 2010 and 2017. Building and land-use data were sourced from the Survey Department of Sri Lanka. Height and building use were the primary attributes extracted from the building data. The most recent and credible building layer with height parameters issued by a government authority was available only in 2017.
However, due to the COVID-19 pandemic lockdown and the country’s recent economic crisis (2019–2024), Sri Lanka experienced minimal changes to its skyline. Between 2017 and 2025, only a few new seafront hotels were added to the Colombo skyline, including One Galle Face (2019; ~194 m), Colombo City Centre (2020; ~183 m), Capital Twin Peaks (2020; ~182 m), Altair (2021; ~240 m), Lotus Tower (2022; ~351 m), Sheraton Colombo (2023), ITC Ratnadipa (2024; ~225 m), Cinnamon Life City of Dreams (2024; ~153 m) and Amari Colombo (2024; ~100 m). All these are taller buildings with significant frontal area indices. Also, the said development has facilitated the tourism industry of the country and has significantly contributed to enhance the image of the Colombo city (Abesinghe et al., 2023).
Although the current study does not include these developments in its analysis, the discussion section will address how these new constructions might impact the ventilation corridors identified in 2017. Along with the building data, land-use data were used in LCZ classifications. The thermal band of the Landsat 8 satellite image was used to identify the LST levels for the case study area. Wind direction data were obtained from the Meteorological Department of Sri Lanka.
Methodological Framework
Figure 4 illustrates the methodological framework employed in this study. As the first step, LST levels were calculated. Next, the frontal area index (FAI) was determined by considering the building façade areas facing the ocean (Xu & Gao, 2022). FAI is a key parameter for assessing the total building façade area facing the wind direction (Xie & Liu, 2010). It was used to estimate the extent of building walls exposed to a particular wind direction or compensation space. FAI typically represents wind resistance in urban spaces and serves as a parameter for morphological analysis to identify ventilation corridors (Liu et al., 2022). The height of buildings each year was a major factor in computing the FAI in this study. As the wind moves over the rougher lower terrain, it encounters resistance from buildings. The windward building area within each raster grid cell was calculated, as depicted in Figures 5 and 6.
Methodological Framework.
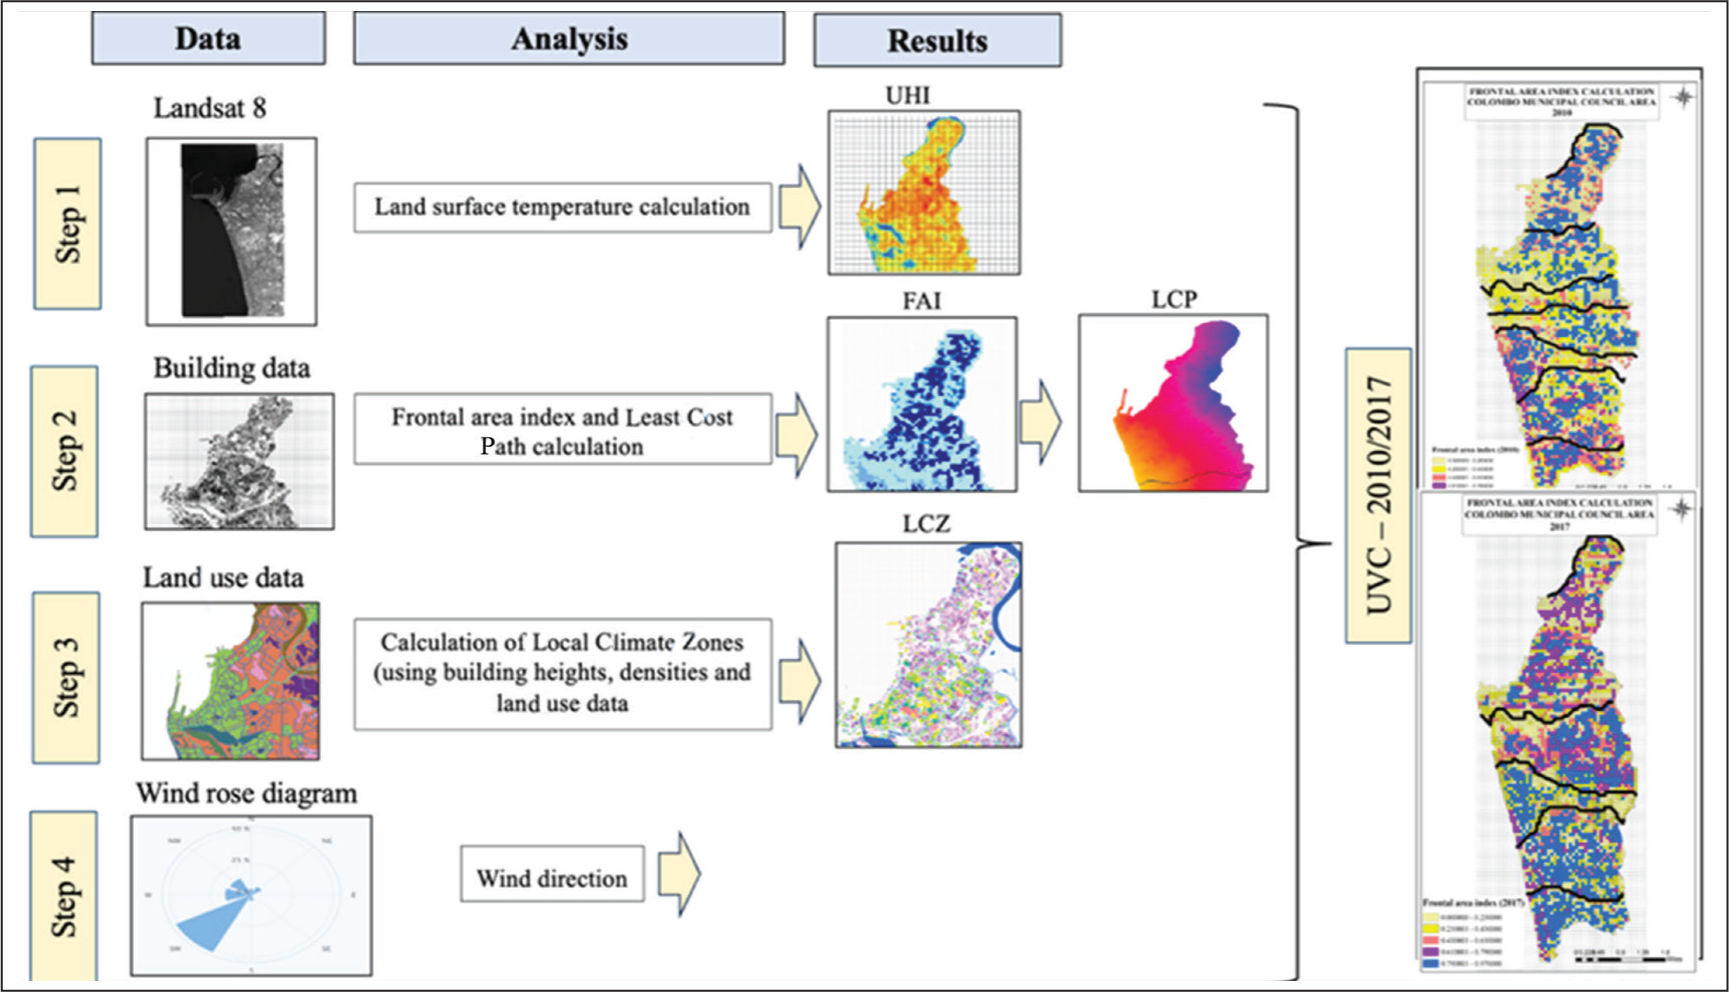
Illustration of Frontal Area Calculation.
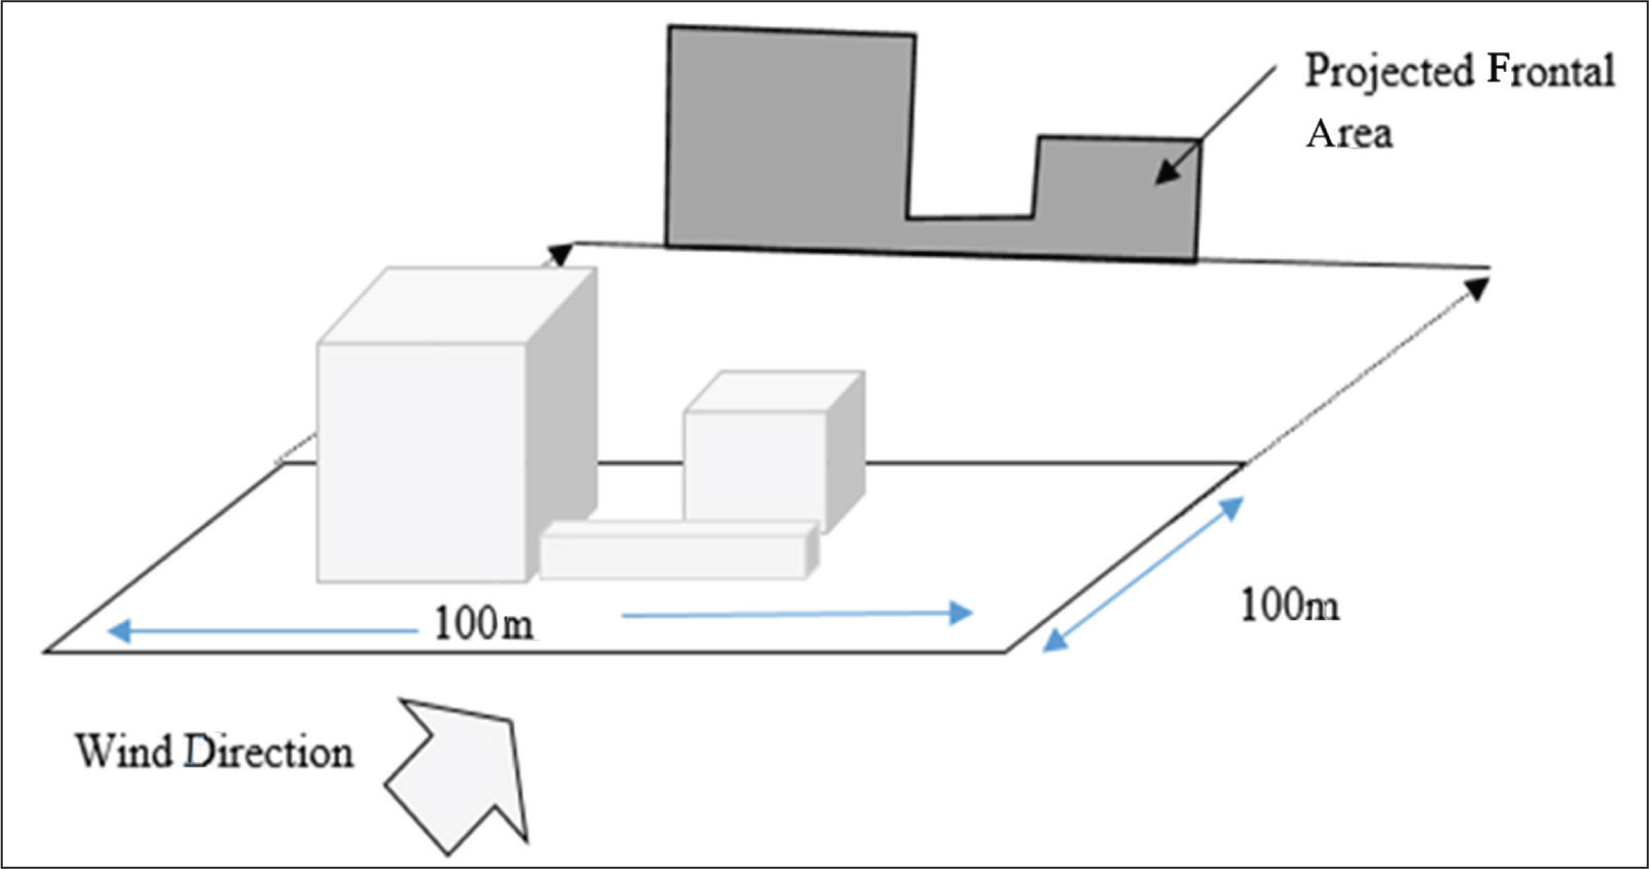
Grid Map Sample 100 m × 100 m.
Next, as shown in Figure 6, a grid size of 100 m × 100 m was used to calculate the surface roughness of the study area, considering a scenario where the wind blows from the ocean towards the built-up area. The number of floors in coastal structures was summed up to create wind-resistant zones, which were then divided by the unit grid size (10,000 m²).
Third, LCZs were identified by considering building heights, densities and land-use data. Finally, taking into account both FAI and LCZs, least-cost paths (LCPs) were identified, which were considered as UVCs (Fang et al., 2023). The LCP analysis allows for a dynamic assessment of the urban canopy’s ventilation corridors in response to wind direction (Yang & Li, 2015). The LCP-based approach is founded on the assumption that airflow generally follows the path of least resistance created by building façades (Yuan et al., 2014). The LCPs were determined using the cost distance (CD) model, where ‘cost’ refers to the FAI values assigned to each 100 m × 100 m grid area. The underlying principle of the CD model is that the cost value increases as you move further away from a starting point. In this case study, evenly spaced starting points were selected from the Indian Ocean, which serves as the primary compensatory space. ArcGIS software was utilized to determine the LCPs, with windward and leeward directions established based on information from the Department of Meteorology.
LST Calculation
The three equations provided below were applied to the thermal band of the Landsat 8 satellite image to determine the LST distribution (Avdan & Jovanovska, 2016):

where Lλ refers to spectrum radiance, LMIN is spectral radiance relating to the least numeric value, LMAX is spectral radiance corresponding to the highest digital number and digital number(DN) is the numeric value.

where for the spectral bands of the TM data, K1 is the standardization constant 1 (607.76), K2 is the Standardization constant 2 (1,260.56) and TB is the surface temperature.

where this final equation converts the surface temperature from Kelvin to Celsius.
LCZ Identification
The spatial and temporal changes along the identified UVCs were analysed using LCZ classifications. Accordingly, the land use in the case study area was divided into two broad categories based on land use and building use. As shown in Figure 8, these categories were: (a) building zone classification (eight classes) and (b) nature zone classification (seven classes) (Stewart & Oke, 2012; Zhao et al., 2020).
Attributes Used for LCZ Classification (Stewart & Oke, 2012).
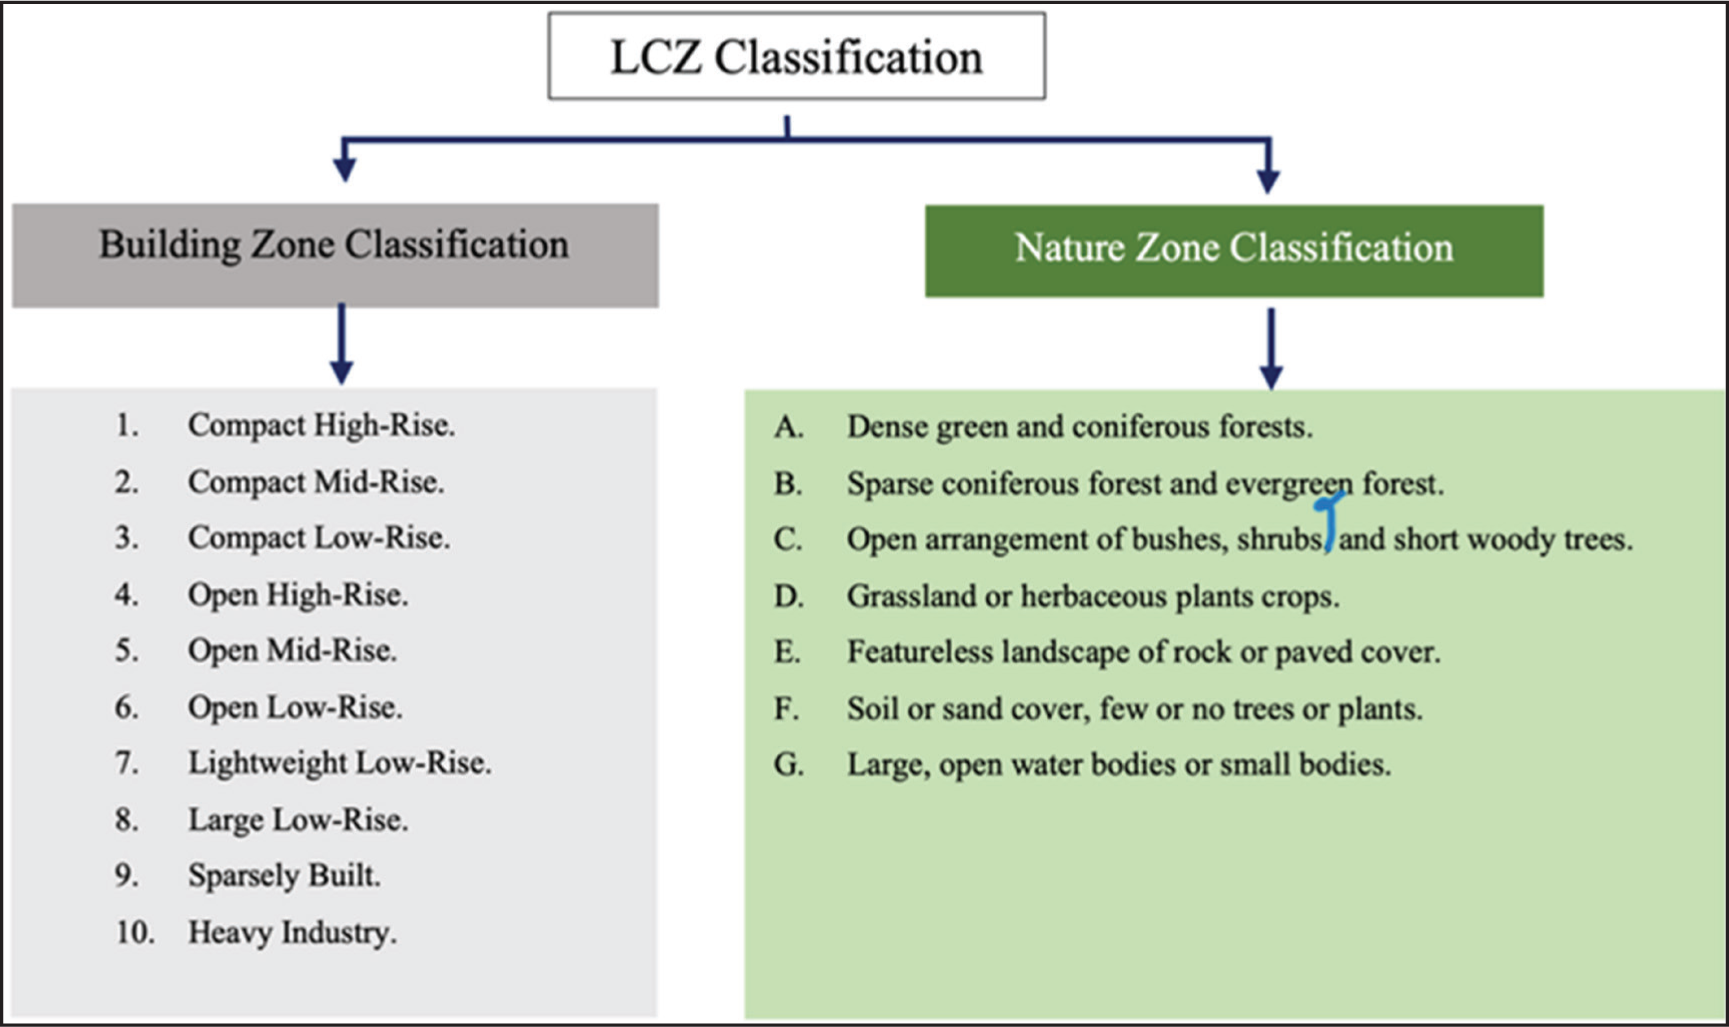
Building height and density were the two primary attributes considered in the building zone classification. The normalized difference vegetation index (NDVI) and the normalized difference water index (NDWI), along with land-use data, were employed for nature zone classifications. A graphical illustration of the detailed LCZ classification scheme is presented in Figures 7 and 8.
LCZ Classification (Stewart & Oke, 2012).
As Colombo is the commercial capital of Sri Lanka, some of the LCZ classifications cannot be seen in the case study area. Therefore, after thoroughly studying the definitions given by Stewart and Oke (2012), it was identified that the study area comprises only LCZ 1–8 classifications. Among the nature zone classifications, only the characteristics related to LCZ A, B, C, D, F and G were observed. Consequently, the study was conducted solely for the LCZs present in the case study area.
Wind Pattern Identification
According to the Department of Meteorology, Sri Lanka, winds predominantly blow from the southwest (SW) to the northeast (NE), with the sea serving as the main source of wind (compensation space). The average nighttime wind speed is 19 km/h and it strongly depends on the season and local weather conditions. Conversely, the coastline influences the predominant wind direction during the day, though the wind is still less likely to blow landward even during daytime hours (Department of Meteorology, 2023).
Analysis and Results
Urban Ventilation Corridors
Figure 9 presents the UVCs identified through the FAI and LCP calculations for the years 2010 and 2017. The calculated FAI ranged from 0 to 0.97. Areas with a lower FAI (FAI < 0.5) indicated a lower level of wind blockage, while a moderate FAI value (FAI = 0.5) suggested that approximately half of the wind was blocked. A high FAI value (FAI > 0.9) indicated that more than half of the wind flow was obstructed by buildings.
FAI and UVCs Calculated (Years 2010 and 2017).
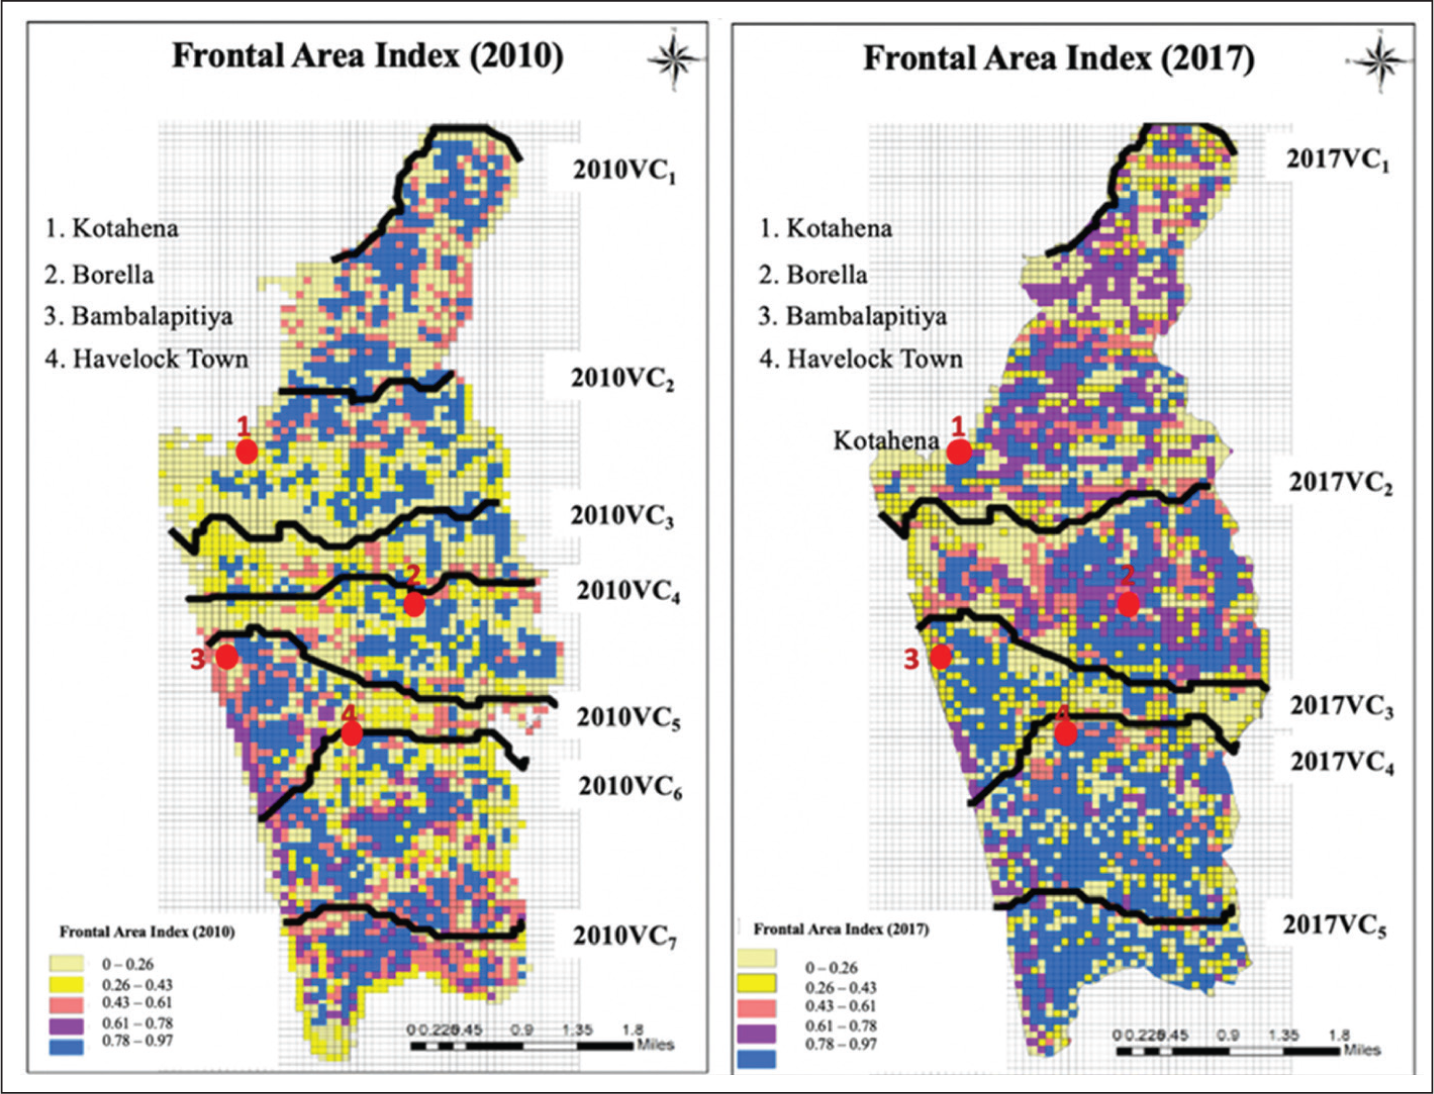
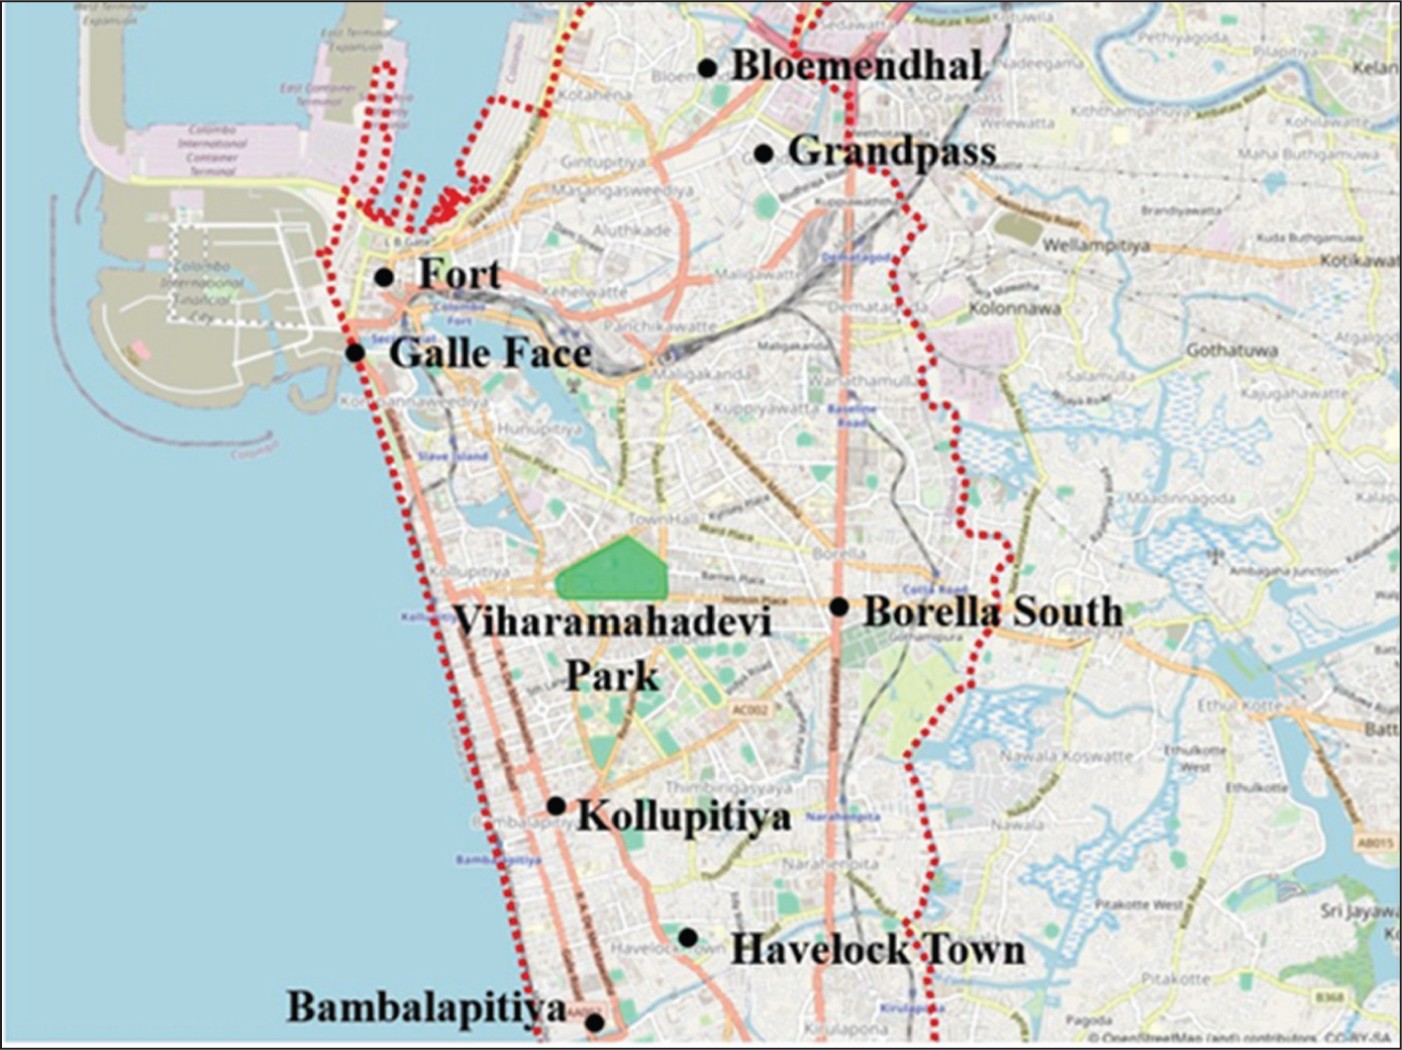
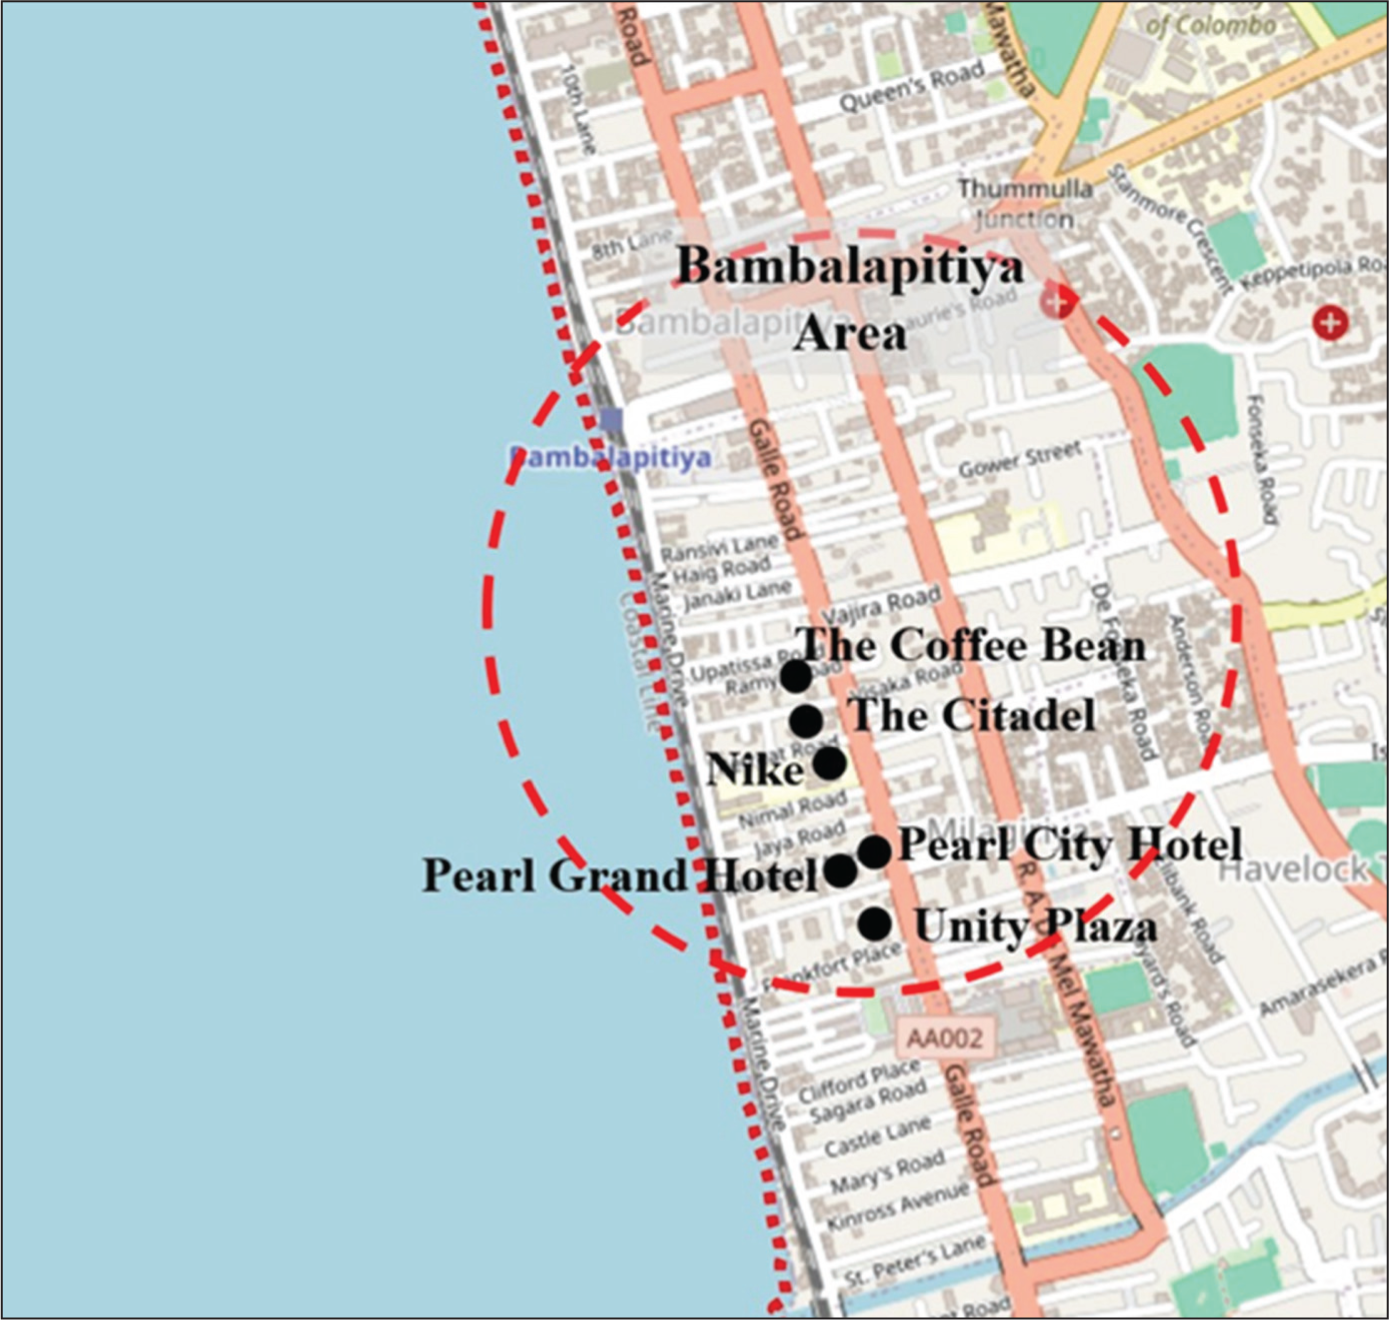
In 2010, FAIs were notably high in the suburbs of Kotahena, Borella, Bambalapitiya and Havelock Town (FAI > 0.7) (Figure 10). This high FAI was due to the large surface area of building façades exposed to the wind direction here. Many buildings in these suburbs are multi-storey structures used for commercial and administrative purposes. High-rise buildings, such as Unity Plaza, Pearl City Hotel, Pearl Grand Hotel, The Citadel, The Coffee Bean, Nike, and Royal Tower, are prominent in and around the Bambalapitiya area (Figure 11).
Location of the Suburbs Within Colombo Municipal Council.
Bambalapitiya Area.
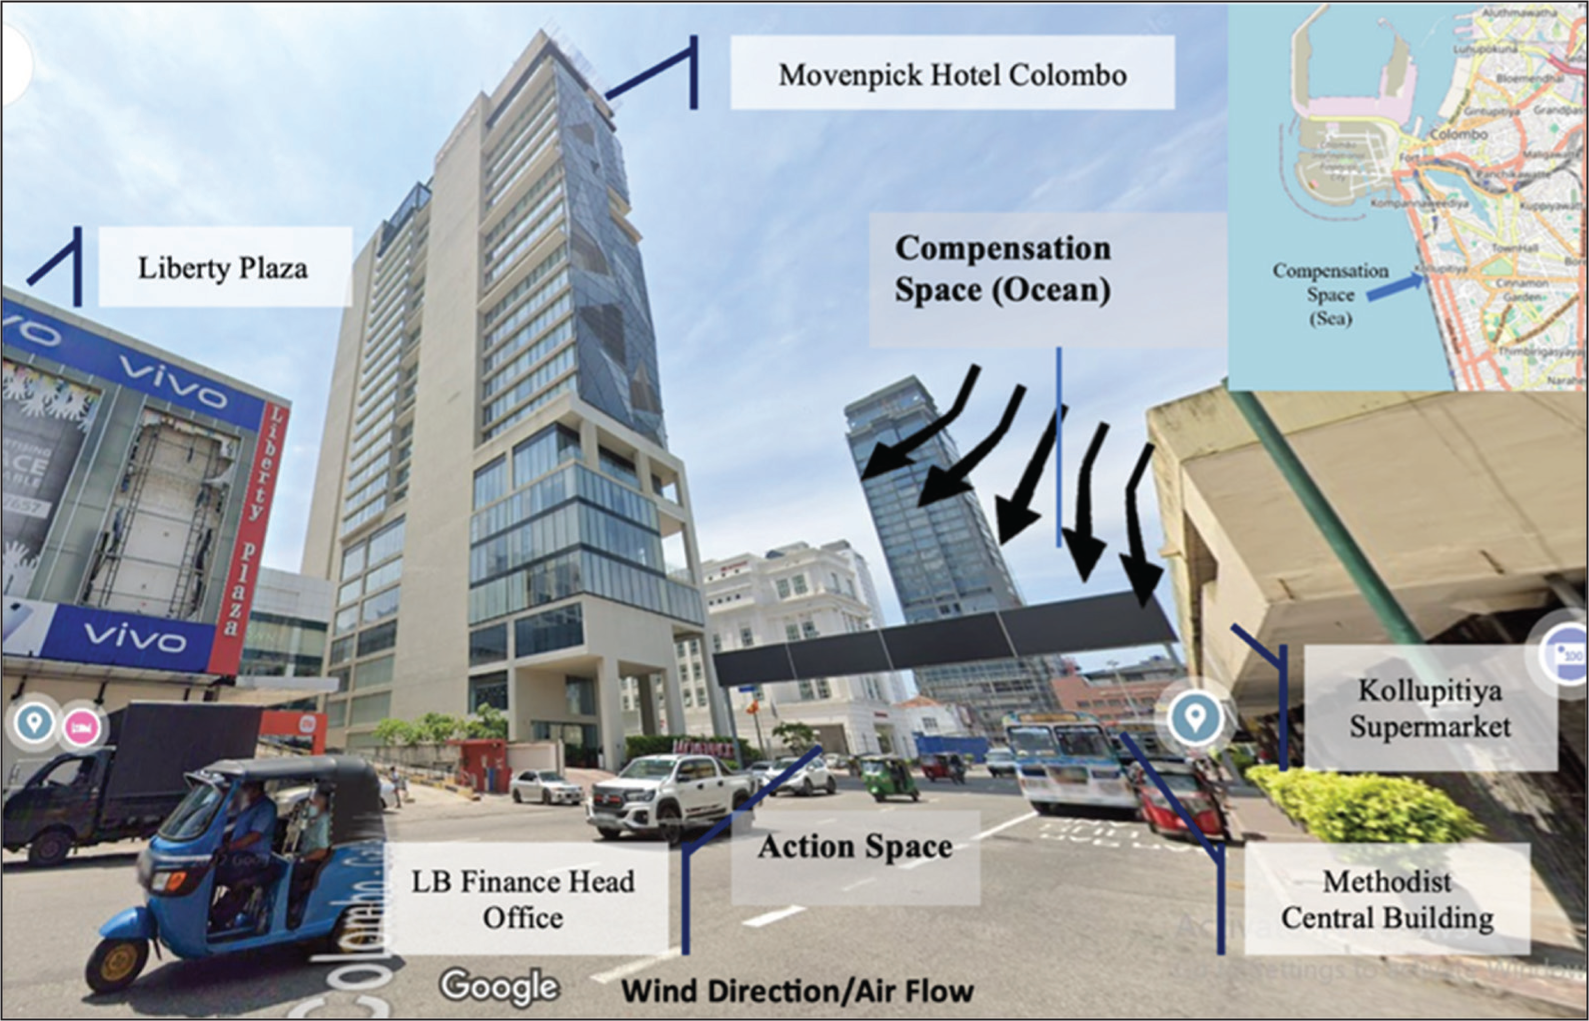
Due to a high FAI or the presence of high-rise buildings facing the ocean, the wind flow originating from the coastal area (compensatory space) towards the interior of the country is obstructed. Figure 12 illustrates how the positioning of high-rise buildings in the Kollupitiya suburb blocks the wind flow from the compensatory space (ocean).
Beach Front of Kollupitiya.
Compared to 2010, by 2017 more areas exhibited higher FAIs, including Bambalapitiya, Bloemendhal, Borella-South, Fort, Galle Face, Grandpass and Havelock Town (Figure 10). These increases in FAI have resulted in more significant wind flow blockages to the inner city by 2017. Consequently, the number of UVCs decreased from seven in 2010 to five in 2017. As shown in Figure 9, UVCs 2010UVC2 and 2010UVC4 had disappeared by 2017. The remaining five UVCs pass through open areas such as Beira Lake, Kelani River and Viharamahadevi Park. The seven UVCs identified in 2010 are discussed in detail next:
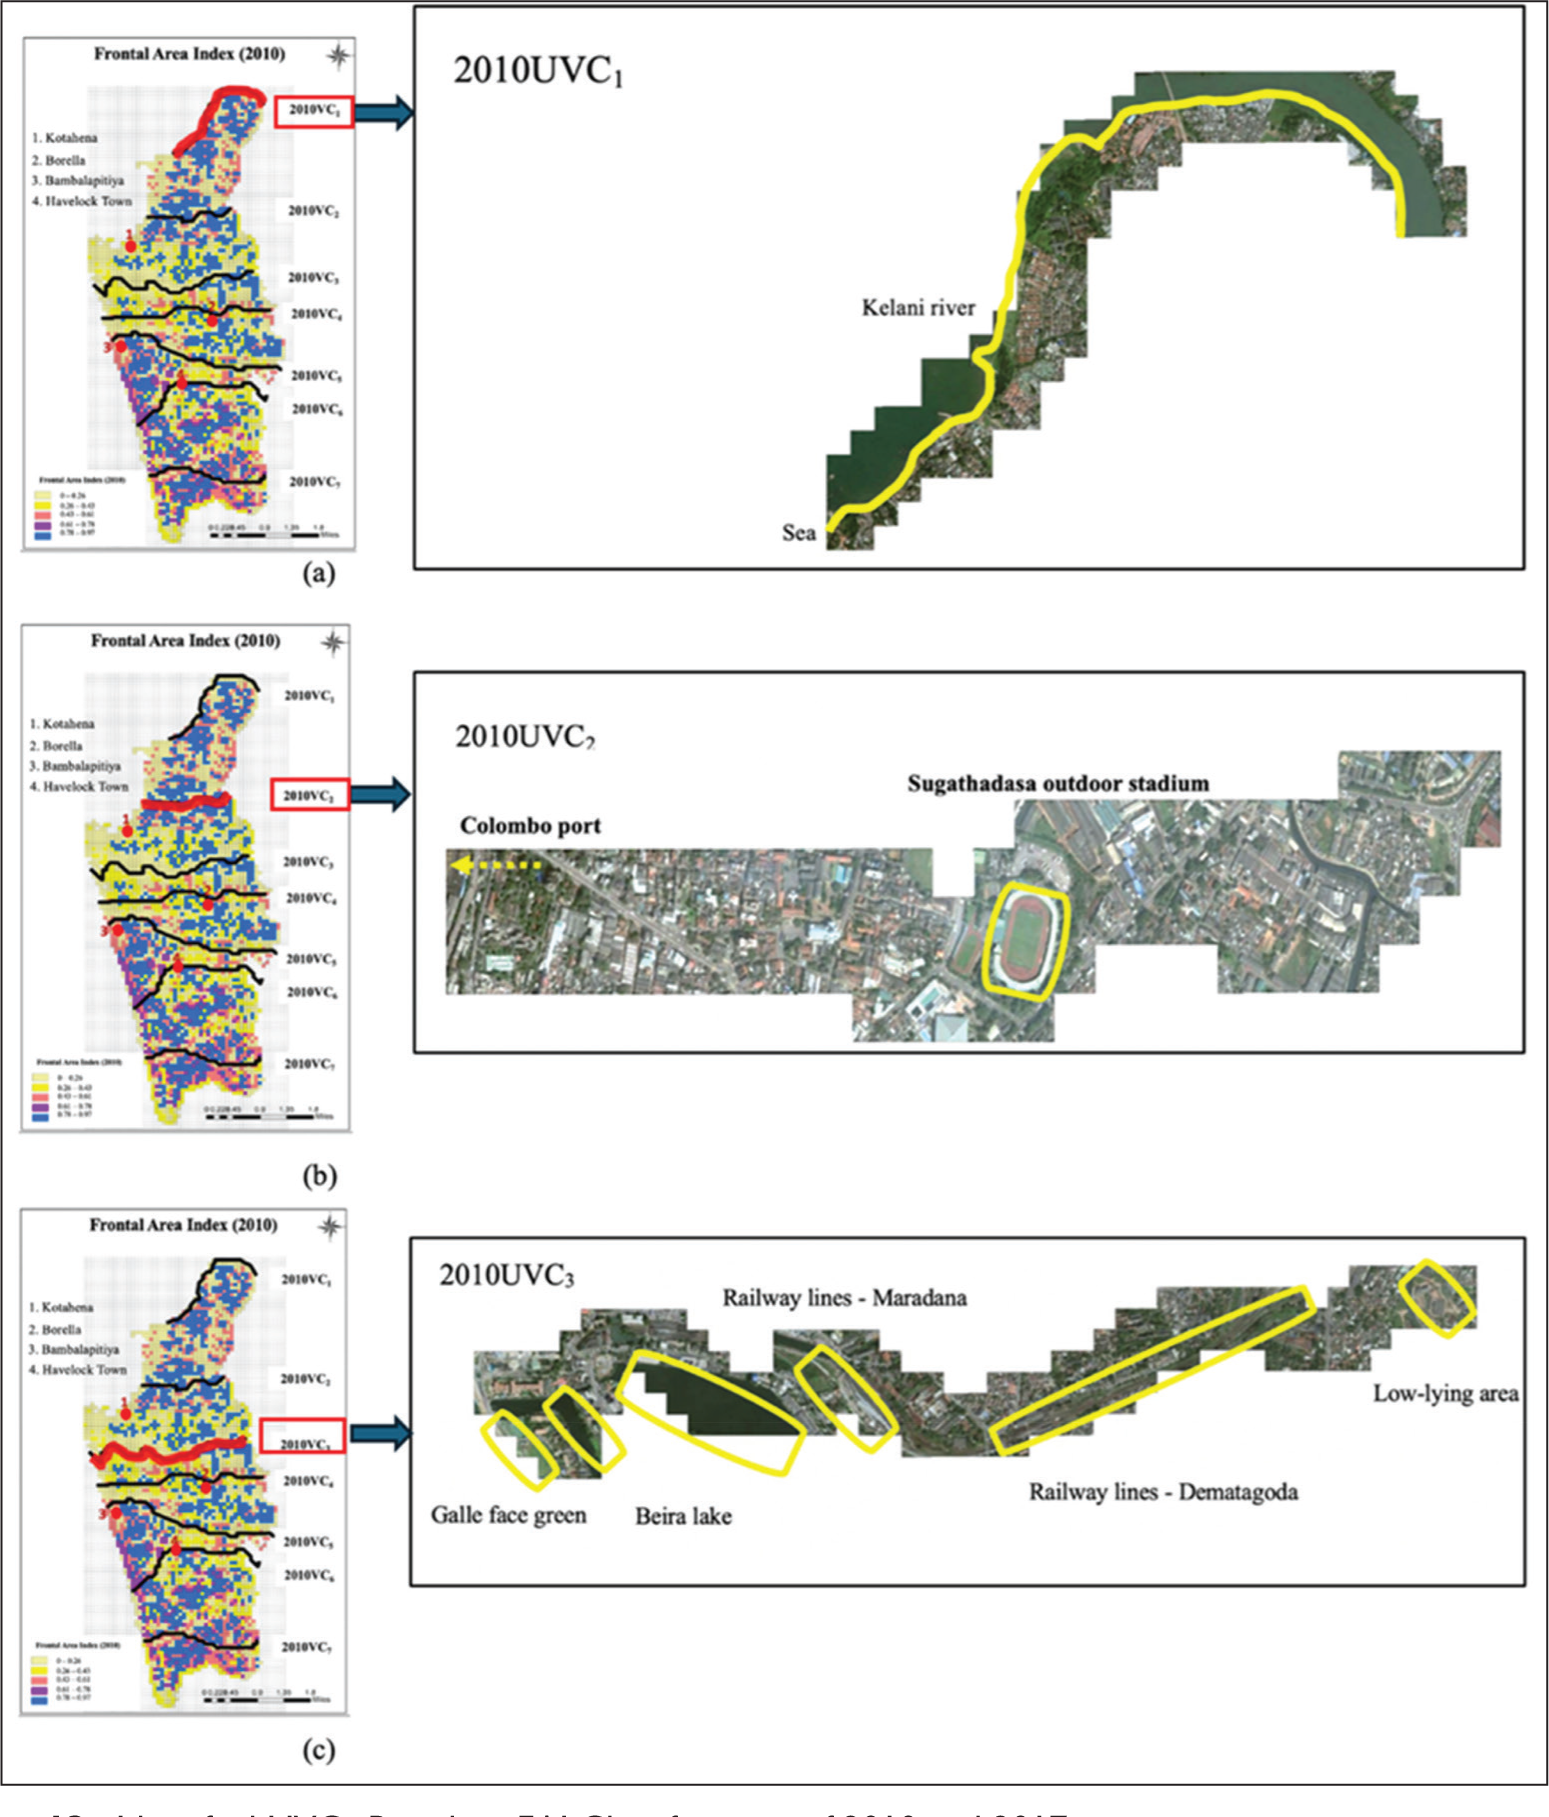
Figure 13 illustrates the identified UVCs based on the 2010 FAI classifications. Ventilation corridor 2010UVC1 commenced from the coastal area along the western boundary of the CMC area and extended parallel to the Kelani River, which forms the northern boundary. Ventilation corridor 2010UVC2 originated from the Colombo seaport (a compensatory space) and passed through an area with numerous mid-rise buildings (action space) and the Sugathadasa Outdoor Stadium (built infrastructure compensatory space). Ventilation corridor 2010UVC3 began near Galle Face Green, another compensatory space, and extended through Beira Lake. Beira Lake and the adjacent railway line served as inland compensatory spaces for 2010UVC3.
Identified UVCs Based on FAI Classifications of 2010 and 2017.
Ventilation corridor 2010UVC4, initiated around the Gangaramaya Buddhist Temple grounds, passed through the lower boundary of Beira Lake and terminated near the Heen Canal on the eastern border. Notably, 2010UVC4 developed along several school playgrounds aligned in sequence, albeit separated by clusters of mid-rise buildings, including Ananda College, St. Joseph’s College, Nalanda College and Seevali School playgrounds. These inland compensatory spaces created a favourable environment for the development of this ventilation corridor.
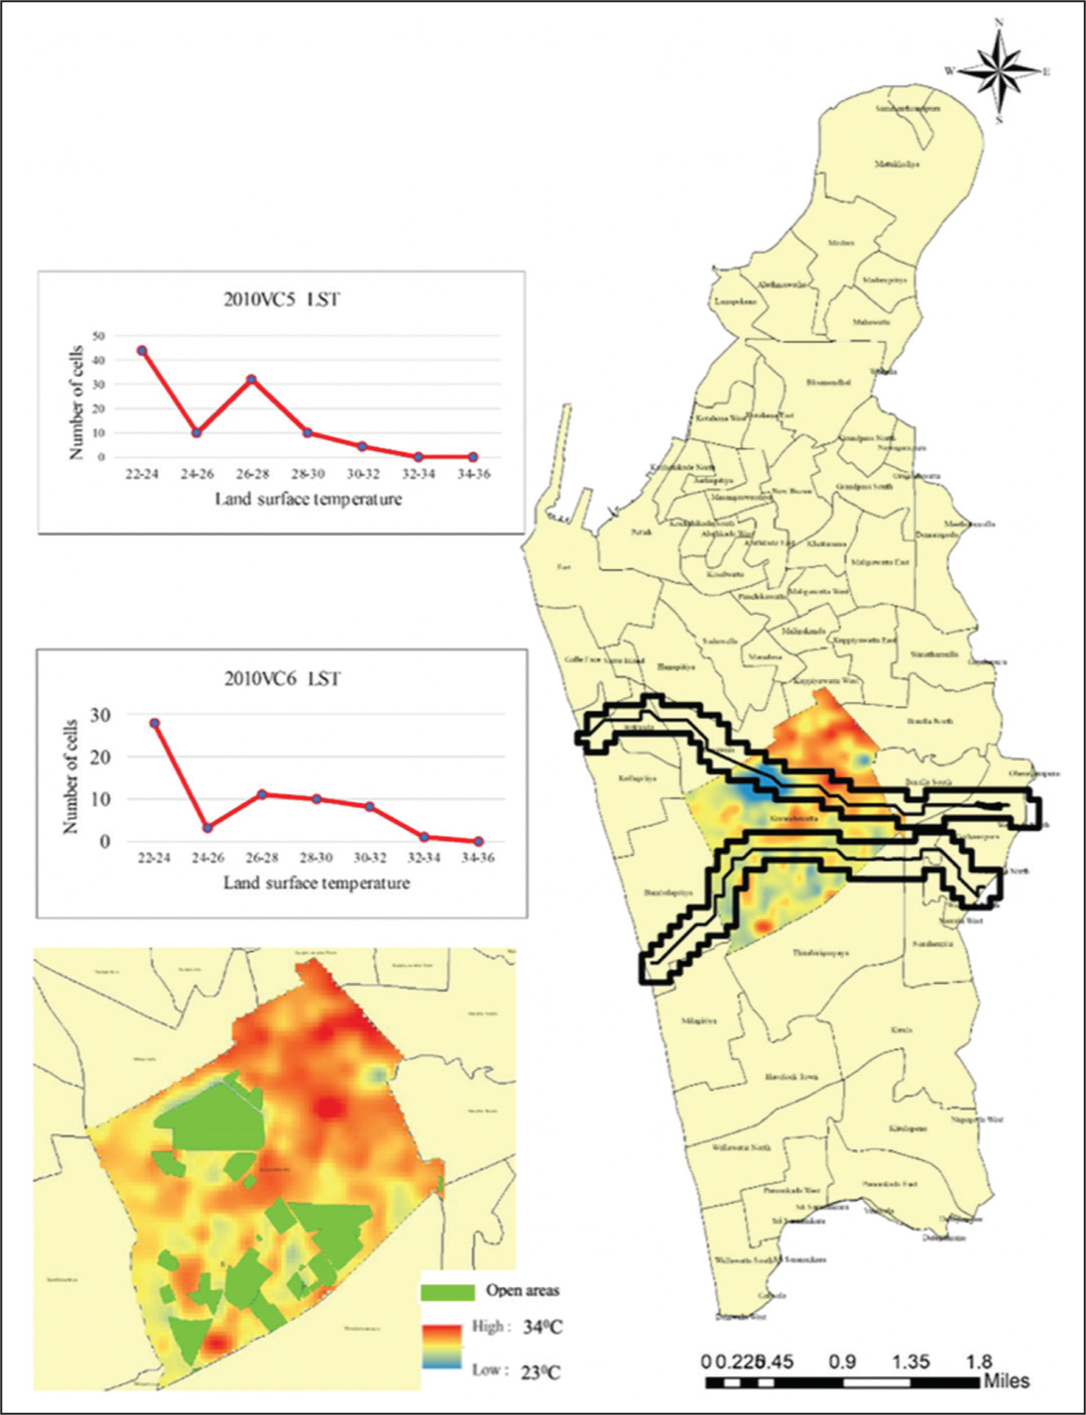
Ventilation corridor 2010VC5 commenced from the southwest sea border (a natural compensation space) and passed through Viharamahadevi Park and Independence Square (inland compensatory spaces). Viharamahadevi Park, Colombo’s largest public park, spans an area of 20 hectares. Ventilation corridor 2010VC6 originated from the southwest sea border and passed through the University of Colombo and Bandaranaike Memorial International Conference Hall. Ventilation corridor 2010VC7 extended parallel to Kirulapana Canal, passing through St. Peter’s College playground, Havelock Town, and a low-lying area, creating a ventilation corridor in the southern half of the CMC area. By 2017, 2010UVC2 and 2010UVC4 had disappeared.
Understanding not only the identification of UVCs but also their behaviour over different years is crucial to comprehend how various factors influence UVCs. Previous studies have typically focused on understanding existing UVCs or planning them as a solution to mitigate LST levels. However, the current study’s findings indicate that planning UVCs is not a straightforward process, as ventilation corridors can be affected by spatial and temporal changes, especially in dynamic urban environments. Therefore, UVC planning should not be conducted in isolation but should be integrated into a holistic urban planning approach. For example, the study identified urban land uses such as urban parks, railway lines, playgrounds and water bodies as significant contributors to the formation of UVCs. This underscores the importance of understanding different land-use categories and their characteristics in creating UVCs and mitigating urban heat.
LCZ Classification
LCZs were identified separately under the main classifications of ‘built’ and ‘natural’ for the years 2010 and 2017. The study area was divided into 100 × 100 m grids. As depicted in Figure 14, the total built-up zone classification in 2010 included 8,605 grids (98.91%), while the nature zone classification comprised 95 grids (1.09%). By 2017, there was an approximate 1% increase in the built-up zone classification, with 8,644 grids (99.36%), and a corresponding reduction in the nature zone classification, which decreased to 56 grids (0.64%).
LCZ Classification by Grid Numbers in CMC Area.
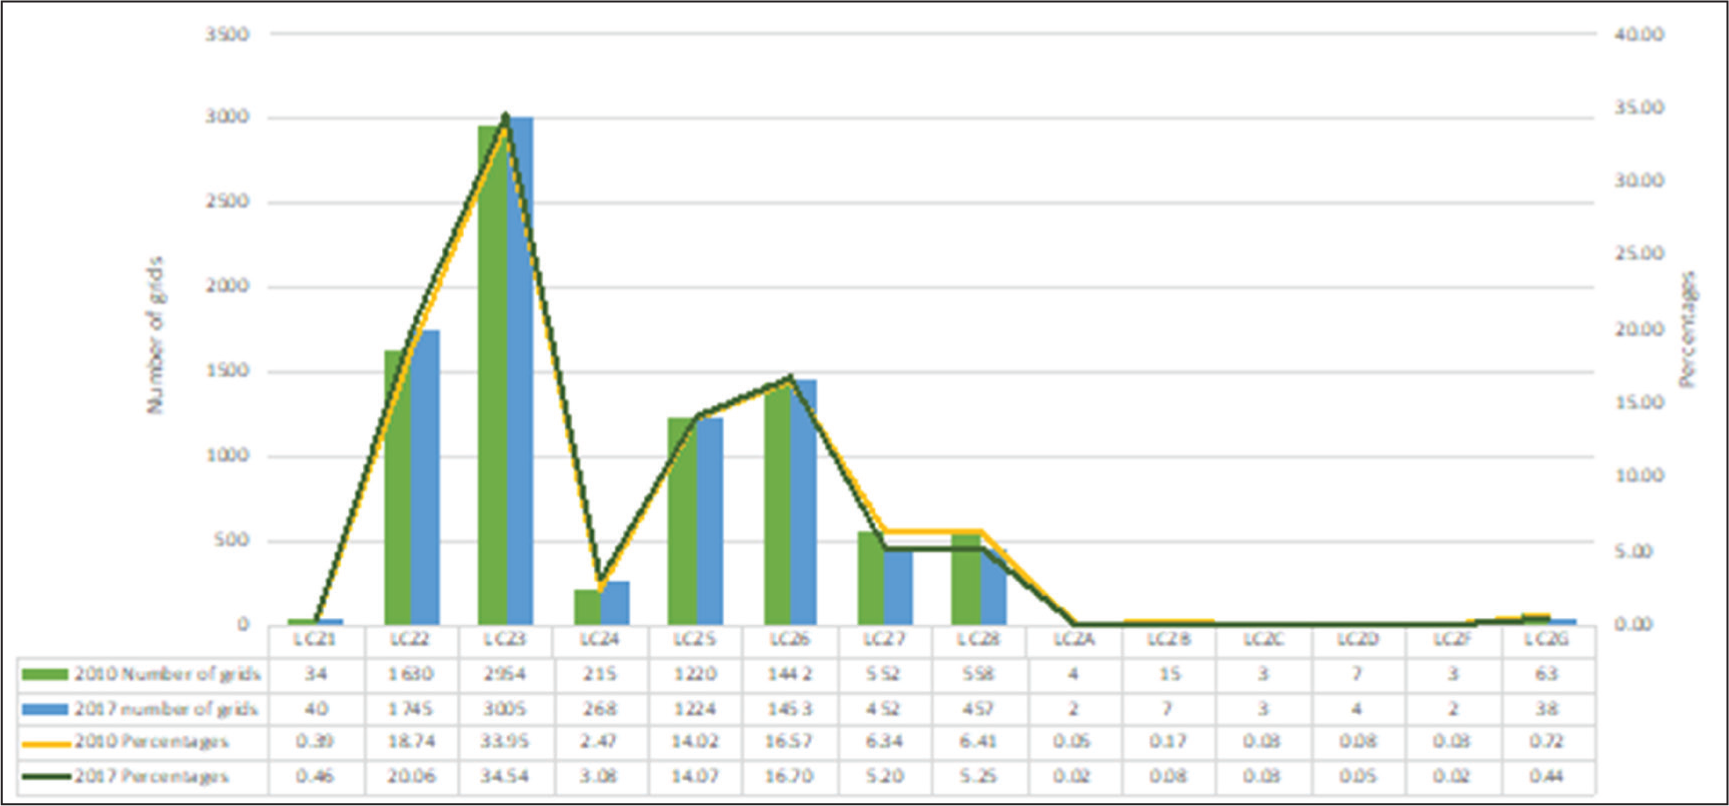
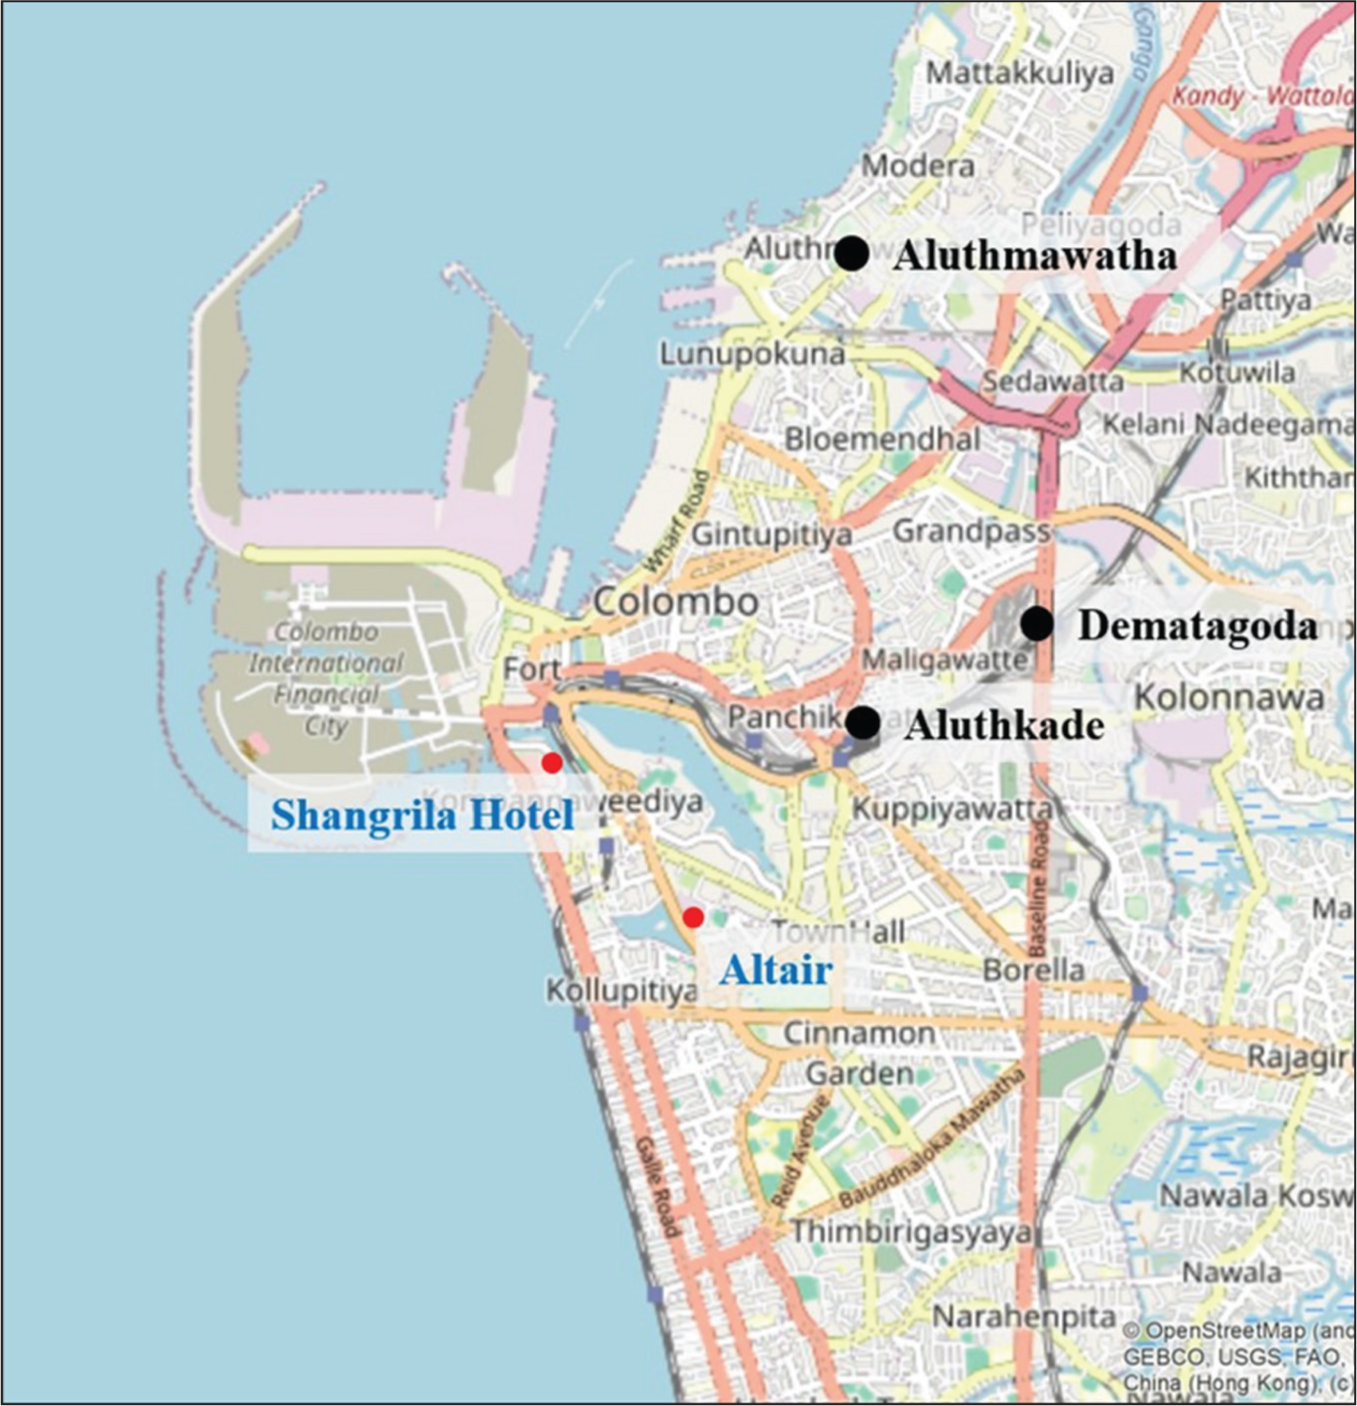
The number of compact high-rise (LCZ 1) grids increased from 34 in 2010 to 40 by 2017. This rise was driven by the emergence of new condominiums and mega investment projects, such as the Shangri-La Hotel and Altaire apartment complex (Figure 15). In 2010, compact mid-rise (LCZ 2) accounted for 19% of the area, encompassing most of the main commercial buildings and shopping complexes. Compact low-rise (LCZ 3) made up 34% of the total building composition in 2010, with a higher concentration of such projects evident in the northern half of the CMC area. Consequently, in 2010, compact low-rise (LCZ 3) had the highest number of grids (n = 2,954).
LCZ 3 primarily included low- or middle-income housing in areas like Dematagoda, Aluthmawatha, Aluthkade-East, and Aluthkade-South (Figure 15), along with small and medium-scale commercial shops. These compact low-rise (LCZ 3) zones were concentrated in the northern half of the CMC area. This suggests that the emergence of compact high-rise (LCZ 1) and compact mid-rise (LCZ 2) in and around UVCs does not create favourable conditions for ventilation corridors. Therefore, the expansion of LCZs should be carefully managed through appropriate urban planning interventions to maintain or enhance urban ventilation.
Mega Investment Projects and Low- to Middle-income Housing.
Similar to LCZ 3 (compact low-rise), the number of grids in LCZ 4 (open high-rise), LCZ 5 (open mid-rise), and LCZ 6 (open low-rise) remained relatively stable from 2010 to 2017. However, there was a slight decline in LCZ 7 (lightweight low-rise) and LCZ 8 (large low-rise) during this period, primarily due to their conversion into more building-dominant LCZs. Overall, aside from LCZs 1–3, there were no significant changes in LCZ classifications within the study area.
LCZs 4–6, which allow space between buildings, facilitate the flow of cooler air into urban areas. However, there was no significant distribution of these LCZs in Colombo during the investigated time period. The rapid urbanization of Colombo, characterized by compact building development, poses a significant threat to the city’s liveability. This study highlights the need for strategic interventions to promote more sustainable urban development, particularly by favouring LCZs such as open high-rise (LCZ 4) over compact high-rise (LCZ 1).
The study also revealed that the CMC area has limited vegetation cover, with a significant reduction in the extent of nature zones from 2010 to 2017, as depicted in Figure 16. For example, half of the 2010 extent of LCZ A (dense green and coniferous forests) and LCZ B (sparse coniferous forest and evergreen forest) had decreased by 2017. However, the extent of LCZ C (open arrangement of bushes, shrubs and short woody trees) remained unchanged. Similarly, LCZ A–B and LCZ D (grassland or herbaceous plants) experienced significant reductions by 2017. In contrast, LCZ F (soil or sand cover, few or no trees or plants) remained the same, while LCZ G (large, open water bodies or small bodies) saw a significant decline.
For instance, in 2010, 0.7% of the LCZs belonged to LCZ G, but this figure dropped to 0.4% by 2017. The LCZ G open water bodies included Beira Lake and Kelani River. The significant reduction in LCZ G can be attributed to the encroachment and filling of water bodies for construction. The conversion from natural zones to building zones, along with the increase in compact low (LCZ 3) and mid-rise (LCZ 2) buildings from 2010 to 2017, has negatively impacted urban air circulation.
These findings underscore the importance of integrating blue and green networks, such as those in UVCs 2010UVC1 and 2010UVC5, into urban planning to mitigate heat effects. Blue networks refer to the main water bodies in the area including Beire Lake, Kelani River, the canal system and related other relevant places. Green networks refer to the open spaces, including parks, playgrounds and boulevards, and other relevant places located in the study area. Urban settings are typically defined by road networks and building blocks, but this study highlights the need to prioritize blue and green networks as UVCs. These networks are the primary corridors through which wind circulates air within urban areas. Unfortunately, the significance of nature-based LCZs has often been overlooked in new developments, leading to unhealthy climate conditions, such as the formation of UHIs. The study’s outcomes emphasize the need to recognize and incorporate nature-based LCZs as fundamental elements in the layout of UVCs.
According to Figure 16, the changes were persistent in LCZ classifications along the UVCs. For example, the LCZs along the now missing 2010UVC2 and 2010UVC4 had shifted from LCZ 3 (compact low-rise) to LCZ 2 (compact mid-rise) by 2017. This shift can largely be attributed to condominium residential developments in the Dematagoda, Maradana and Narahenpita suburbs, as well as increased building density.
Spatial Distribution of LCZs (Buildings and Nature) Along the UVCs (Years 2010 and 2017).
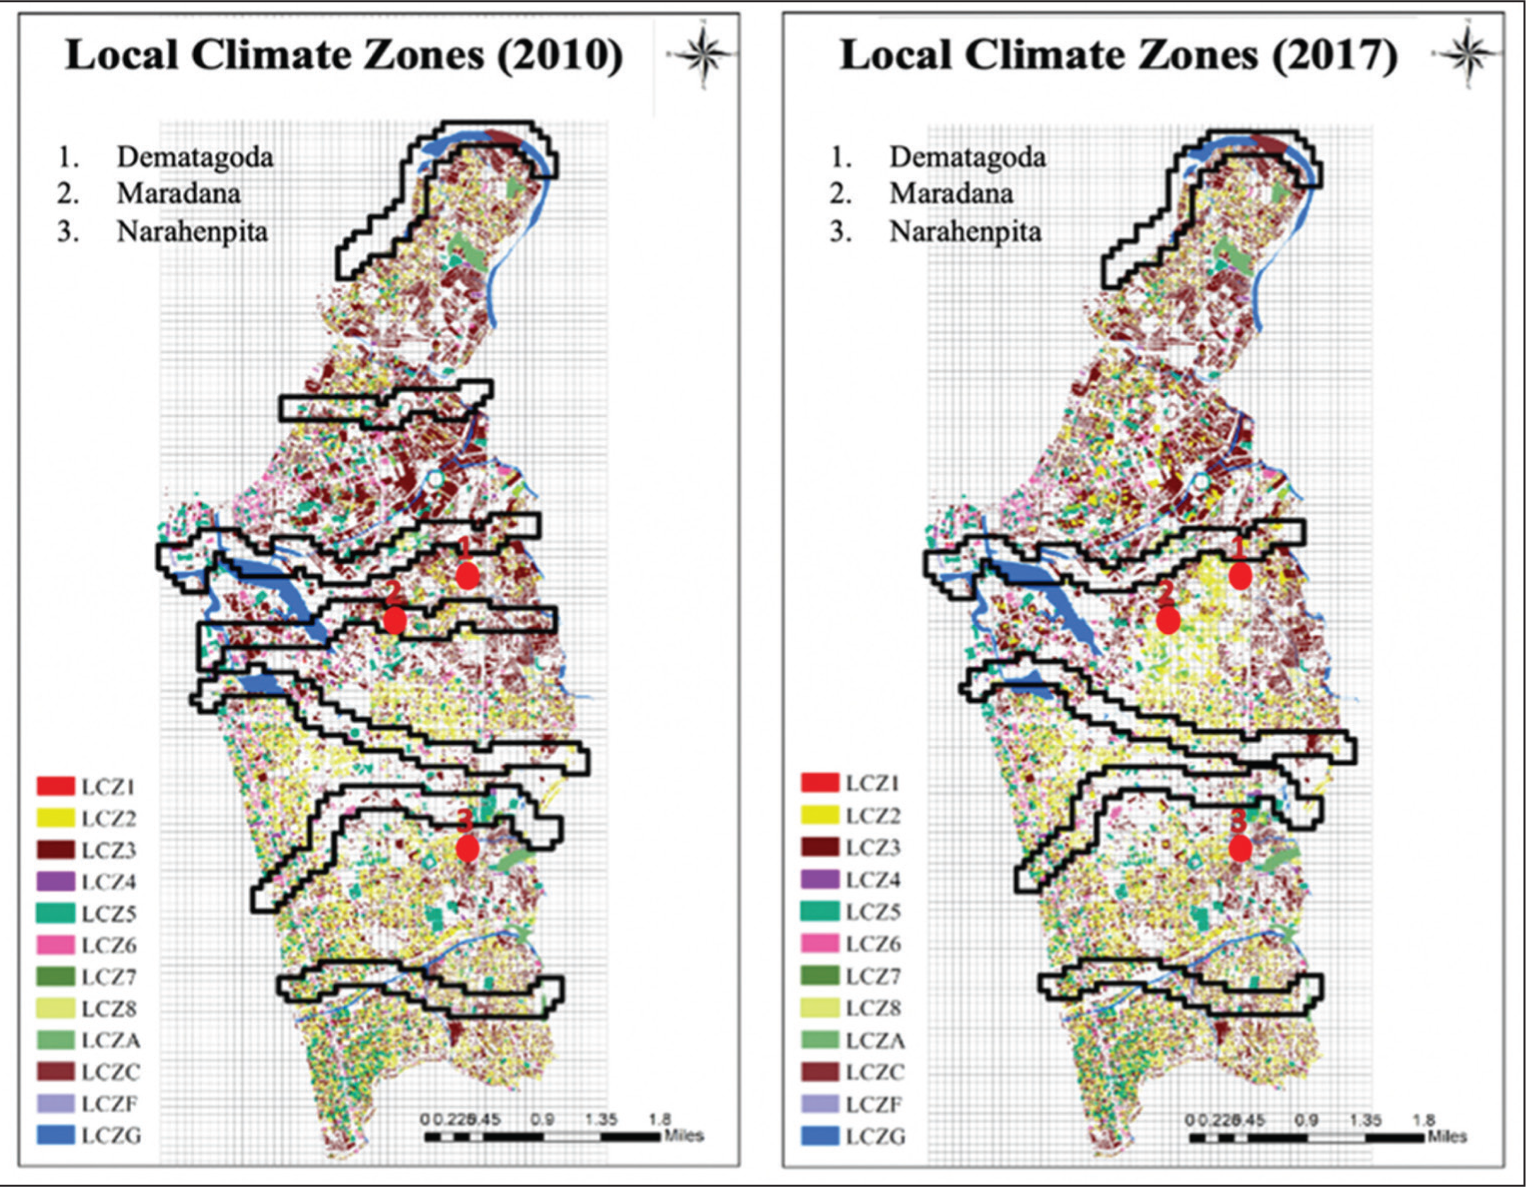
Compared to other areas, the identified UVCs had a higher presence of nature zone classifications such as LCZ B (sparse coniferous forest and evergreen forest), LCZ C (open arrangement of bushes, shrubs and short woody trees) and LCZ G (large, open water bodies or small bodies). For instance, both 2010UVC1 and 2017UVC1 contained a higher number of grids classified as LCZ B and LCZ G. Similarly, 2010UVC3 and 2017UVC2 recorded a higher presence of LCZ G. In contrast, the disappeared UVCs (2010UVC2 and 2010UVC4) by 2017 had a low presence of nature zone grids and a high concentration of built-up zones, such as LCZ 2 and LCZ 3. This pattern confirms that a higher number of built-up zone-related grids, such as LCZ 2 and LCZ 3, can contribute to the disappearance of existing UVCs.
The 2017 UVC3, which includes a significant number of LCZ 2, LCZ 3 and LCZ 5 grids, is at risk of disappearing in the future if protective measures are not implemented. The study’s finding that the number of UVCs decreased from seven in 2010 to five in 2017 underscores the importance of understanding the temporal changes in LCZs along UVCs. Moreover, given the current LCZ distributions in 2017, there is a high potential for the disappearance of 2017 UVC3 within the next few years. Therefore, it is crucial to formulate appropriate land-use regulations to promote compatible land uses and protect these vital ventilation corridors.
Land Surface Temperature
According to Figure 17, the LST increased from the coastal areas to the interior of the country between 2010 and 2017. For instance, the maximum LST, which was recorded at 33°C in 2010, rose to 36°C by 2017.
Spatial Distribution of LSTs (Years 2010 and 2017).
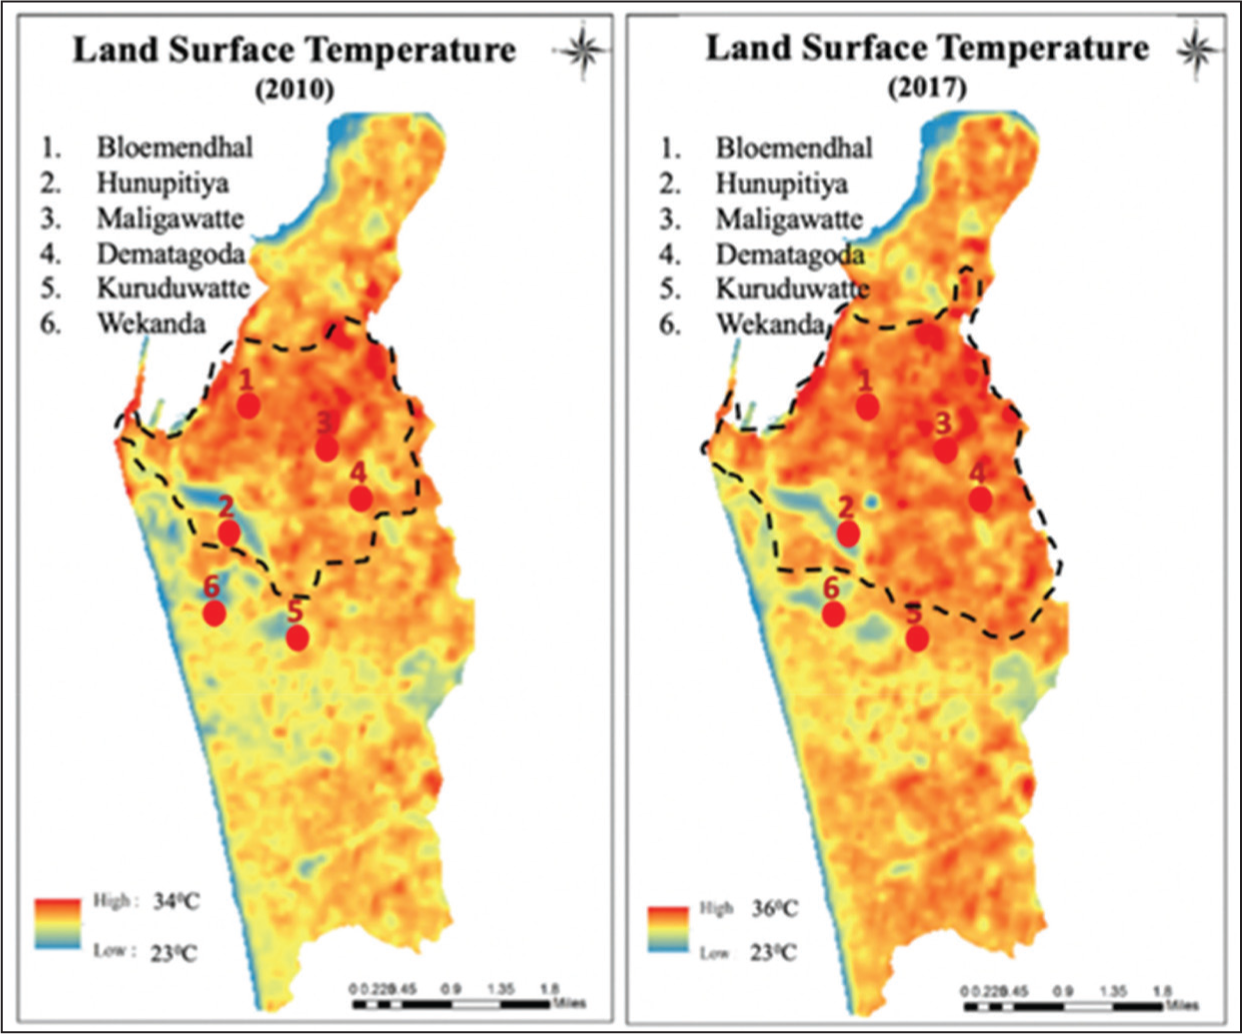
Referring to the LST data obtained for 2010, lower temperature patterns are evident in the GNDs of Kurunduwatta and Wekanda. Viharamahadevi Park, located in the Kurunduwatta GND, acts as an inland compensatory space where the absence of buildings allows air to flow freely, contributing to these areas being relatively cool islands with minimal temperature increases. Additionally, Viharamahadevi Park and its adjacent open areas support two UVCs, namely, 2010UVC5 and 2010UVC6, which remained unchanged from 2010 to 2017.
Comparing the LST changes between 2010 and 2017, an elevation in temperature is noticeable, particularly in the GNDs of Hunupitiya, Bloemendhal, Maligawatta and Dematagoda. It is evident that the formation of UHIs intensified in 2017 compared to 2010. Areas that previously exhibited low LST in 2010, such as Wekanda GND, saw an increase from 26°C in 2010 to 30°C in 2017. However, as shown in Figure 17, the LST levels along the UVCs were comparatively lower than the maximum LST levels recorded in both 2010 and 2017, highlighting the mitigating effect of these ventilation corridors on urban heat.
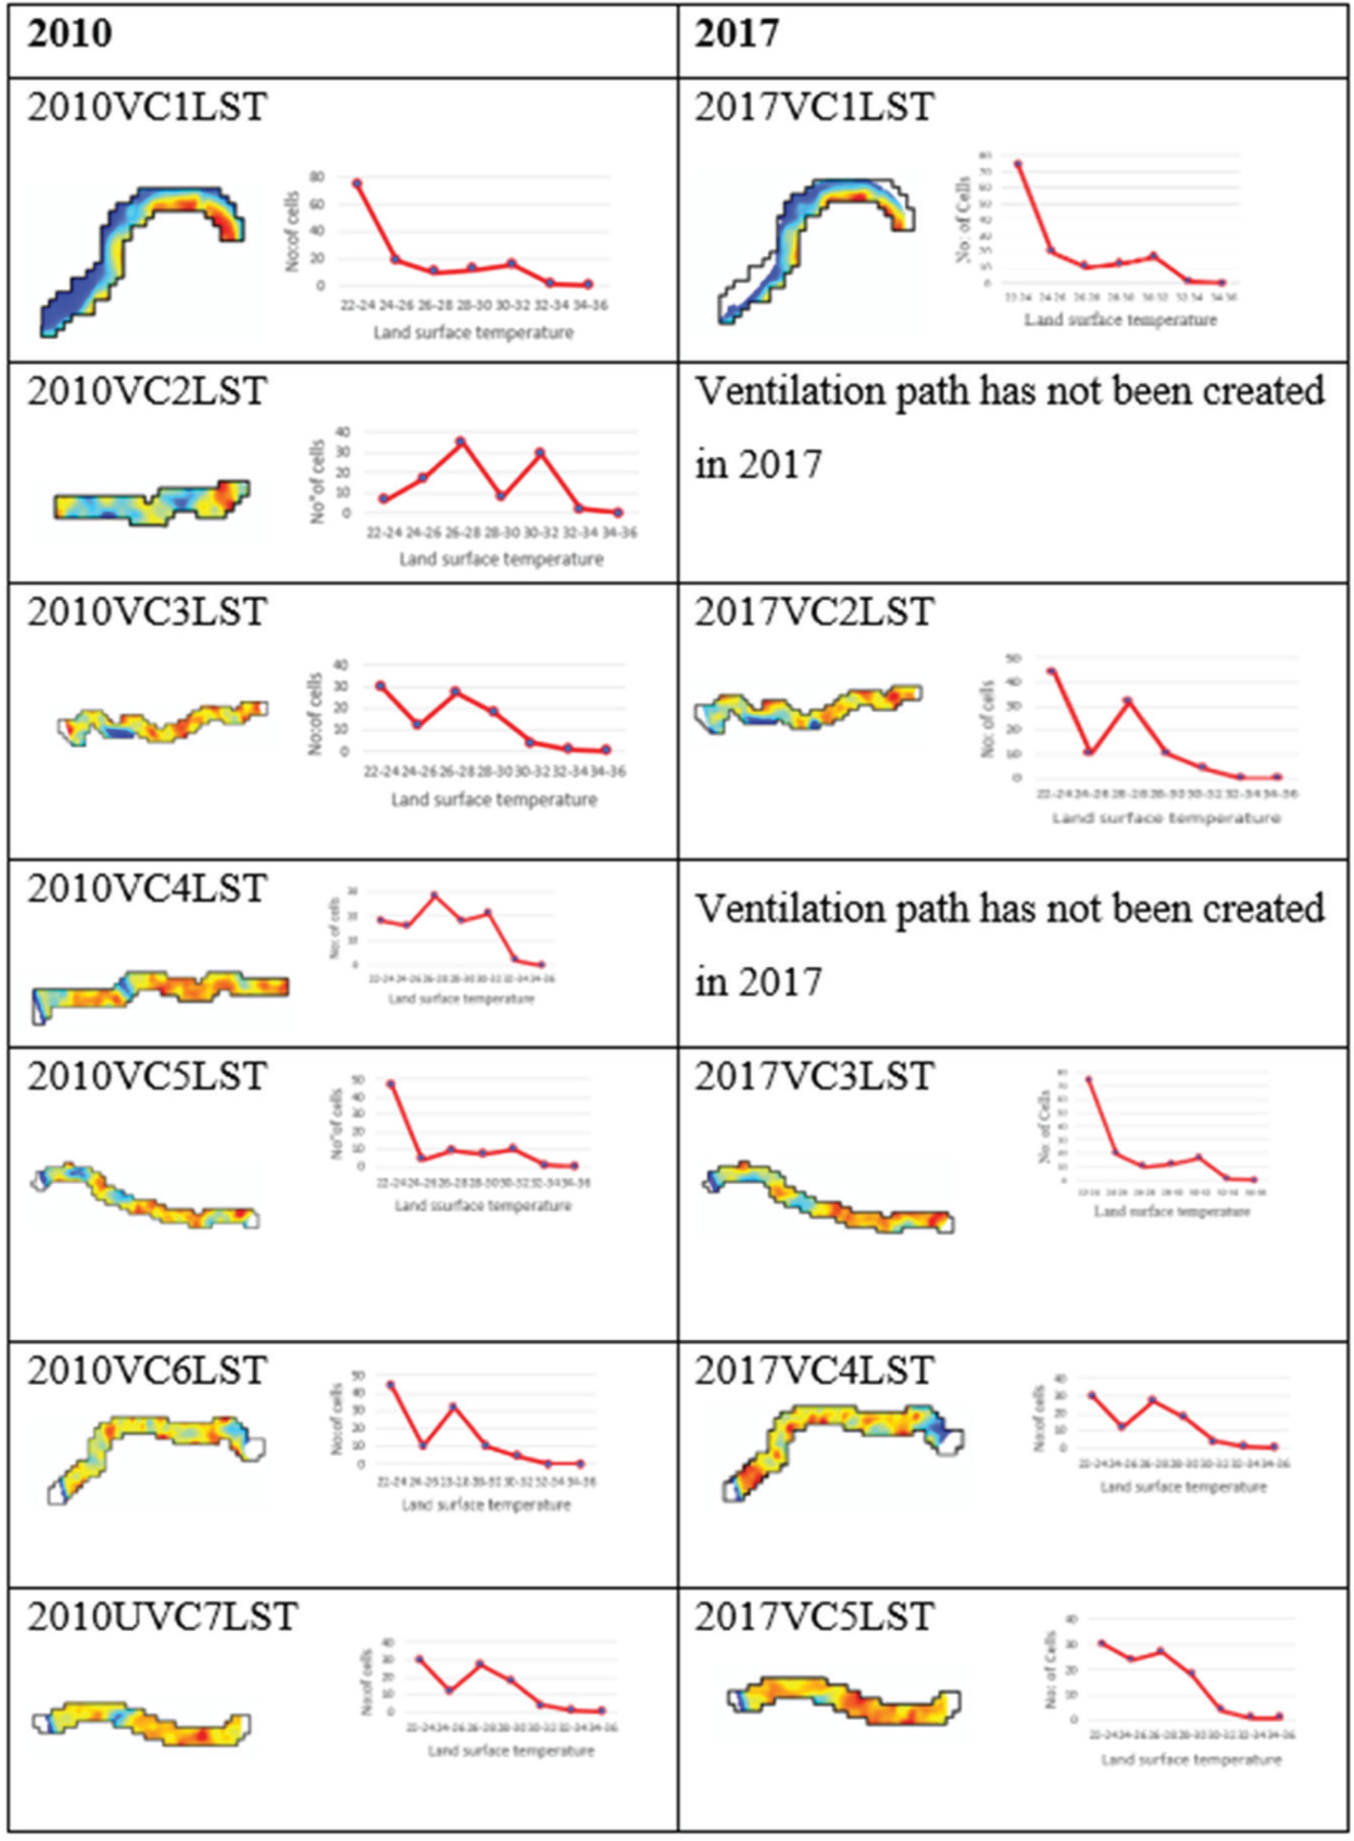
As shown in Figure 18, the ventilation corridor 2010UVC1 maintained the lowest temperature range (22°C‒24°C) and did not show significant changes in 2017. Both 2010UVC1 and 2017UVC1 followed the same path with minimal alterations, with the LST increasing by only 1°C between 2010UVC1 and 2017UVC1. On the other hand, 2010UVC2 was no longer detectable in 2017. The grids where 2010UVC2 once existed showed a temperature range of 28°C‒34°C in 2017. Similarly, the 2010UVC4 corridor, identified in 2010, had disappeared by 2017, with the grids belonging to this UVC experiencing an increased LST of 32°C‒34°C in 2017. No significant temperature changes were observed in the ventilation corridors of 2010UVC5, 2010UVC6 and 2010UVC7 between 2010 and 2017. However, areas without these UVCs exhibited high temperature patterns in both 2010 and 2017.
Comparison of LSTs in 2010 and 2017 Along the UVCs.
A comparison of Figures 18 and 19 reveals a positive relationship between LCZ 2 (compact mid-rise) and LST, where LST increases with the rise in compact mid-rise (LCZ 2) buildings. Regardless of building height, the compact LCZ category significantly influences LST levels, contributing to the formation of UHIs. If appropriate land-use policies regarding LCZs had been adopted, the disappearance of a UVC and the formation of a larger UHI might have been prevented. Therefore, it is crucial to understand the role of UVCs at the local or regional level in urban planning practices to combat extreme heat conditions, rather than relying solely on a neighbourhood-level settlement strategy.
Findings and Discussion
Urban planning practices operate at various tiers, including settlement, local, regional and national levels. Different decisions are made at each planning level to ensure sustainable urban growth within a country. Among these, the study findings highlight UVCs as an effective local- or regional-level urban planning strategy to combat negative impacts such as UHIs caused by high LST levels. Unfortunately, the integration of UVCs as a potential strategy to mitigate high LST levels is not commonly adopted in practice.
Instead, strategies like urban greening, cool roofing, green infrastructure, and the use of heat-resilient construction materials have become more popular for mitigating increasing LST levels in urban areas. Nonetheless, there are three major issues related to these strategies: (a) scale, (b) cost and (c) cumulative effect.
Scale: Many LST mitigation strategies, such as green roofs or cool roofs, primarily reduce temperatures in specific buildings or areas (Pantaloni et al., 2022). Their impact may not extend to a broader urban scale. In contrast, UVCs can potentially provide a more widespread and systematic cooling effect across the entire city (Ren et al., 2018).
Cost: Implementing green roofs and extensive urban greening can be costly and requires ongoing maintenance (Shafique et al., 2018). UVCs may offer a more cost-effective approach as they involve designing urban elements rather than the continuous maintenance of individual installations (Li et al., 2024).
Cumulative Effect: The cumulative impact of individual LST mitigation strategies may not be as substantial as the combined effect of an integrated UVC network (Liu et al., 2021). UVCs can enhance airflow and disperse heat and contribute to a more cohesive and effective urban cooling strategy (Dang et al., 2022).
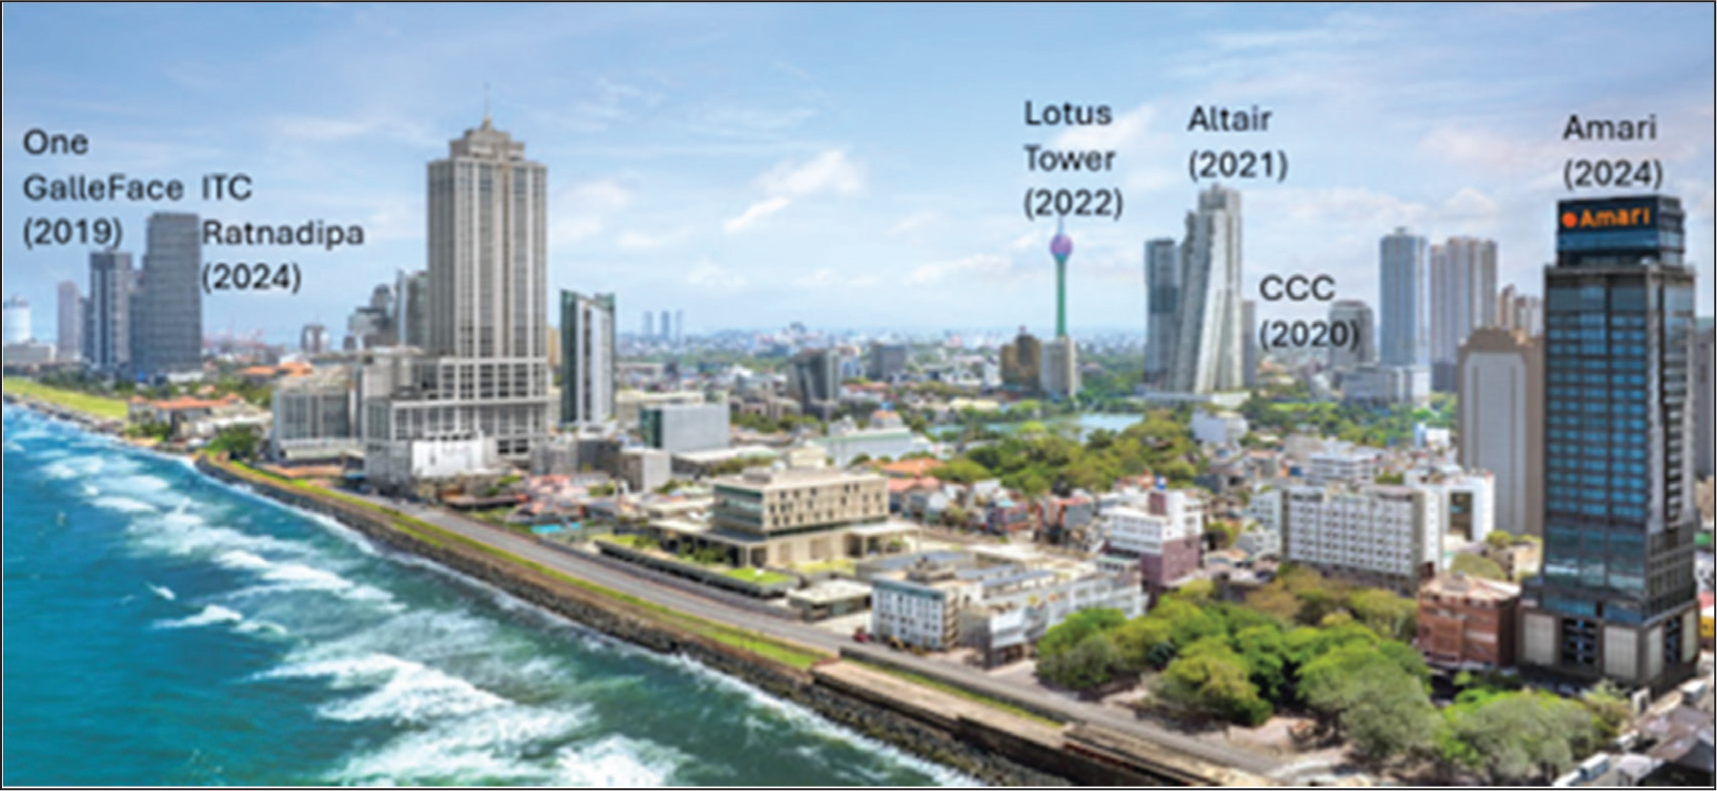
Figure 19 illustrates the significant changes to the Colombo skyline between 2018 and 2025. Notably, all high-rise buildings with a high FAI were situated between the ventilation corridors of 2017VC2 LST and 2017VC3 LST. Additionally, the 2010VC4 area, which was also located between the said ventilation corridors, had disappeared by 2017 due to changes in LCZs and FAIs.
Skyline Change in Colombo (2018–2025).
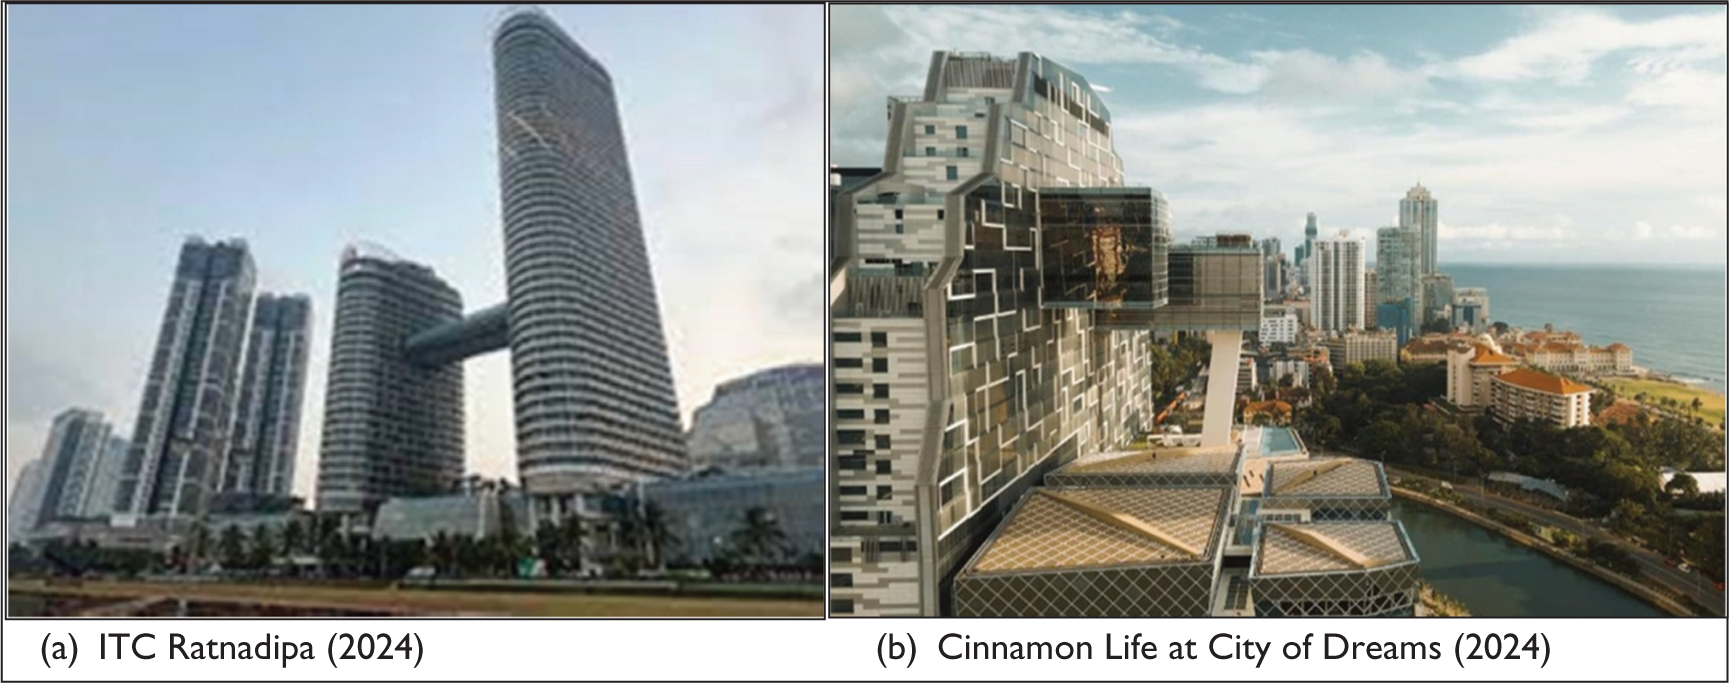
The developments in and around the 2017VC2 LST and 2017VC3 LST ventilation corridors during 2017‒2024 are likely to have a significant impact on urban thermal comfort in Colombo in the near future. Although none of Sri Lanka’s urban planning policies directly address the incorporation of microclimate aspects in development project approvals, some design strategies have facilitated natural airflow. For instance, ITC Ratnadipa (Figure 20a) has managed space between buildings and maintained lower FAIs towards the seafront, promoting wind flow toward the inner city. While the low building height in Cinnamon Life at City of Dreams (Figure 20b) is commendable, the study findings suggest that providing additional open space in the building design would further enhance smooth wind flow into the inner city.
Building Designs Located Adjacent to the Identified Ventilation Corridors.
Facilitating UVCs in urban planning practices can provide long-term benefits to a region (Gu et al., 2020). To establish UVCs, it is essential to maintain adequate compensatory spaces, such as open spaces and water bodies, as well as air passages that connect these compensatory spaces with the built environment (action space). Incorporating a UVC network into city plans would help enhance the liveability of the urban environment (Ren et al., 2018). Additionally, implementing appropriate policy and planning guidelines to maintain UVCs once they are established is crucial (Gu et al., 2020). This study revealed that two UVCs identified in 2010 had disappeared by 2017 due to changes in land use, LCZs and FAIs. As shown in Figure 21, 2010UVC5 and 2010UVC6 persisted from 2010 to 2017, both passing through the Kurunduwatta GND. This is the only instance where two UVCs were observed moving through the same GND, particularly in close proximity to each other. Kurunduwatta GND, once known as the exemplary garden city of East Asia, created a favourable environment for easy airflow movement, illustrating the potential benefits of integrating UVCs into urban planning.
LST and UVCs Moved via the Kurunduwatta GND.
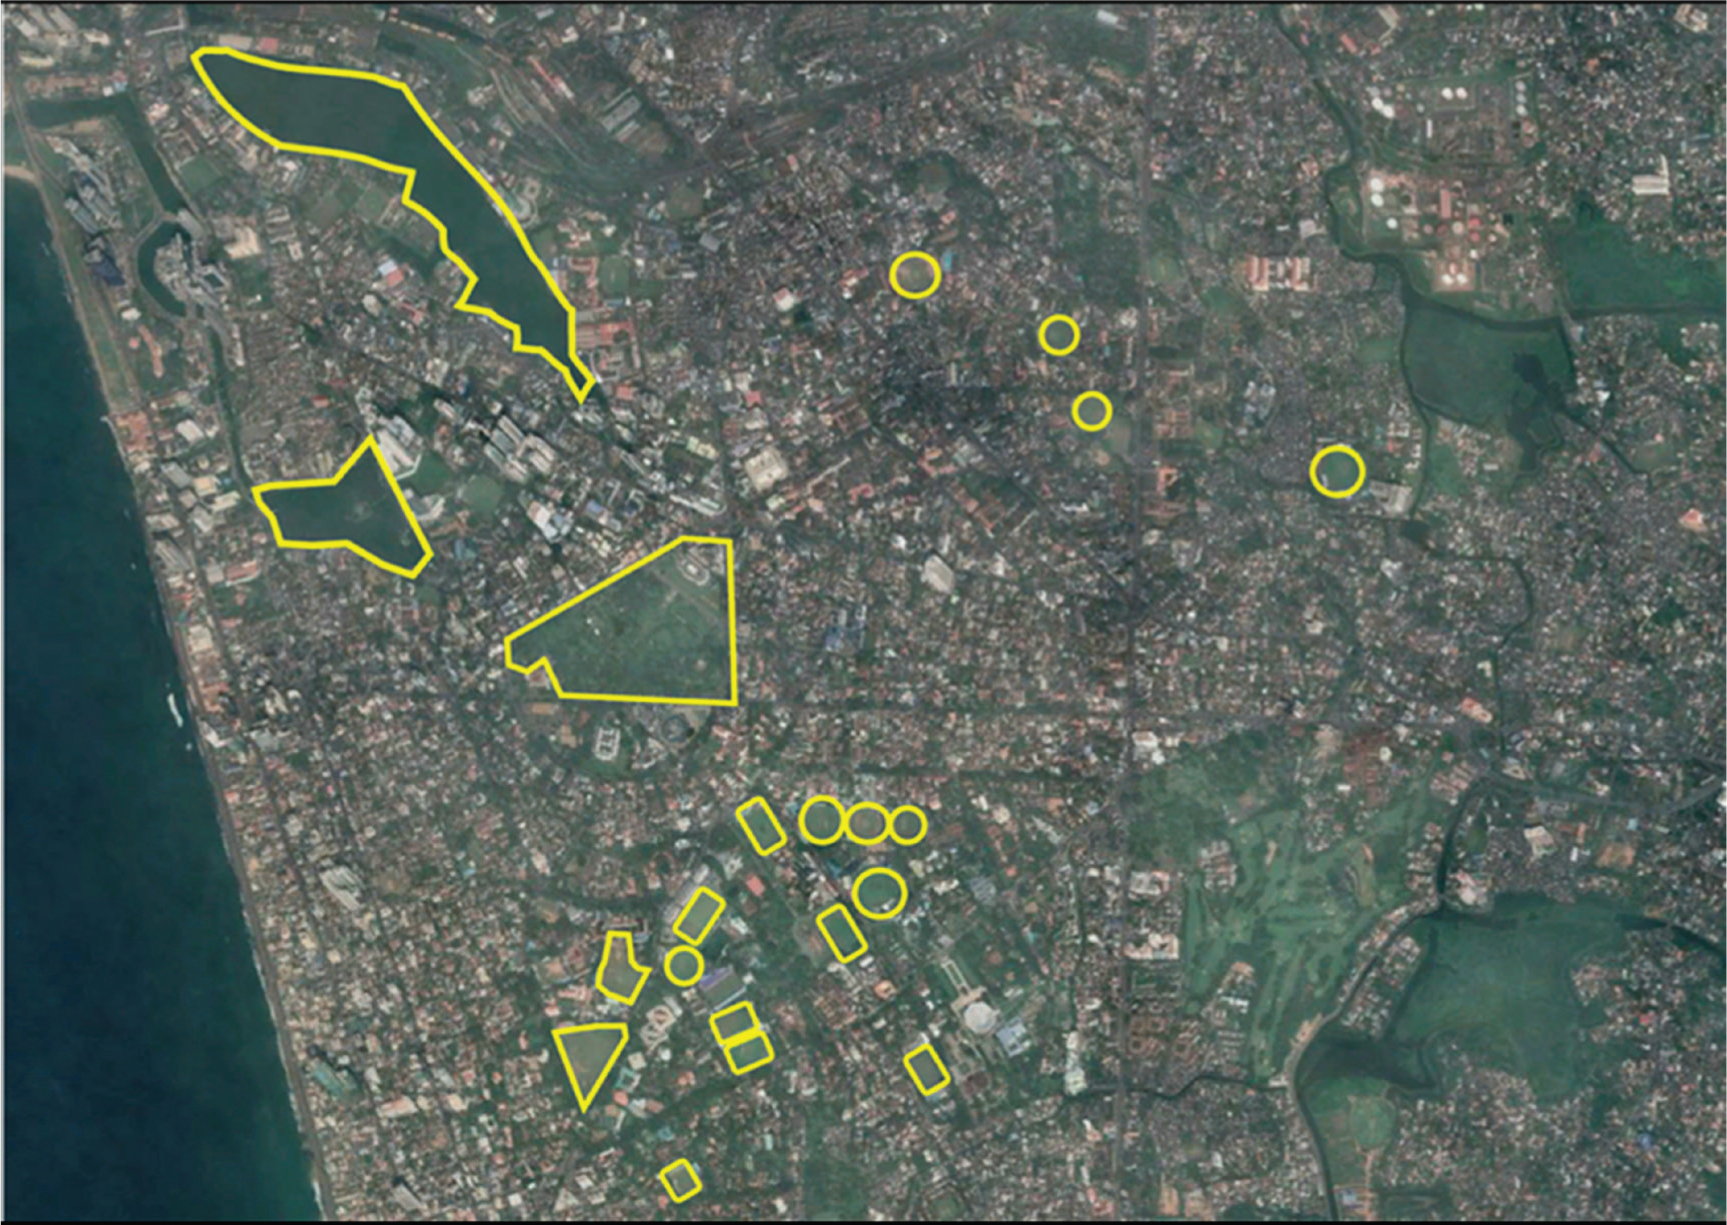
Patrick Geddes, a key figure in the urban planning and development of Colombo during the early twentieth century, significantly influenced strategies related to sustainable development, green spaces and community engagement (Town Planning in Sri Lanka, 2013). His planning efforts were closely aligned with Ebenezer Howard’s garden city movement, which led to Colombo being known as the ‘Garden City of the East’. A satellite image of the open areas located in Kurunduwatta GND, developed under Patrick Geddes’ initiative, is shown in Figure 22. For decades, the CMC area, which is the focus of this study, benefited from the positive effects of Kurunduwatta GND’s land use in reducing heat stress near Sri Lanka’s commercial capital (Goist, 1974; Gunaratna, 2002). This historical context underscores the importance of integrated development guidelines for maintaining UVCs in urban areas to sustain and enhance their positive effects on the urban environment.
Integrating UVCs into urban planning requires a concerted effort to create compensatory spaces and incorporate air passages within the urban fabric (Gu et al., 2020; Ren et al., 2018). These design elements not only help mitigate the effects of UHIs but also enhance the overall quality of life for city residents (Hsieh & Huang, 2016). Providing appropriate development guidelines to ensure lower FAIs and suitable LCZs near compensatory spaces, maintaining existing natural compensatory spaces and creating new ones, such as parks and playgrounds, are key recommendations derived from this study.
For instance, areas like Beira Lake, Galle Face Green and Kelani River have an FAI value of less than 0.5, illustrating that FAI is an important parameter—akin to regulations on Floor Area Ratio, Building Frontages and Open Space Ratio—in creating liveable and healthy cities. However, FAI is often a neglected parameter in planning and building practices.
This conclusion does not argue against the necessity of high-rise buildings and industrial zones in a city but rather emphasizes the importance of guiding urban development in a more resilient and sustainable manner. By embracing UVCs and their associated components, cities can make significant strides towards building more sustainable, resilient and comfortable urban environments for their residents.
Conclusion
Despite the following limitations of this study—(a) reliance on 2017 building height data and (b) focus on a case study with limited LCZ variations—it provides valuable insights for land use and urban planners to promote liveable urban environments. It underscores the critical role that UVCs play in mitigating rising LSTs in rapidly urbanizing environments. By analysing the temporal evolution of UVCs from 2010 to 2017 in Colombo, Sri Lanka, it was found that the conversion of LCZs, particularly from compact low-rise (LCZ 3) to compact mid-rise (LCZ 2), significantly disrupted natural airflow, leading to the disappearance of key UVCs and exacerbating UHI effects. The findings highlight the urgent need for urban planners to integrate UVCs into broader urban design and land-use policies. The disappearance of UVCs between 2010 and 2017 reveals the vulnerability of these corridors to unchecked urban development and the critical importance of maintaining compensatory spaces like parks, water bodies and open areas to sustain urban airflow and temperature regulation.
To effectively combat the negative impacts of urban heat, this study advocates a holistic approach to urban planning that prioritizes the preservation and enhancement of UVCs. This involves implementing strategic land-use regulations that protect existing corridors and promote the creation of new ones in areas undergoing urbanization. Additionally, the results emphasize that addressing LST challenges requires more than just neighbourhood-level interventions; it demands a coordinated, citywide effort that incorporates UVCs into the urban fabric.
Future research should focus on developing precise, scalable models for UVC planning that can be adapted to various urban contexts. It can simulate building heights and various urban scenarios to identify the optimal combination of FAIs, building uses and their locations to maintain a thermally comfortable and sustainable urban environment. Moreover, long-term monitoring of UVCs will be essential to assess their effectiveness in mitigating urban heat and to inform adaptive urban planning practices. By prioritizing the protection and promotion of UVCs, cities can enhance their resilience to climate change, improve urban liveability and ensure sustainable development for the future.
Footnotes
Declaration of Conflicting Interests
The authors declared no potential conflicts of interest with respect to the research, authorship and/or publication of this article.
Funding
Authors acknowledge the support of the CAUL Consortium in enabling the open access publication of this article.