
Abstract
Economic and societal costs of the urban heat island are considered through the marginal effect of temperature increase on device efficiency and lifespan. Urbanization is virtually synonymous with the mechanization of human comfort systems, and the efficiency of these systems is subject to degradation from the urban heat island. The simplest way to model this degradation is an application of ideal device efficiencies, and the results of such an analysis are presented and considered in this paper. The magnitude of these costs and their avoidance or potential mitigation avenues are the principal topics of the work, and the technical underpinnings of the approach are presented in supplementary material available online. The self-reinforcing nature and economic scale of the urban heat island effect are thus approached from the first principles of thermodynamics and available data on relevant devices and systems. A global perspective on the phenomenon is presented, followed by a case study of the Phoenix, Arizona (US) metropolitan area to demonstrate the scale of these effects. This analysis synthesizes thermodynamic and economic approaches to the health and policy issues of the urban heat island, with particular consideration given to planning for minimization of these effects in low- and middle-income urban areas. This study first estimates the costs borne today by large urban centres, then highlights some of the risks that secondary cities will eventually face – and could potentially mitigate – as they undergo rapid growth and densification.

I. Introduction
The long-term trend of world urbanization has produced a dizzying array of products, services, information and specialization, and has generally tended to correlate with increased wealth and higher standards of living. Urbanization is not without its costs, however, as the urban space represents a considerable alteration from the natural landscape. While ecological, sociological, biological and psychological factors are all areas of major concern, this study seeks to employ basic thermodynamics to approach the economic cost of a thermal side effect of urbanization, the urban heat island.
Since Luke Howard(1) pioneered the geospatial mapping of urban temperatures in London, it has been recognized that a combination of thermal mass and albedo (surface reflection of radiation) effects contributes to elevated temperatures in urban areas, commonly dubbed “urban heat islands” (UHIs). These regions experience altered weather patterns(2) and demonstrate daily temperature profiles at variance with the surrounding rural or even suburban areas. The intensity of the urban heat island can be quantified by either of two closely related temperatures, the urban skin temperature (pavements and buildings) or the meteorological urban heat island (air temperature).(3) These temperatures are linked via heat exchange processes, and can affect public health,(4) horticulture, perception of comfort, and ultimately the economies of the affected regions. The effects of the heat island extend beyond persons to the buildings and machines that sustain the urban system. The present study considers effects of UHI-imposed performance degradation in cooling system efficiency, automobile engine efficiency, and device longevity. Bush et al.(5) considered the relative efficiency of different cooling systems under elevated ambient temperatures, whereas the present work contemplates the operating cost of degraded performance in cooling systems subject to UHI. Otanicar et al.(6) considered the emissions impacts of the urban heat island, and the present study considers the economic cost of UHI on vehicle efficiency through fuel consumption. Additionally, the replacement rate of electronic devices is accelerated when such devices are subjected to UHI excess temperatures, and it is important to consider how to assign a cost to this effect.
This study seeks to highlight the real, but hidden, costs imposed on an urbanized society by the urban heat island, and argue that an ounce of prevention is worth a pound of cure. No mitigation strategies relating to the UHI are pursued here; this task has been undertaken admirably by many researchers.(7) But the economic concerns raised herein could allow mitigation researchers to better define a positive economic impact of the proposed strategies, which is critical for policy discussions justifying the costs of modifications to buildings, machines and behaviour. The present work breaks ground in its synthesis of basic thermodynamics and economic estimations applied to the urban heat island, it may provide socioeconomic justification(8) for further research on mitigation strategies, and it chiefly seeks to guide planning and policy discussion of the heat island effect in regions where it has not yet become endemic, most notably in the booming cities of the low latitudes (which are warmer than high-latitude cities).
Nearly every facet of life is adversely affected by hot days being hotter. All refrigeration devices operate less efficiently, which has the twofold effect of forcing reduced efficiency and requiring higher energy loads, as the heat leaks into the refrigerator, the house and the office building faster with higher air temperatures. Virtually every electronic device is degraded by operating above ambient temperature, including fans and blowers. Human comfort and even health suffer as temperatures rise, especially among the most vulnerable and impoverished citizens. Even structures can suffer from thermal expansion cycles of greater magnitude than expected.
Section III presents the global scale of the urban heat island effect, along with preliminary global estimates of cost based on the thermodynamic analysis. This is followed by a demonstrative case study of the Phoenix, Arizona (USA) metropolitan area, representing a high-income urban environment, and highlights features and behaviours to be avoided. Discussion follows in Section V on the significant but under-appreciated drain the urban heat island represents on any economy. The online supplementary material details the methodology for assessing UHI economic effects in each of three areas: cooling efficiency, engine efficiency, and device longevity.
II. Concise Methodology
A brief description of the method employed will assist the reader in judging the validity and scope of the predictions and conclusions. The analysis proceeds from first principles of thermodynamics, observing that all processes convert a more useful form of energy into the desired output and less useful forms of energy, which is waste. Consider the air-conditioning (AC) unit: it converts electric power (more useful) to cooled air (the desired output) and warm air (the waste). Heat-pumping devices operate at higher efficiencies as the hot-side and the cold-side temperatures converge. If the hot-side temperature is raised, as in a heat island, the device requires more electricity to accomplish the same cooling. A similar law governs engines that convert heat into work, such as automobiles. In this case, however, the ideal situation is a large difference between the hot side (combustion products) and the cold side (ambient air) of the engine. In a heat island, the ambient air is warmer, and the engine less efficient. The relationships governing this behaviour are dictated by the Carnot efficiency of devices, which represents an idealized state. Real device efficiency is the product of this ideal Carnot efficiency and the mechanical efficiency of the device (encompassing friction, noise, and any other losses). The mechanical efficiency of the devices in question is assumed to be constant, and the effects considered in this work are driven by the change in the Carnot efficiency. The thermodynamics in question is globally applicable.
The device longevity discussion hangs on the Arrhenius law, which describes the temperature dependence of thermally driven stochastic (random) phenomena, such as chemical reactions, diffusion, and material creep (deformation). Many of these mechanisms are intimately related to device failure. Consider the simple example of a semiconductor junction, which depends on chemical doping agents to obtain the desired properties. As the temperature of the device rises, the diffusion rates mixing these doping agents increase exponentially. At some point, the doping agents are so intermingled that the device fails to function as required. The failure probability of a significant number of electrical devices is reasonably described in this way, and the analysis proceeds with the assumption that, specifically, air-conditioning units are subject to the same behaviour: hotter operating temperatures induce failure sooner.
The economic analysis requires baseline assumptions about the costs in question, and a scaling of these costs by a factor set by appropriate engineering analysis, population, and the intensity of the local UHI. The local variation in actual repair or utility costs is acknowledged, and variation is incorporated into this study by estimating the repair and utility costs using two values, where Phoenix data represent higher-income countries and Delhi data represent lower-and middle-income countries, as further explained in the supplementary material.
III. UHI: A Global Perspective
Urbanization is a global trend, with more than half of the world’s population living in urban areas in 2011. These urban areas account for approximately 75 per cent of world energy consumption(9) and as of 2011, the 600 largest urban areas accounted for 60 per cent of global economic output.(10) This trend is expected to continue, with more than 70 per cent of Earth’s human population projected to reside in urban areas by 2050; a significant portion of these will live in “mega cities” – metropolitan areas with populations over 10 million people.(11) This trend merits consideration, since high-income cities that are larger (by both population and geographical extent) generally have more intense urban heat island effects.(12) The world is projected to have 41 mega cities by 2030; secondary cities, additionally, should not be overlooked, since more than half of global urban growth is projected to occur in cities that currently have fewer than 1 million inhabitants.(13) Many of these rapidly growing cities lie in the tropics, and individuals and municipalities are faced with a choice: As the inhabitants adopt technology to improve quality of life, will the concomitant costs of urbanization, so entrenched in wealthy countries, follow along?
There is no reasonable expectation that the road to prosperity in these cities will follow the route taken by high-income cities. An opportunity is here afforded for the world to learn from past mistakes, and this paper begins to define the costs of those mistakes in thermodynamic terms. The urban heat island has extensive and ill-understood costs, which include elevated risk of morbidity.(14) It is all too easy to gloss over the personal tragedy of death with incremental probabilities and clinical terms, but it may be put simply and forcefully: the urban heat island can kill. Understanding and mitigating UHI can save lives. Responsible leaders will not evade these realities, but they will rightly wish to make a reasonable estimation of real costs. The brief global overview below considers a variety of cities and presents the results of the thermodynamic cost analysis detailed in the supplementary material.
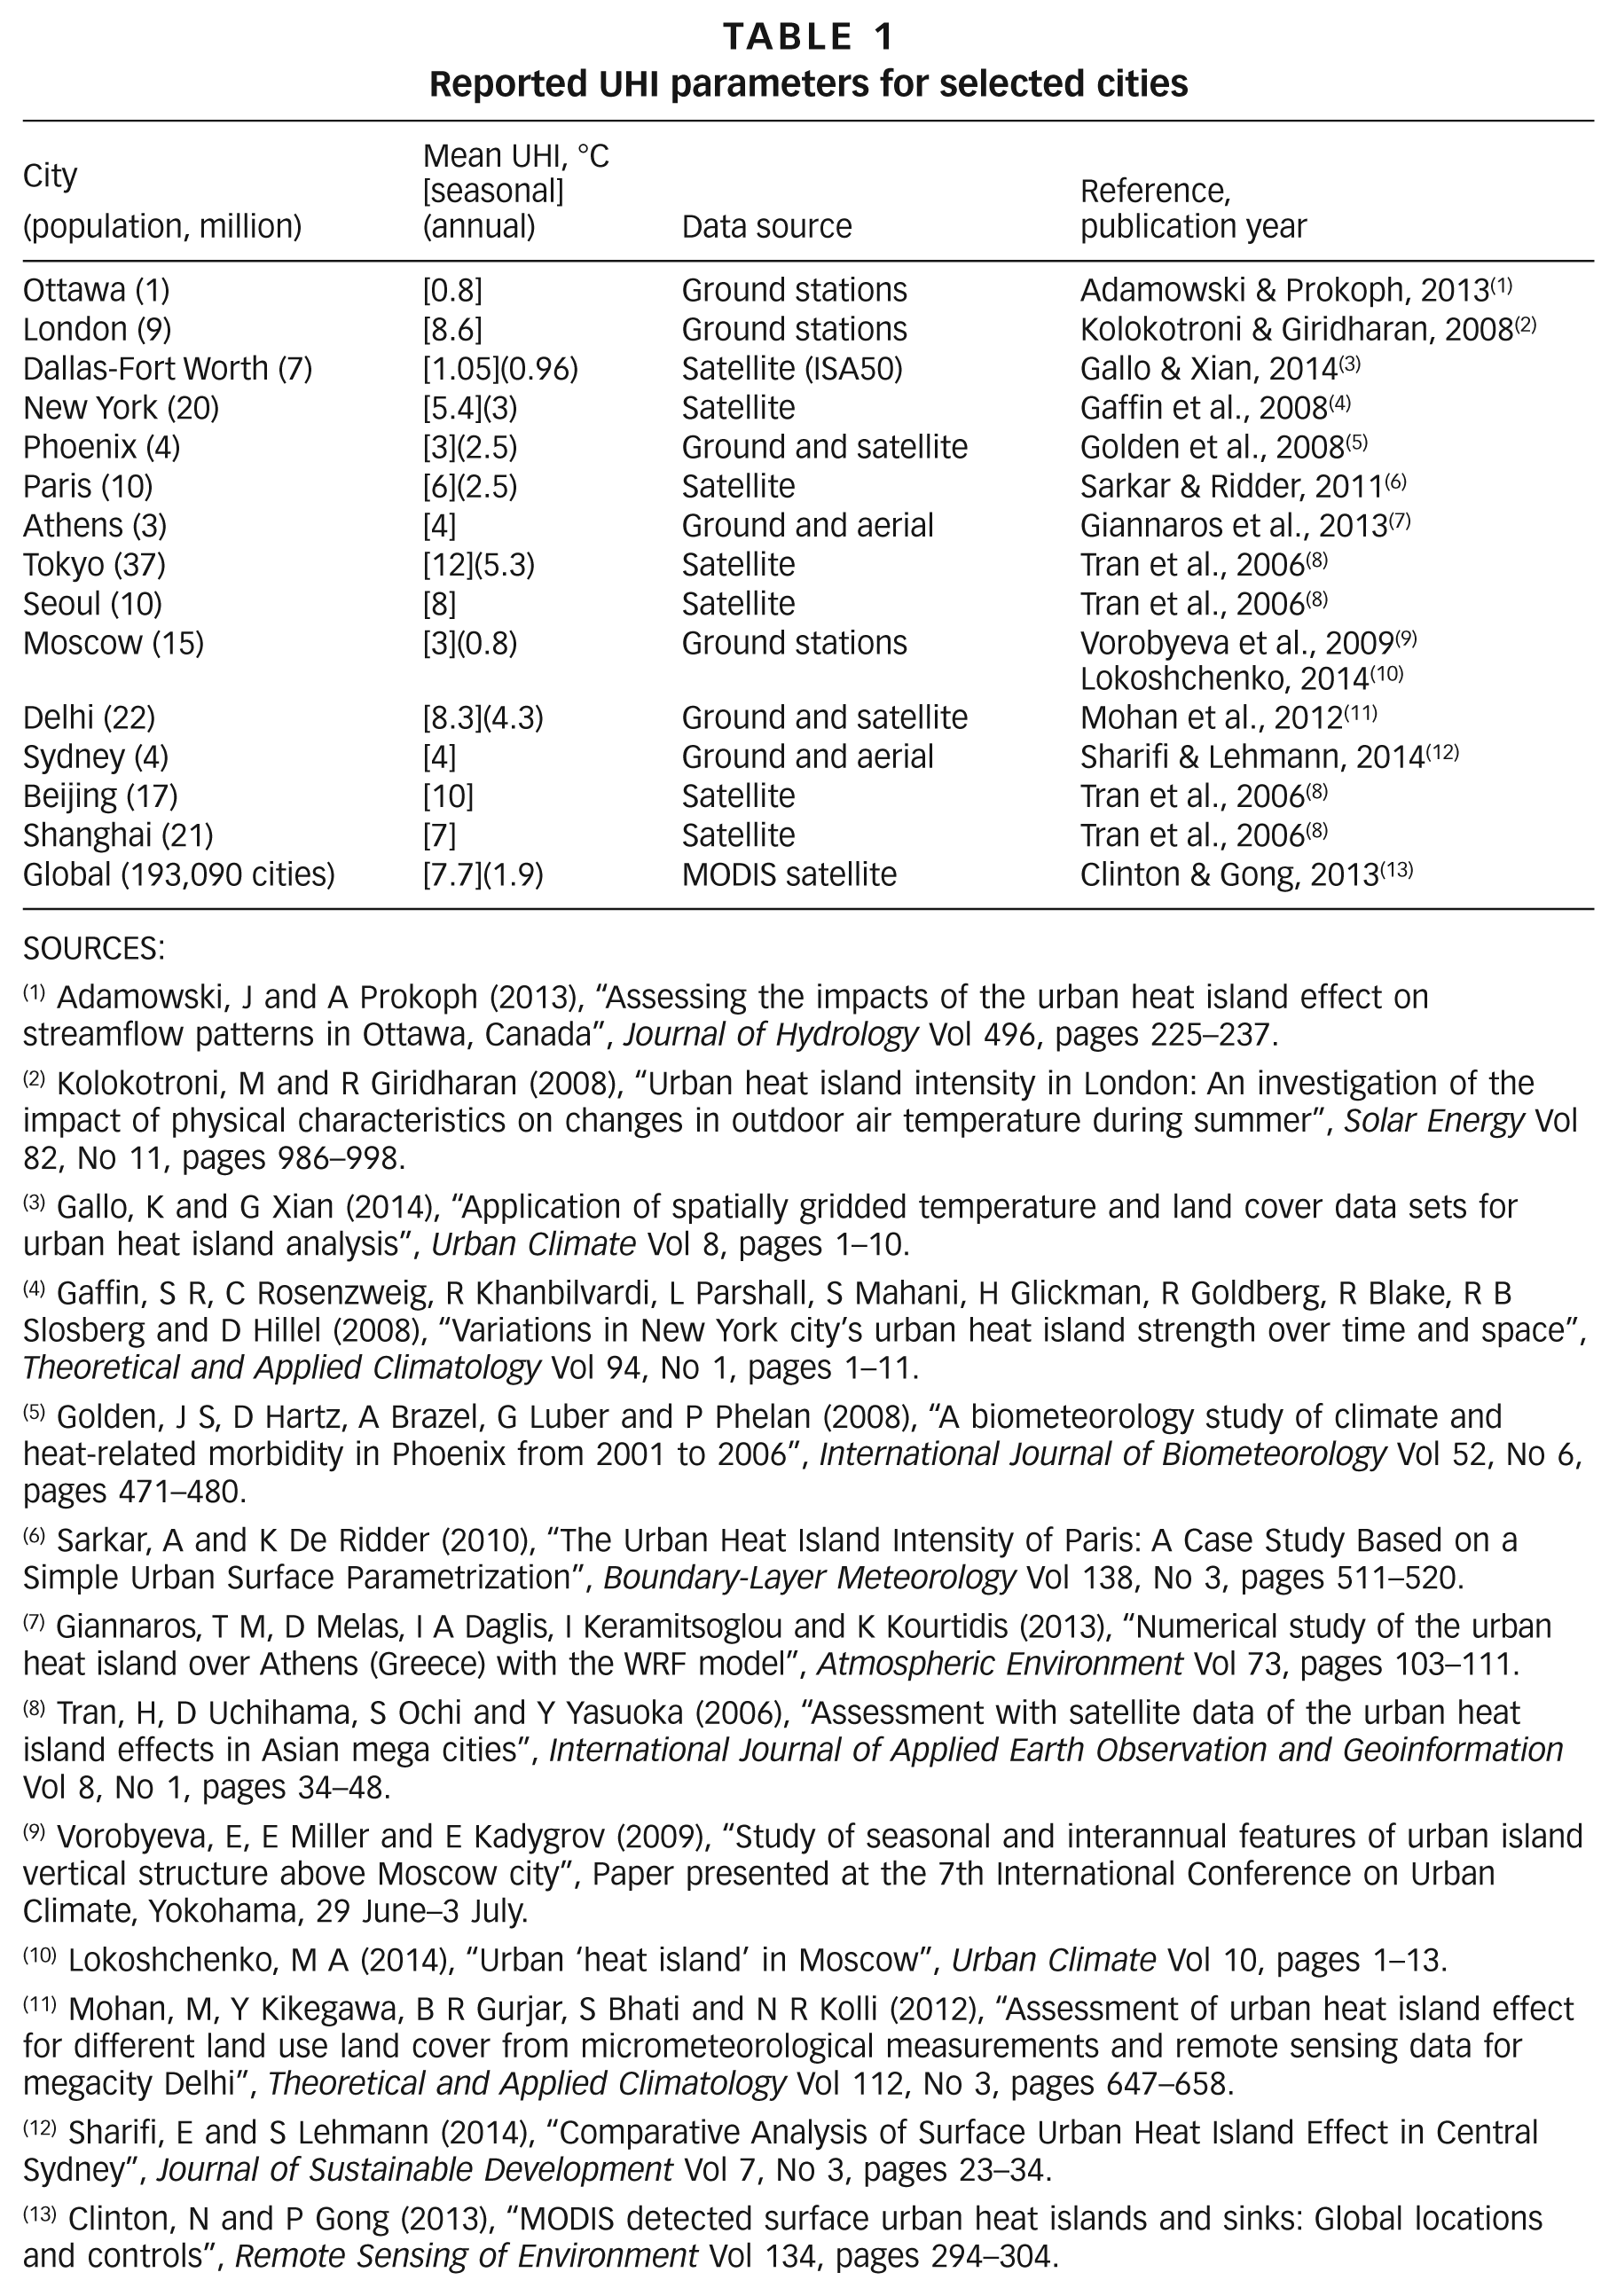
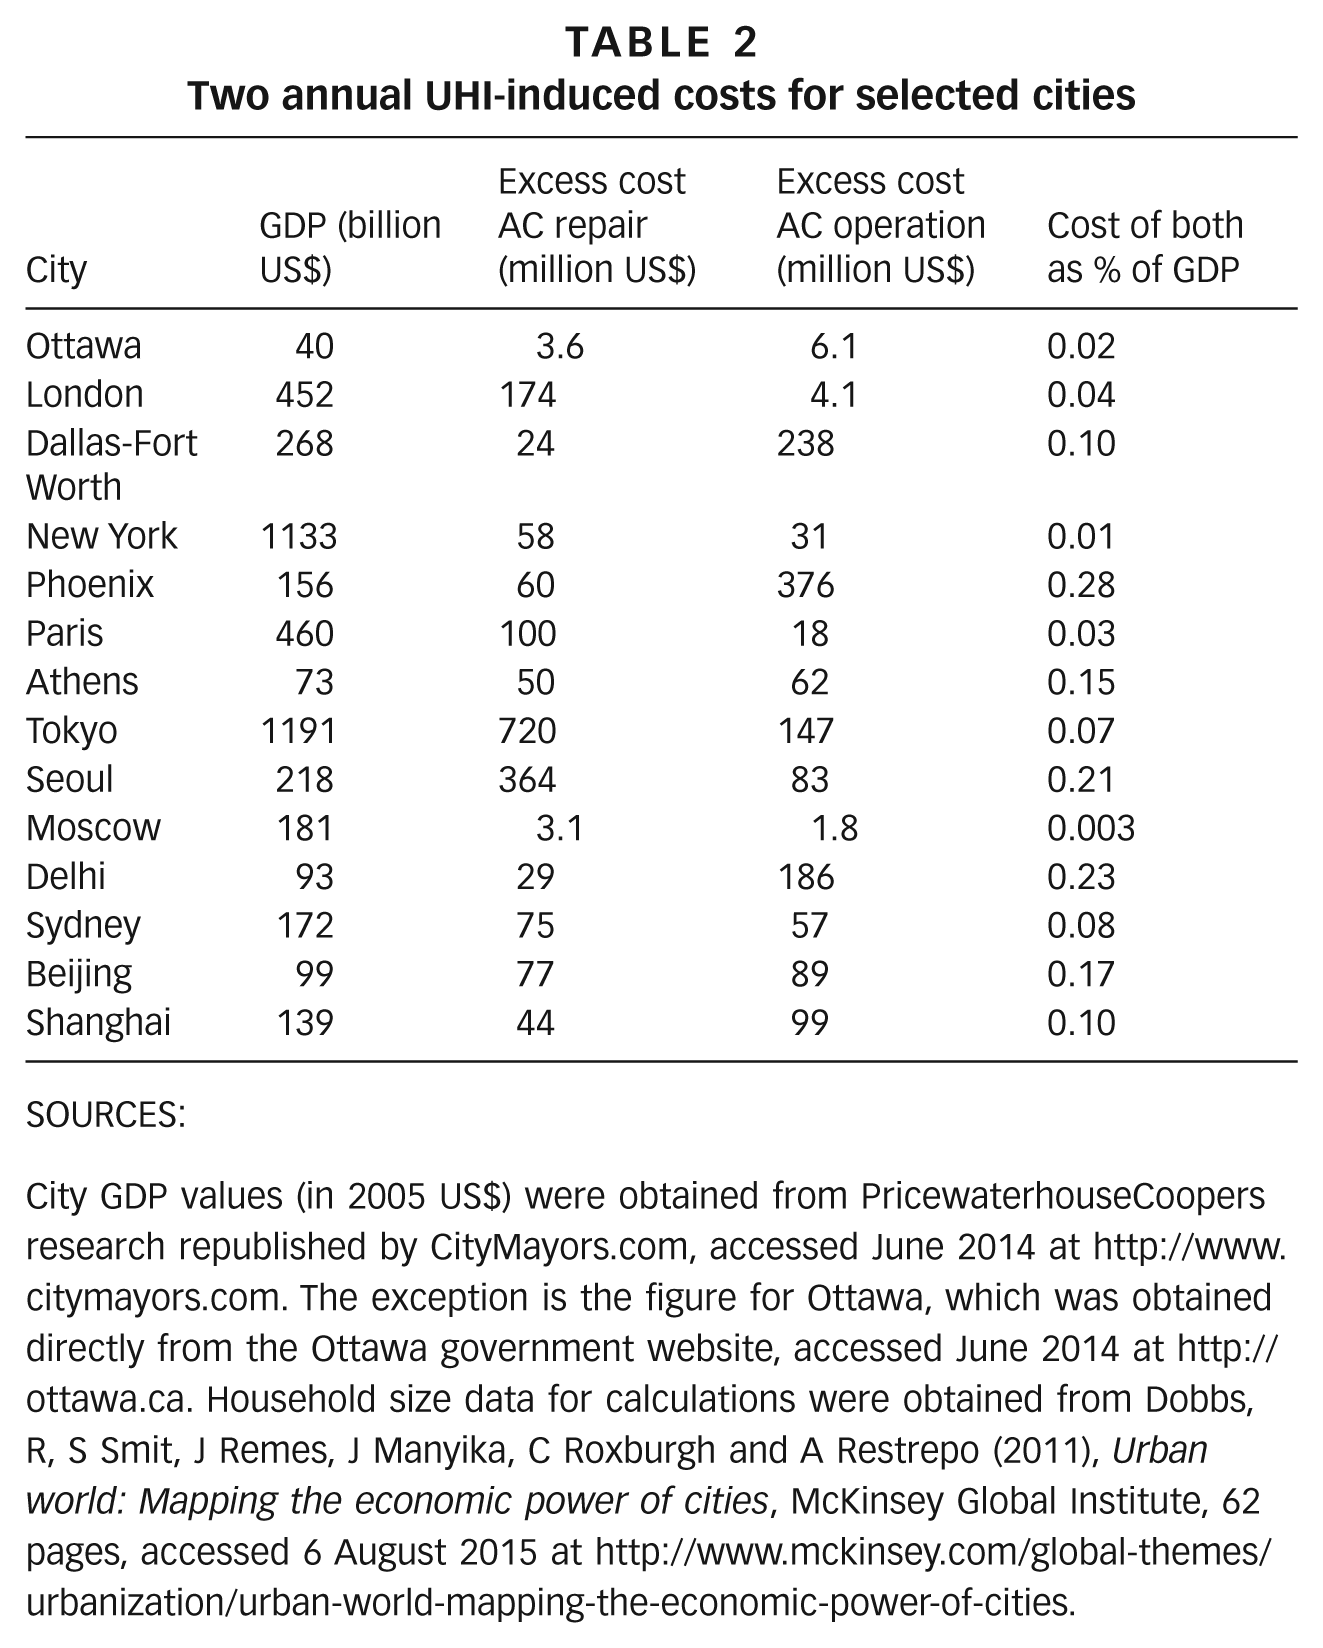
Cities experience a lesser or greater urban heat island effect, by day and season, depending on climate zone and proximity to bodies of water. Maximum variations in the urban temperature from the native rural-vegetated terrain can vary from being a negligible phenomenon (on a year-round basis) to temporary maximum variations nearing 20°C (in Tokyo).(15) Table 1 gives a summary of recent studies that have determined the mean seasonal and/or annual urban heat island intensity in major cities around the world. It should be noted that the studies reviewed here are based on a variety of techniques – including ground, aerial and satellite temperature measurements – and give a rough indication of the magnitude of UHI around the world. It should also be noted that many of the listed cities experience the urban heat island temperature excess on summer nights,(16) and that the regions in question vary substantially in the space- and time-frames considered. Table 2 lays out the estimated economic impact on each city considering both device longevity and operating cost, but restricting the inquiry to air-conditioning systems (see Section II and the supplement for further details of methodology). The device longevity costs are the most comparable, as they do not depend on dwelling size or ambient temperature, merely excess temperature and device repair or replacement cost.
Reported UHI parameters for selected cities
SOURCES:
Adamowski, J and A Prokoph (2013), “Assessing the impacts of the urban heat island effect on streamflow patterns in Ottawa, Canada”, Journal of Hydrology Vol 496, pages 225–237.
Kolokotroni, M and R Giridharan (2008), “Urban heat island intensity in London: An investigation of the impact of physical characteristics on changes in outdoor air temperature during summer”, Solar Energy Vol 82, No 11, pages 986–998.
Gallo, K and G Xian (2014), “Application of spatially gridded temperature and land cover data sets for urban heat island analysis”, Urban Climate Vol 8, pages 1–10.
Gaffin, S R, C Rosenzweig, R Khanbilvardi, L Parshall, S Mahani, H Glickman, R Goldberg, R Blake, R B Slosberg and D Hillel (2008), “Variations in New York city’s urban heat island strength over time and space”, Theoretical and Applied Climatology Vol 94, No 1, pages 1–11.
Golden, J S, D Hartz, A Brazel, G Luber and P Phelan (2008), “A biometeorology study of climate and heat-related morbidity in Phoenix from 2001 to 2006”, International Journal of Biometeorology Vol 52, No 6, pages 471–480.
Sarkar, A and K De Ridder (2010), “The Urban Heat Island Intensity of Paris: A Case Study Based on a Simple Urban Surface Parametrization”, Boundary-Layer Meteorology Vol 138, No 3, pages 511–520.
Giannaros, T M, D Melas, I A Daglis, I Keramitsoglou and K Kourtidis (2013), “Numerical study of the urban heat island over Athens (Greece) with the WRF model”, Atmospheric Environment Vol 73, pages 103–111.
Tran, H, D Uchihama, S Ochi and Y Yasuoka (2006), “Assessment with satellite data of the urban heat island effects in Asian mega cities”, International Journal of Applied Earth Observation and Geoinformation Vol 8, No 1, pages 34–48.
Vorobyeva, E, E Miller and E Kadygrov (2009), “Study of seasonal and interannual features of urban island vertical structure above Moscow city”, Paper presented at the 7th International Conference on Urban Climate, Yokohama, 29 June–3 July.
Lokoshchenko, M A (2014), “Urban ‘heat island’ in Moscow”, Urban Climate Vol 10, pages 1–13.
Mohan, M, Y Kikegawa, B R Gurjar, S Bhati and N R Kolli (2012), “Assessment of urban heat island effect for different land use land cover from micrometeorological measurements and remote sensing data for megacity Delhi”, Theoretical and Applied Climatology Vol 112, No 3, pages 647–658.
Sharifi, E and S Lehmann (2014), “Comparative Analysis of Surface Urban Heat Island Effect in Central Sydney”, Journal of Sustainable Development Vol 7, No 3, pages 23–34.
Clinton, N and P Gong (2013), “MODIS detected surface urban heat islands and sinks: Global locations and controls”, Remote Sensing of Environment Vol 134, pages 294–304.
Two annual UHI-induced costs for selected cities
SOURCES:
City GDP values (in 2005 US$) were obtained from PricewaterhouseCoopers research republished by CityMayors.com, accessed June 2014 at http://www.citymayors.com. The exception is the figure for Ottawa, which was obtained directly from the Ottawa government website, accessed June 2014 at http://ottawa.ca. Household size data for calculations were obtained from Dobbs, R, S Smit, J Remes, J Manyika, C Roxburgh and A Restrepo (2011), Urban world: Mapping the economic power of cities, McKinsey Global Institute, 62 pages, accessed 6 August 2015 at http://www.mckinsey.com/global-themes/urbanization/urban-world-mapping-the-economic-power-of-cities.
However, the operating costs can be estimated based on cooling degree days (days above 22°C) of the given city, scaled in electricity and repair cost, required cooling against ambient temperature, and population against a reference (Phoenix, AZ – see the supplement for detail). Air-conditioning use is substantial and growing in all countries, so the selection of the residential air-conditioning unit as the point of comparison is reasonable. The phenomenon of numerous, small, low-efficiency personal air conditioners, which can be seen in many buildings in many cities, represents an inefficient state that could be almost completely avoided if urban planning and construction employ effective mitigation strategies from the outset.
The annual cost of device repair or replacement is assumed to be close to US$ 119 in higher-income countries (based on Arizona), and close to US$ 10 in lower- to middle-income countries (based on Delhi),(17) with these country categories based on World Bank rankings. Repair cost is taken from the US average repair cost of a heating-ventilating-air-conditioning (HVAC) unit,(18) a 20-year lifespan, and an estimated four repairs per unit per lifespan (discussed further below). The factor of 12 is based on the ratio of semiskilled labour wages in Phoenix and Delhi.
While these assumptions will vary regionally and are not totally representative worldwide, we believe this approach captures the most salient points of the coupled economic-thermodynamic analysis. Operating cost is referenced against the 3°C (seasonal) heat island of Phoenix, Arizona, where average annual excess AC operating cost per household is predicted to be US$ 228, and there are 2,000 cooling degree days in the year.(19) A cost ratio of 3.54 is applied between higher-income and lower- to middle-income countries, based on residential AC energy consumption;(20) the supplementary material contains the details of this analysis.
It should be repeated that Table 2 contains UHI-driven economic impacts based on assumptions only of air-conditioning device longevity and on thermodynamic cycle efficiency. The damage imposed by the urban heat island will be greater than that encapsulated in Table 2 because of the wide variety of additional costs associated with UHI, and this will be explored further in the more detailed case study of Phoenix that follows.
The effects of the urban heat island must be soberly considered by cities in low- and middle-income nations seeking to better the quality of life and economic output of their residents. If every resident of Karachi, Mumbai, Lagos or São Paulo were to obtain a vehicle, a mechanically cooled residence, or personal communication and computing devices, as the authors of this paper undoubtedly expect and desire, let the municipal governments take heed: Will they have the economic output of a Tokyo, a New York, a Beijing? Perhaps, perhaps not, but unless care is taken in the management of these wonderful developments, they will certainly be faced with the attendant costs of the urban heat island.
IV. Case Study of Phoenix
The Phoenix metropolitan area is home to Arizona State University (in Tempe), where several of the authors live. The Phoenix metropolitan area is one of the largest desert cities in the United States, and developed relatively recently, with most of the population growth and building occurring since the year 1950. The region houses a nuclear reactor, and is therefore a net producer of electricity, but is generally dependent on non-native resource flows (especially water) for continued existence in its current urban-suburban-exurban model. The economy of Phoenix is diversified, including aerospace, healthcare, semiconductors, and a substantial service sector catering to the population of the region. The region sits at approximately 33.5°N latitude and 112°W longitude, in a low-altitude desert climate. The Phoenix area has been the subject of many studies, some of which provided inputs to the present work,(21) and its size and siting make it a good candidate for this analysis.
a. Results and commentary
Table 3 demonstrates the reduction parameter values for the coefficient of performance (COP) of a stationary air-conditioning unit (RCOP), for the total effect on automobiles (Rauto), and for the lifetime reduction of electronic devices (Rdevice) per 1°C outdoor temperature during June–September. The reduction parameters represent a multiplier of the worsening of the factors considered. They are averaged across all sunlit hours of every day of the summer months, and the average value for a full month is reported in the table. The annual cost of the urban heat island to Phoenix is estimated at US$ 479 million, based on the 3°C UHI magnitude estimate provided by Golden et al.(22) Excess cost from all sources is tabulated across the four summer months of interest in Table 3, in a per-degree format. Economic impact is measured as a percentage of regional (Greater Phoenix) GDP, using 2012 annual data from the Bureau of Economic Analysis,(23) and assuming each month contributes equally to annual GDP, which is a conservative assumption in Arizona’s seasonal economy, where percentage impacts in the summer months would be larger due to reduced tourism and service-sector activity in the hot season.
Reduction parameters and excess cost for Phoenix, AZ
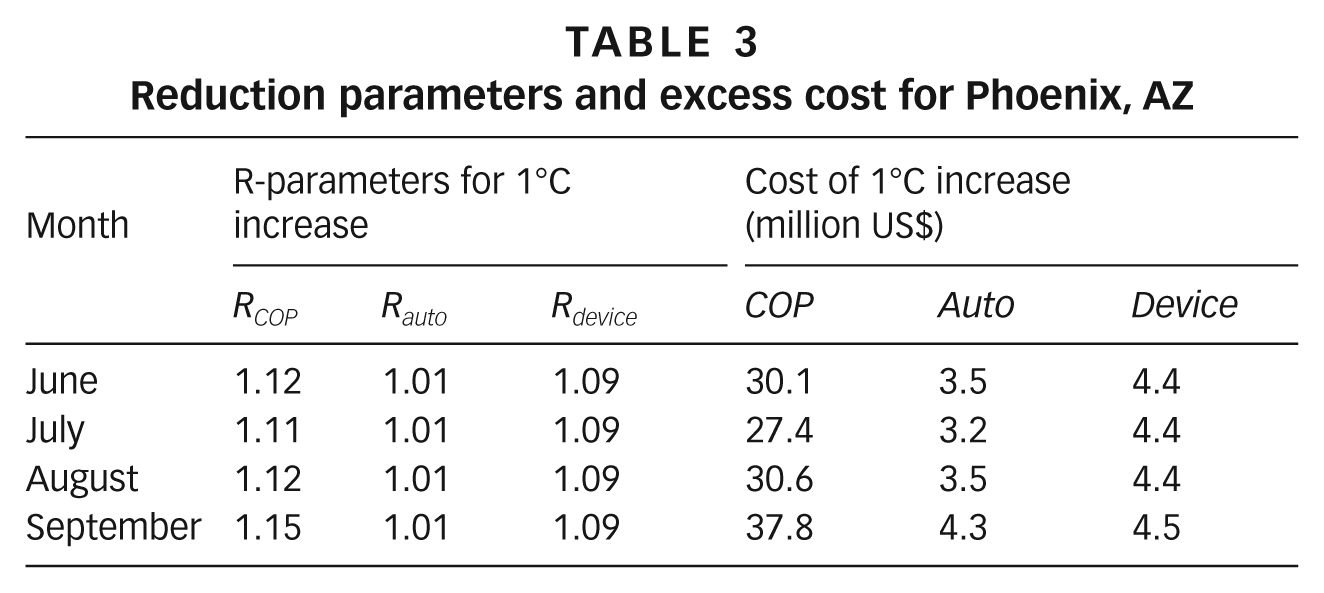
The relatively small effect on the automotive efficiency arises from the wide disparity between the ambient air temperature and the adiabatic flame temperature of octane (which represents the theoretical temperature of ideal combustion, and is not realized in practice); the adiabatic flame temperature is treated as the hot reservoir in the thermodynamic analysis, which is a conservative idealization. Automotive excess costs total US$ 43 million dollars in the 3°C increase, or approximately US$ 28.22 per working person per year, indicating that the urban heat island does not affect cars as significantly as it affects people. Although autos are a net contributor to the urban heat island due to paving demand and exhaust heat, and may impose substantial externalized social costs, they do not substantially change their operating costs because of the urban heat island effect.
However, automobile transport is one of the first technologies to be adopted in urbanization, and in lower-income nations the economic drain would likely be higher in percentage terms. The avoidance of single-occupant vehicle commuting cannot be overstressed as a mitigation strategy for the urban heat island when considered from either a macro- or microeconomic perspective, to say nothing of the possible impacts on the global climate. Air-conditioning units dominate the cost picture in this highly built-up but highly dispersed desert city, with emphasis laid on increased operating costs. Reduction in the coefficient of performance of an air-conditioning unit due to a 1°C increase in ambient temperature is estimated to cost each household approximately US$ 76/year, while the excess repair expense only costs each household approximately US$ 11/year. Bearing in mind that this analysis considers only these summer months and restricts device costs to AC units, these results are conservative and somewhat startling. Total excess costs imposed by AC systems operating in a 1°C urban heat island amount to an annual cost of US$ 126 million for Phoenix alone (based on working residents). This analysis estimates that the observed 3°C heat island in Phoenix siphons off 0.3 per cent of the US$ 156 billion local economy.
It should be emphasized that these costs are generally invisible to the consumer, being packaged into the usual repair and utility bills of everyday life. Though the inflated costs may be indistinguishable from what might be termed the natural cost of energy or repair, the urban heat island is a purely synthetic phenomenon, and it acts as an unintended urbanization tax on every resident, business, and municipal facility.
Phoenix is perhaps a flagship city for the low-density urban heat island, comprising much recent construction, extensive sprawl and paving, and many single-family residences. This American suburban model should be balanced against the other end of the housing density spectrum, where thermal mass effects can contribute to a substantial heat trapping and diminished nighttime cooling of the urban fabric. Certainly neither extreme is inherently good. While the abatement of the urban heat island via modification of the sky-viewing surfaces that make up the urban canopy, such as vegetation, roofs and pavement, may be more realizable in a lower-density setting, the incremental savings to individuals can appear small when weighed against initial costs, particularly in a city with high transience. A more dense urban fabric concentrates the stakeholders, and may make capital improvements such as highly reflective building elements more appealing. In any case, as the tropical regions of the world are typically home to those nations with great potential for economic growth, much care should be taken and attention paid to other cities that have experienced growth in a hot environment.
V. Discussion and Conclusions
The urban heat island is one of the most demonstrable instances of human alteration of a regional climate, and the external costs imposed on all the residents of a desert city such as Phoenix are substantial, to say nothing of the outsized damage imposed on affected cities in less affluent countries. A dramatic takeaway from Table 2 is the magnitude of the UHI damage done in India and China (though less significant than in Phoenix). The lower GDPs associated with these regions do likely indicate lower levels of capitalization, and consequently the device repair cost assumptions should be retooled locally for more precision. However, undercapitalization typically means higher repair costs, even if there are fewer devices to repair. Mechanization and capital accumulation are nearly synonymous with economic growth, and if this process is pursued heedlessly (as it has been too frequently in higher-income nations), a fundamental tax on all residents will be inevitably and virtually inescapably levied.
It should be emphasized that the value destroyed by the urban heat island effect is utter waste. There is no commensurate benefit associated with this cost; it is pure waste, inflicted on the residents of cities by the cumulative effects of personal and societal choices. This backdrop should be kept in mind as policy is crafted to address these issues: any reduction in the urban heat island benefits every resident directly, though almost invisibly. This consideration allows the cost of mitigation strategies to be more rationally weighed against aggregate benefits, and policy can be advertised with easily derived claims of dollars-per-person-per-year savings.
The highly variable and extremely local policies of American cities may not always produce long-term progress toward sustainable development. The case study of the Phoenix metropolitan area, for example, included at least 16 unique municipal governing bodies, each with the ability to affect the housing and land-use improvements of its residents. Below this scale, it is common in some regions to have neighbourhood-level governance of such features as house colour, roof type, or landscaping, thus restricting residents’ ability to optimize reflective surfaces or install solar energy-capture devices or rainwater catchment systems, and possibly even forcing residents to xeriscape, effectively eliminating shade and the evapotranspiration cooling effect provided by greenery. As nations make considered, long-term plans for economic growth, it must be understood that these plans should avoid the unintended consequences of urbanization, which act as a drain for everyone, forever.
Recently established cities have greater opportunity to shape urban growth and avoid intensifying the heat island effect, while long-established cities will likely work more incrementally towards adopting mitigation strategies. This paper considers some of the direct economic risks of UHI, and thus highlights the economic value of implementing mitigation strategies. There are many demonstrated strategies that reduce heat island effects on an urban scale, such as ground cover and roof albedo tuning, and it is hoped that the present investigation allows researchers to speak more firmly of dollar-denominated impacts of a proposed solution. Costs and benefits can be more clearly adduced by application of the analysis detailed in the supplementary material. Ultimately it is hoped that the novel synthesis proposed in this work will be applied to encourage sustainable urban-scale design and greenscape aimed at mitigation of the heat island throughout the infrastructure and anthrostructure that sustains our species.(24)
It will be noted, however, that planning for UHI may not be easy, even in the face of a sizable economic penalty. The Asian Cities Climate Change Resilience Network has put considerable effort into identifying ways in which resilience to climate change can be conceptualized and practised. It found that, aside from the necessary capital investment, this type of change requires complex coordination and an alignment of goals and incentives among the various stakeholders.(25) Even in well-resourced cities, planning and implementing climate change action based on large economic risks, such as several hundred billion US$ in anticipated damages in the case of extreme weather events in New York City, can prove difficult.(26) Cities with low per-capita income and rapid growth might find some of the mitigation strategies used in New York City too costly or time-consuming to replicate (e.g. restoration and/or construction of large vegetated regions within and surrounding the urban environment). To complicate matters, urban heat islands and other potentially associated weather events disproportionately affect the most vulnerable members of society, such as children,(27) who have the least power to create change in their cities.
In any society, choices at the level of the individual can accumulate on either side of the heat balance. Higher indoor thermostat settings, passive cooling, increased thermal mass in buildings, deliberate selection of building elements with high thermal mass,(28) and many other related strategies all tend to improve the energy footprint of a household; as each household becomes more conscious and careful, so will commercial spaces, and an aggregate reduction of entropy generation and waste heat streams of a metropolis may be seen. Since individuals regularly use coping or adaptation measures to respond to changes to their environment, the tendency is to reduce or avoid the hazard, reduce their vulnerability, and prepare to respond and recover from extreme or extended hazards.(29) In the case of UHI, the most likely strategy pursued by individuals would be to invest in more air-conditioning capacity, which will typically increase household energy consumption, exacerbating the issues. Fortunately, this self-reinforcing nature of the urban heat island also means that energy-use reduction and climatic adaptation are equally leveraged for the good. The externalization of the costs of the urban heat island makes it all too easy for individuals to ignore, but as cities fill up and heat up all the world over, it is hoped that this methodology may provide a tool for useful and necessary reflection.
Footnotes
Acknowledgements
Cassandra Jones gratefully acknowledges the Fulton Schools of Engineering Undergraduate Research Initiative for supporting this work. All authors gratefully acknowledge the extensive groundwork laid in this field by friends, collaborators and colleagues the world over.
1.
Howard, L (1818), The climate of London, deduced from meteorological observations made at different places in the neighborhood of the metropolis, W. Phillips, London, 38 pages.
2.
Golden, J S (2004), “The built environment induced urban heat island effect in rapidly urbanizing arid regions, a sustainable urban engineering complexity”, Environmental Sciences Vol 1, No 4, pages 321–349.
3.
Clinton, N and P Gong (2013), “MODIS detected surface urban heat islands and sinks: Global locations and controls”, Remote Sensing of Environment Vol 134, pages 294–304.
4.
Golden, J S, D Hartz, A Brazel, G Luber and P Phelan (2008), “A biometeorology study of climate and heat-related morbidity in Phoenix from 2001 to 2006”, International Journal of Biometeorology Vol 52, No 6, pages 471–480; also Silva, H R, P E Phelan and J S Golden (2010), “Modeling effects of urban heat island mitigation strategies on heat-related morbidity: a case study for Phoenix, Arizona, USA”, International Journal of Biometeorology Vol 54, No 1, pages 13–22; and Wong, K, A Paddon and A Jimenez (2013), “Review of world urban heat islands: Many linked to increased mortality”, Journal of Energy Resources Technology Vol 135, No 2.
5.
Bush, J, J Miller, L Kirkeide, B Xing R Domitrovic and A Amarnath (2013), “Field study of the energy savings potential of high-SEER air conditioning in the hot-dry climate”, ASHRAE Transactions Vol 119, No 1.
6.
Otanicar, T P, J D Carlson, J S Golden, K E Kaloush and P E Phelan (2010), “Impact of the urban heat island on light duty vehicle emissions for the Phoenix, AZ area”, International Journal of Sustainable Transportation Vol 4, No 1, pages 1–13.
7.
Golany, G (1982), Desert planning: international lessons, Architectural Press, London, 164 pages; also Corburn, J (2009), “Cities, climate change and urban heat island mitigation: Localising global environmental science”, Urban Studies Vol 46, No 2, pages 413–427; Solecki, W D, C Rosenzweig, L Parshall, G Pope, M Clarck, J Cox and M Wiencke (2005), “Mitigation of the heat island effect in urban New Jersey”, Global Environmental Change Part B: Environmental Hazards Vol 6, No 1, pages 39–49; Memon, R A, D Y C Leung and L Chunho (2008), “A review on the generation, determination and mitigation of urban heat island”, Journal of Environmental Sciences Vol 20, No 1, pages 120–128; Gui, J, P E Phelan, K E Kaloush and J S Golden (2007), “Impact of pavement thermophysical properties on surface temperatures”, Journal of Materials in Civil Engineering Vol 19, No 8, pages 683–690; and Bretz, S, H Akbari and A Rosenfeld (1998), “Practical issues for using solar-reflective materials to mitigate urban heat islands”, Atmospheric Environment Vol 32, No 1, pages 95–101.
8.
Taylor, R A, P E Phelan, T Otanicar, R S Prasher and B E Phelan (2012), “Socioeconomic impacts of heat transfer research”, International Communications in Heat and Mass Transfer Vol 39, No 10, pages 1467–1473.
9.
Bretzke, W-R (2013), “Global urbanization: a major challenge for logistics”, Logistics Research Vol 6, No 2, pages 57–62.
10.
Dobbs, R, S Smit, J Remes, J Manyika, C Roxburgh and A Restrepo (2011), Urban world: Mapping the economic power of cities, McKinsey Global Institute, 62 pages, accessed 6 August 2015 at ![]() .
.
11.
See reference 9.
12.
Tran, H, D Uchihama, S Ochi and Y Yasuoka (2006), “Assessment with satellite data of the urban heat island effects in Asian mega cities”, International Journal of Applied Earth Observation and Geoinformation Vol 8, No 1, pages 34–48.
14.
See reference 4, all works.
15.
See reference 12.
16.
See reference 3.
17.
Estimates based on data from the Government of the National Capital Territory of Delhi, Labour Department, accessed 6 October 2015 at http://www.delhi.gov.in; and wage data made available by the Industrial Commission of Arizona, accessed 6 October 2015 at ![]() .
.
19.
Cooling degree day estimates are generated using BizEEE software, available at ![]() . Cooling degree days are a measure of the energy required to render outdoor air serviceable for indoor use, and reflect both temperature and humidity. They represent a cooling load over time, so that a climate with fewer very hot and dry days could add up to a comparable degree-day value as a climate with many warm and humid days (e.g., Phoenix and Dallas). The excess cooling is the cooling load imposed by the urban heat island temperature excess; that is, without UHI, there is no excess cooling required, simply the baseline cooling for that city.
. Cooling degree days are a measure of the energy required to render outdoor air serviceable for indoor use, and reflect both temperature and humidity. They represent a cooling load over time, so that a climate with fewer very hot and dry days could add up to a comparable degree-day value as a climate with many warm and humid days (e.g., Phoenix and Dallas). The excess cooling is the cooling load imposed by the urban heat island temperature excess; that is, without UHI, there is no excess cooling required, simply the baseline cooling for that city.
20.
Estimated from the US Department of Transportation, Research and Innovative Technology Administration, accessed July 2014 at http://www.rita.dot.gov. Also USAID (2014), HVAC Market Assessment and Transformation Approach for India, 142 pages, accessed 6 October 2015 at ![]() .
.
21.
See references 2; 4, Golden et al. (2008); 4, Silva et al. (2010); 6; and 7, ![]() .
.
23.
See reference 13.
24.
For an explanation of the term “anthrostructure”, see Kitt Chappell, Sally A (2007), Chicago’s Urban Nature: A Guide to the City’s Architecture + Landscape, University of Chicago Press, 300 pages.
25.
Brown, A, A Dayal and C Rumbaitis del Rio (2012), “From practice to theory: emerging lessons from Asia for building urban climate change resilience”, Environment and Urbanization Vol 24, No 2, pages 531–556.
26.
Solecki, W D (2012), “Urban environmental challenges and climate change action in New York City”, Environment and Urbanization Vol 24, No 2, pages 557–573.
27.
Bartlett, S (2008), “Climate change and urban children: impacts and implications for adaptation in low- and middle-income countries”, Environment and Urbanization Vol 20, No 2, pages 501–519.
28.
Taylor, R A and M J Miner (2014), “A metric for characterizing the effectiveness of thermal mass in building materials”, Applied Energy Vol 128, No 1, pages 156–163.
29.
Wamsler, C and E Brink (2014), “Moving beyond short-term coping and adaptation”, Environment and Urbanization Vol 26, No 1, pages 86–111.
References
Supplementary Material
Please find the following supplemental material available below.
For Open Access articles published under a Creative Commons License, all supplemental material carries the same license as the article it is associated with.
For non-Open Access articles published, all supplemental material carries a non-exclusive license, and permission requests for re-use of supplemental material or any part of supplemental material shall be sent directly to the copyright owner as specified in the copyright notice associated with the article.