
Abstract
Cities in India cannot be contained by arbitrarily delimiting their boundaries. The delineation of a master plan boundary, formally known as urban growth boundary (UGB) of Indian cities, is utterly flawed not only because of the arbitrariness with which UGBs are delineated but also because of the utter discounting of the tenets of the draft National Land Utilisation Policy, which specifies functions of land serving the needs of people, the environment and different sectors of the city’s economy. The indiscriminate urban sprawl has only resulted in the loss of high-quality agricultural land and open spaces besides disturbing the ecosystems. It is not tenable that land prices necessarily rise within the city owing to the UGB, as it is plausible to have comparable growth on both sides of the UGB if they have the same level of services at the same price. This article examines the debate around UGB and undertakes an empirical exercise to objectively delineate it for an Indian city through different urban footprints to prevent the arbitrary urban sprawl that is occurring. The approach followed in this article is applicable to any city across the geographies.
Background: City Plan Making in India
Cities in India cannot be contained by arbitrarily delimiting their boundaries. Unabated urban sprawl presents an unprecedented challenge to India’s process of urbanization. The relevance of size while delineating the urban growth boundaries (UGB) of Indian cities always gets undermined despite each city’s uniqueness in terms of its economy, ecology and environment. The detrimental fallout of such arbitrary delimitation of UGBs only becomes evident when translated into local impacts, such as the depletion of open spaces and water bodies, water and air pollution, traffic congestion, noise, social unrest, urban public health problems, power outage, flash floods, scarcity of water, non-availability of land for municipal waste and sewage disposal, dearth of housing, etc. Therefore, in order to arrest the unsustainable low-density urban sprawl that occurs, delineation of the UGB with the minimum spatial spread is a prerequisite for sustainable habitat development.
The UGB for an Indian city is statutorily delineated by its master/development plan for promoting, regulating and monitoring its spatial growth. However, for a city not having a master plan, the municipal boundary acts as the UGB. Indian cities enjoy unfettered freedom to grow indiscriminately until their growth gets regulated through a statute-backed master plan. City master plans in India are prepared by the Directorate of Town and Country Planning of respective state governments and, in some instances, by the municipality or development authority of the respective city under a state statute, titled Town and Country Planning Act, which is, therefore, a statutory document, violation of which invites different types of penal provisions. The enforcement of the master plan within the municipal areas rests with the respective municipalities with the prior permission of Town and Country Planning Directorate of the respective state governments. Likewise, the enforcement of the master plan beyond the municipal area (but within the master plan area) rests with the respective panchayats/statutory towns with the prior permission of the Town and Country Planning Directorate of the respective state governments.
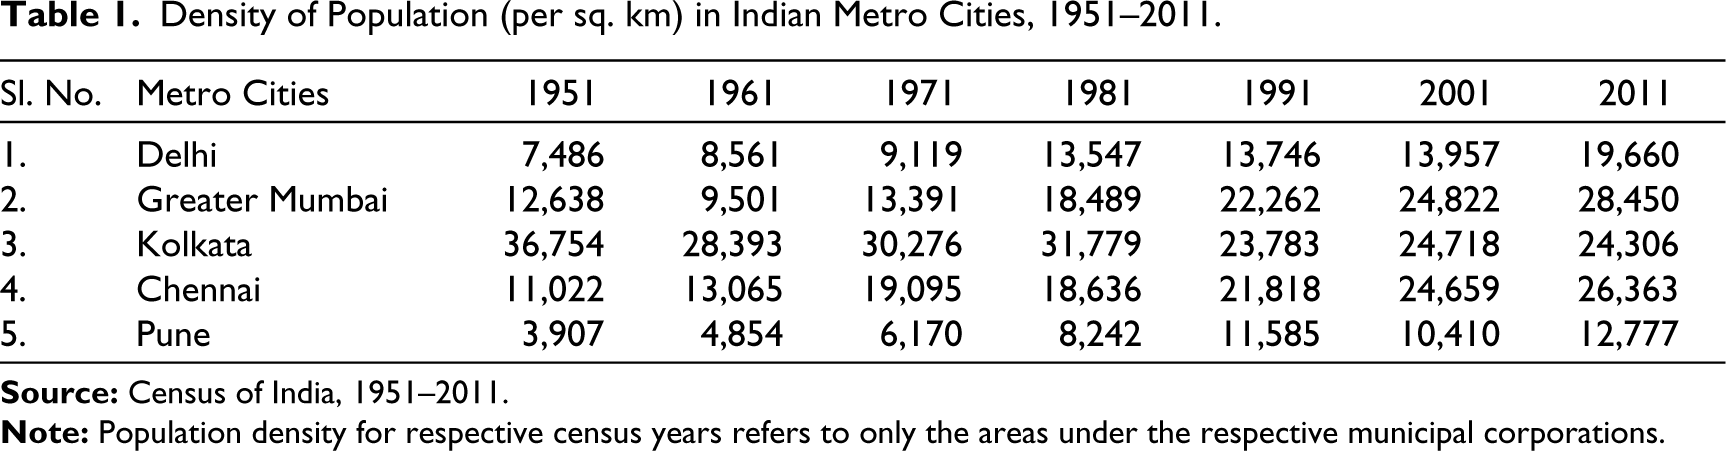
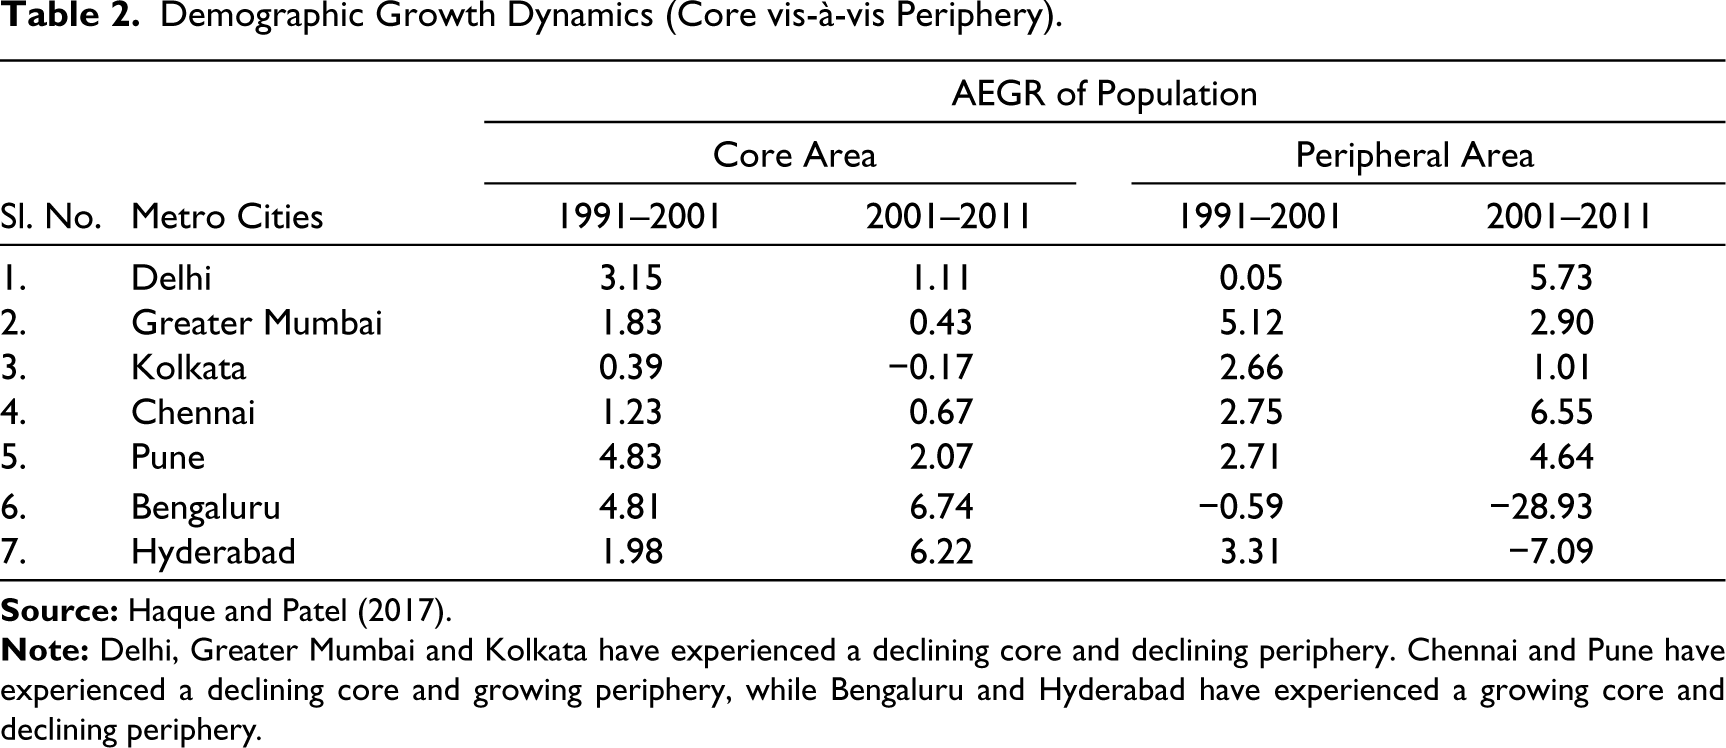
The master plan requires an envisioning process by assessing the ground realities and weighing different sustainable options to guide the spatio-economic development of an urban settlement within the constraints of demography, physiography, sociology, economy and finance. It is a continuous process and leaves room for periodic evaluation. However, the exercise in the preparation and/or revision of the master plan in Indian cities is typically flawed as it delineates/re-delineates the UGB of the city arbitrarily. Such an exercise incorporates the peri-urban areas and fringe area villages into the urban fold of the city without any objective assessment of the environmental and economic exigencies. Such arbitrary urban expansion may be called the urban engulfing of the rural hinterland or a disastrous urban spatial inferno in the serene countryside. The exercise of master plan preparation in Indian cities hardly takes into consideration the Urban and Regional Development Plans Formulation and Implementation Guidelines (URDPFI; Government of India, 2015), which recommends transport network, drainage network, density distribution and disaster proofing while delineating the city. The process is further worsened as the federating states of the Union of India do not have a state land utilization policy. Sadly enough, the delineation of a master plan boundary in Indian cities does not refer to the draft National Land Utilisation Policy of the government (2013) which recommends the consideration of (i) urban economy, (ii) natural resources, (iii) regional setting, (iv) developmental history, (v) rural–urban continuum and (vi) potential for decentralization of activities while delineating the city. The most enigmatic part of the exercise is the periodic upward delimitation of urbanizable limits without defining the meaning of ‘urbanizable limit’. Since the incorporation of peri-urban areas into the city is not spherical, it should ideally be determined by the environmental, physical and economic exigencies of the concerned city. Unabated urban expansion only alters the distance of the peri-urban limits indiscriminately. Not only does such an arbitrary urban spatial extension ignore the trinity of location, site and situation (the determinants of spatio-functional size of a city), it also does not take into account the geo-historic entity of every parcel of land before its incorporation under the urban fold (Maringanti, 2016). Since the urban spread is determined by the growth of and around a pre-urban nucleus, the zone of influence of a city at different levels in the urban hierarchy can be determined by its distinctive characteristics, namely (i) area served by the city’s services and amenities like water, electricity, gas etc.; (ii) flow of freight and passenger traffic; (iii) ratio of non-agricultural to agricultural land use; (iv) economic and population density and (v) growth of built-up areas (Government of India, 2015). Since peri-urban areas are often not regulated under any development control regime, their incorporation into the city’s fold only adds to the city’s woes. The argument to delimit the UGB periodically through a master plan in order to accommodate more people and concomitant built-up areas is not tenable as the density of Indian cities has not increased significantly in between the intercensal periods (Table 1), with five metro cities out of seven witnessing declining population in the periphery (Table 2). Although a decade-on-decade comparison of the density of Indian cities could not be made with that of other Asian cities, recent data show that even Dhaka, Jakarta, Manila and several other Asian cities have a much higher density.
Density of Population (per sq. km) in Indian Metro Cities, 1951–2011.
Demographic Growth Dynamics (Core vis-à-vis Periphery).
In complying with the recommendations of the National Urbanisation Commission regarding low-rise and high-density development for harnessing energy and cost efficiency for the city with reduced travel demand, the National Sustainable Habitat Mission (NSHM) (Government of India, 2010) suggested: (i) ecologically sensitive urban planning, (ii) demarcation of eco-sensitive areas in the city as low and/or no built-up areas and (iii) adherence to climate-resilient urban development based on environmental parameters such as conservation of natural ecosystems and natural drainage patterns. Thus, following the above-mentioned guidelines, urban planners across India should delineate the UGB by projecting various urban footprints.
The Debate: Restricting the City Within Its UGB
UGB is defined as an officially adopted and mapped line that separates a city from its surrounding countryside, farmland, wetlands, watersheds and forest with an intent to restrict the spatial extension of the city within its planned precincts (Sayer, 1997). UGB (also known as the green belt) is proposed to (i) prevent the outward growth of the city; (ii) preserve the countryside for agriculture, wildlife and recreation; (iii) pre-empt the merger of two or more cities to form one huge urban area and (iv) protect the carbon sink of the city. Restricting the spatial spread of the city through UGB has both its advocates and opponents. There is no unique definition of urban sprawl and its measurement (Ewing et al., 2002). The opponents of UGB often cite higher land prices in the city core, lower land prices and resultant densification along the periphery, lower affordability to access houses and other services by the urban poor in the city core, and the declining competitiveness of the city. They hold that UGB is used to stop urban sprawl without having any inherent ecological or agricultural exigency. They further argue that cities, in any case, grow beyond their UGB by creating a commuter belt and widen the social inequality by acting as a wall that locks up the urbanites at increasingly higher densities, turning homes into investment assets instead of places to live in. Besides creating huge housing crises, the UGB restricts land supply and raises land and house prices, thereby making housing unaffordable for a vast majority who are forced to take long commutes. Venkataraman (2014) observes the failure of UGB to contain the spatial spread of the city of Bengaluru and finds out how UGB and the distance factors affect land prices both within and outside the UGB. She rejects the null hypothesis only to establish that there is no significant land value gradient just within and just outside the UGB, when adjusted for the conversion charges of land falling beyond the boundary. Using an inventory approach to land management, Knaap and Hopkins (2001) argue that UGB is not expected to be static and needs to be re-delineated on a continuous basis according to the availability and price of vacant, under-utilized, re-developable and non-developable land and desirable density, considering the relative price differential of land inside and outside the UGB. Although Arnott (1979) and Pines and Sadka (1985) hold that UGB is the second-best option to congestion pricing in a monocentric city, Anas and Rhee (2006) argue that since all cities are polycentric in nature with high cross-commuting across multiple nodes, sprawl should be allowed to reduce aggregate travel costs. While Knaap (1985) observes a significant increase in land prices within the city owing to UGB, Phillips and Goodstein (2000) observe a marked price differential on either side of the boundary and attribute it to the different levels of services provided on each side. However, the marked price differential on either side of the UGB is not necessarily obvious since it is quite possible to have comparable growth on both sides having the same level of services at the same price, provided the demand for and supply of land is equal. The criticism of UGB opponents with regard to the scarcity of land and the concomitant rising land prices can be responded to through (i) the best utilization of suitable derelict (brownfield) sites in order to prevent the shift of economic activity to the countryside; (ii) infilling of the huge areas of various buildings clustered and scattered around the city; (iii) putting into use a large number of vacant houses as revealed by the Census of India.
Downs (2002) holds that although a stringent UGB may lead to upward pressure on house prices in the short run when housing demand is high, it need not result in a long-run increase in prices in comparably growing cities. Jun (2006) also observes that as developers optimize on land use, UGB does not necessarily lead to any price rise. Outside the UGB, the price of land should only be equal to its agricultural returns along with the transportation costs to the nearest (urban) trade centre. Also, Knaap and Hopkins (2001) admit that UGB can well be effective as a containment strategy if the accuracy of the projections of land requirement and the enforcement of UGB can be ensured. Likewise, Venkataraman (2014) also attributes the failure of UGB to its weak enactment with various levels of subversion during enforcement nurtured under the political economy. Thus, it is seen that even the critics of UGB acknowledge its indispensability.
Obviousness of the Birth of New Cities: The New Economic Geography
If the birth of a new city is obvious as established by the New Economic Geography and Geographical Economics, should an existing city not be bound within its UGB in order to pave the way for the birth of new cities? Although neither theory examines nor delineates UGB, both theories underscore the expediency and exigency of UGB implicitly. Krugman (1991) argues that the spatial structure of the economy is dictated by two opposing forces: (a) forces of agglomeration (centripetal forces facilitating geographical concentration) and (b) forces of dispersion (centrifugal forces facilitating dispersal of economic activities). He asserts that despite the evidential geographic concentration of many economic activities across the countries world over, neither do all people live in one big city, nor does the production of particular items be concentrated in a single city. Concentrations of economic activities raise the demand for local land and the consequent rise in land rents, thereby disincentivizing further concentration due to external diseconomies such as congestion. Krugman (1998) finds land rents (a centrifugal force) posing a tricky question as to why does an immense conurbation not emerge in which the suburban areas of each city merge with the next contiguous ones. Krugman calls it the ‘infinite Los Angeles problem’.
Fujita and Mori (2005) also hold that the spatial organization of economic activities is the outcome of a process involving the two opposing forces of agglomeration and dispersion. Individuals flock together in order to reap the advantages of the division of labour, but various difficulties limit the getting together of many individuals. They further hold that cities (or economic agglomerations) are the focal institutions where both social and technological innovations are nurtured through market and non-market interactions. Subsequently, they argue that the interaction between these two opposing forces is critically influenced by transport costs on the spatial structure of the economy which, however, are drastically different depending on the nature of underlying agglomeration and dispersion forces. Although congestion and factor price pull are the effective dispersion forces, they are different qualitatively. While the former assumes the form of a megalopolis with two distinctively large masses of industrial agglomerations connected by an industrial belt, the latter takes the form of urban sprawl without generating any typical industrial agglomeration point (Fujita & Mori, 2005). Fujita and Krugman (1995) offer a potential function, Ω(x) for a monopolar city as follows:
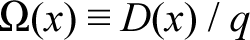
where D(x) represents the total potential demand for the product of a certain firm from the entire economy and q is the (zero-profit) equilibrium output of the firm. They argue that no new city is viable at any location x such that Ω(x) < 1. They further argue that although a single city, surrounded by an agricultural area may exist when varieties are differentiated enough, transportation costs are low and the population of workers is not too large, more than one city may emerge if varieties are close substitutes and/or the population is sufficiently large, since an individual producer then has an incentive to locate far away from the city to sell a larger output to local consumers.
Fujita and Mori (1997) observe that starting from one city, population growth leads to a larger agricultural area. They argue that beyond some threshold, the agglomeration of industrial firms within a single city is no longer in equilibrium since some firms along with industrial workers would leave the existing city to form new firms in a new city in the agricultural area, together with some agricultural workers alongside in order to be in equilibrium. Thus, a new city comes into being. Fujita and Thisse (1996) argue that multiple equilibria spatial configurations occur when α / th is large where α is the distance decay effect and th is the unit commuting cost. They argue that agglomeration of economic activities at a particular location does not only depend on the intrinsic features of that location; history too dictates it, as minor changes in the socio-economic milieu occurring at crucial periods in the history of that area may lead to entirely different geographical configurations. They further maintain that a rise in population opens more options for producers, labourers and consumers, bringing forth a higher return to scale and a higher level of welfare. However, any rise in population is likely to increase the transportation and congestion costs, thereby nullifying the benefits. Therefore, beyond some threshold, firms, consumers and workers have an incentive to form a new city. Fujita and Mori (1997) also hold that new cities are likely to emerge when the population is large enough to propel a more dispersed pattern of economic activities, as firms are keen to locate in rural areas where transportation costs and wages are lower, but real wages are higher because the prices of agricultural goods are lower and prices of manufactured goods are the same as that of cities.
Abdel-Rahman and Fujita (1990) developed an aggregate production function of the city, considering a final goods industry and an intermediate goods industry, where the latter supplies a large variety of specialized services (legal, financial, advertising, etc.) to the former:
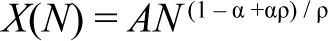
where N is the labour force in the city, A is a constant depending on the parameters of the model, ρ is the degree of substitution between the differentiated varieties of intermediate goods in the production of a final good and α is the output elasticities of the labour force (returns to scale) engaged in a final goods industry. In the aggregate, production in the final goods sector exhibits increasing returns in the labour force (the exponent of N being larger than one). Nevertheless, increasing N leads to an expansion of the residential area, which results in higher land rents and transport costs. Thus, in equilibrium, the city achieves a finite size. Based on the assumptions of monocentric and circular cities, Abdel-Rahman and Alex (2004) hold the time cost of commuting a unit distance in both directions (round trip) as t, an exogenous constant, and argue that if the consumer’s residential location is r miles from the CBD, then his labour supply is H(r) = 1 – tr. He uses N to denote the number of consumers/labourers residing in the city and r to denote the radius of the city to show that since residential land sizes are uniformly equal to one, r = √ N / π. The maximum possible radius of a city would, thus, be 1 / t, since a consumer residing beyond that radius would spend all of his time commuting and would have no time to work. The maximum population that can be accommodated by such a city is therefore:
The above-mentioned theories, thus, explicitly establish that (i) it is only natural for new cities to be born; (ii) each city has a finite size and (iii) each city has a population and spatial threshold. However, the above-mentioned models do not propose any technique to delineate the UGB. Since urban planners in India are not trained to comprehend the finity of a city’s size or population through the aforementioned spatial models and since these models have their respective limitations owing to very restrictive assumptions, they should ideally delineate the UGB of a city with the help of three urban footprints: carbon footprint, hydrological footprint and economic footprint.
Delineating the Urban Growth Boundary Through Urban Footprints
This article takes the Indian city of Bhopal as the case study for the UGB delineation analysis. Bhopal is the capital city of the state of Madhya Pradesh, one of the constituent states of the Union of India. The city is surrounded by a network of five market towns well connected by regional roads to the city. Drawing upon the NSHM Guidelines (Government of India, 2010), this article makes an attempt to measure three urban footprints of Bhopal city, namely, the carbon footprint, the hydrological footprint and the economic footprint in order to delineate the city’s UGB.
Carbon Footprint
In order to delineate the UGB, one must measure the carbon footprint of the city and determine the requirement of plantation to sequester the carbon. Despite its advantage in adopting a physical variable in the form of land area as the common metric for comparing alternative urban growth scenarios, the ecological footprint approach to delineate the UGB has limitations on two grounds (Chi & Stone, 2005): (i) it is limited to spatial dimensions for which disaggregate-level data are not always readily available at the city or sub-city level, and (ii) it provides only a static picture of the existing scenario and is not useful for projecting the impacts of future development scenarios. Therefore, instead of the ecological footprint, the carbon footprint has been measured in order to delineate the UGB of Bhopal city since it focuses strictly on the greenhouse gases released due to the burning of fossil fuels (Costanza, 2000), which is a concern for any city. While carbon dioxide (CO2) is one of the abundant greenhouse gases primarily contributed by the vehicular population of the city, urban forested areas are a well-accepted and proven resource for carbon sequestration in order to mitigate the accumulation of CO2 through biological, chemical or physical processes. The UN Framework Convention on Climate Change (UN, 2006) also underscores the importance of carbon sinks and sources to address issues related to fossil fuel emissions. In view of the crucial role of urban trees in securing and enhancing the urban microenvironment, the carbon footprint of respective cities needs to be measured (Patwardhan & Warran, 2005). Amongst various methods to measure this footprint, namely, field measurement, remote sensing, GIS, CO2 absorption approach, etc., the present paper adopts the CO2 absorption approach which calculates the acreage of green canopy required to sequester the CO2 emitted from burning fossil fuel. Since the physical footprint is assumed to remain unchanged from year to year, the variation in the carbon footprint is a product of changes in vehicle kilometres travelled and average fleet fuel consumption. Although for a given fleet, the aggregate emissions depend on the make and the age of the vehicles (the latter accounting for the negative impact of emissions by older vehicles), the present paper could not use vehicle make, age mix and the rate of retirement due to paucity of data, and instead uses a very straightforward method. Since Indian road transport majorly contributes CO2 (94.5%) with a negligible presence of CO, CH4, NOx, SO2, HC and PM, this article confines itself only to the CO2 emissions from vehicular traffic (excluding the emission from railways, airways and waterways). Although modal share differs across modes, this article takes all modes of motorized transport in view of the preponderance of three- and two-wheelers in Bhopal city. From the Comprehensive Mobility Plan of Bhopal (Government of Madhya Pradesh, 2012), the distribution of trip length along with per capita trip rate and modal split is obtained. Since the percentage share of trip length differs with kilometres travelled, the weighted average trip length (WATL) is taken considering the percentage for each length of travel except that of below two and above 10 kilometres. The resulting WATL is 6.54 kilometres. It only measures the area under green canopy required to sequester carbon emissions produced by network travel during a time period. To calculate the energy or energy-induced carbon footprint, the emission from vehicular transport is derived as follows:

The total carbon emission is, thus, calculated as follows:

Where TVKTPD = total vehicle kilometres travelled per day; WATL = weighted average trip length; PCTR = per capita trip rate; Pop (2022) = population of Bhopal as in 2022; MS = motorized modal share.
The population of Bhopal for 2022 has been calculated by the annual compound growth rate (0.026), which is the tenth root of Pt / Po, where Pt and Po stand for the population of Bhopal as per the 2001 and 2011 censuses, respectively.

Assuming the average mileage of fuel for the aforesaid vehicle mix at 15 kmph, the total per day fuel consumption is seen to be 966,175 litres. Since the average CO2 emission per litre of diesel and petrol taken together is 2.516 kg, total carbon emissions within Bhopal would be 2,431 tonnes. One hectare of forest can annually absorb approximately 1.8 tonnes of carbon, which is generated by the consumption of 100 gigajoules of fossil fuel (Wackernagel, 1994). Forests around Bhopal, which are endowed with a unique mix of tree species, density and age distribution, can be expected to achieve a higher rate of carbon sequestration than the average forest. Therefore, a figure of 2.0 metric tonnes of carbon sequestration per hectare, rather than 1.8 tonnes per hectare, is reasonable and conservative. Taking the standard CO2 emission per litre of petrol/diesel (there is a decimal point difference between the two) at 0.040 gigajoules of energy, the carbon footprint of Bhopal is estimated at:

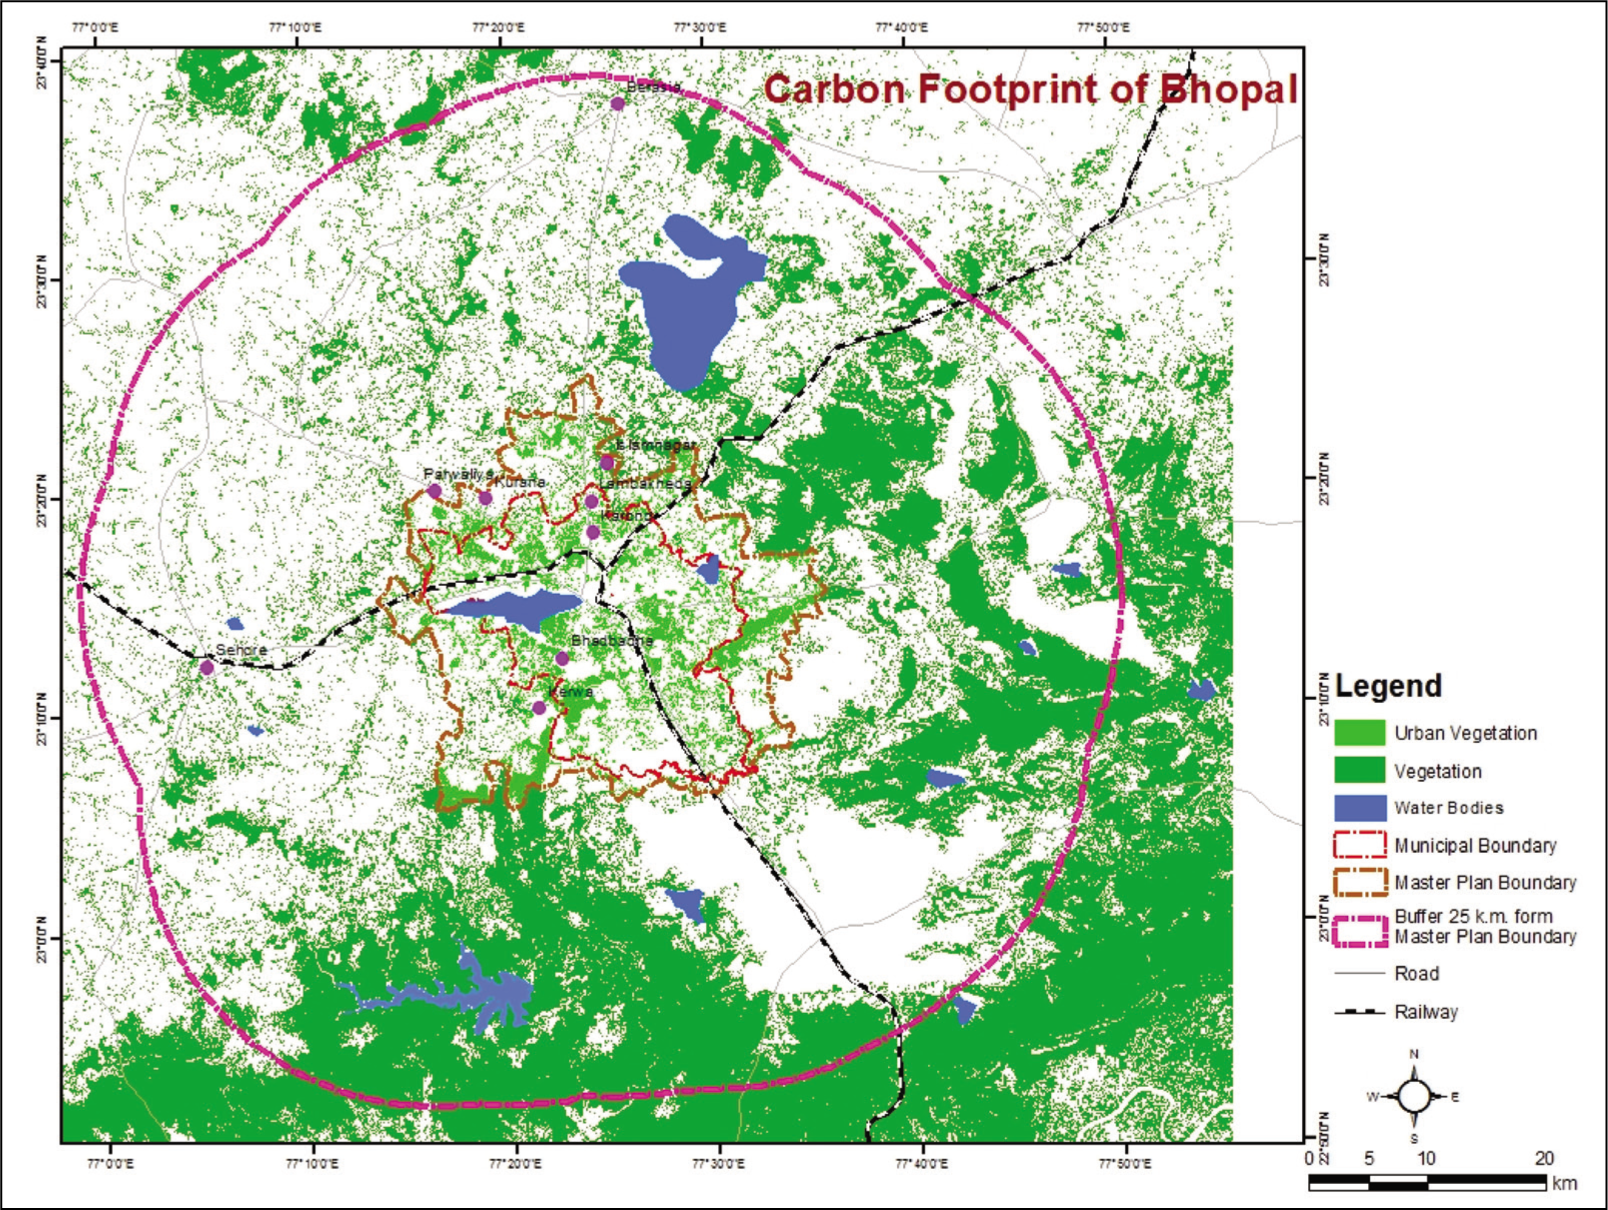
Such a hectarage of green cover is required to absorb the city’s carbon emissions, which can be easily provided by its vast 278 km2 green cover as projected in its 2005 Development (Master) Plan (Government of Madhya Pradesh, 2005), even in the foreseeable future with electric cars populating the city roads over the years (Figure 1).
Carbon Footprint.
Hydrological Footprint
While delineating its UGB, every city should provide for the drainage of rainwater off its surface and convey it to the natural drainage channel, possibly within the UGB to prevent flash floods from inundating the city. The hydrological footprint, scarcely used in urban planning, is a function of land use, climatic factors, surface and subsurface flows, groundwater, vadose water, etc. (Ramachandra et al., 2018). However, this article takes the liberty of using the term ‘hydrological footprint’ instead of ‘water footprint’ in order to ascertain whether the natural drainage system in and around the Bhopal city master plan area can take care of its rainwater run-off. The indiscriminate and arbitrary expansion of a city significantly transforms the water movement path and adversely affects the naturally evolved drainage systems of watersheds, wetlands and water bodies as increased run-off volumes, velocities, and peak flows cause erosion, flooding and degradation of the city’s ecosystem and modify the temporal patterns of its hydrograph (Giacomoni & Zechman, 2009). The run-off coefficient is a measure of the amount of rainfall that is converted to surface run-off. In Bhopal, an increase in impervious surface decreases the amount of rainfall available for infiltration owing to its humid subtropical climate and deep, medium black soil and, thus, hastens the discharge of rainwater into nearby lakes, dams and rivers through its topography and planned drainage network. Although channelling the rainwater run-off requires a multidisciplinary approach through structural and non-structural measures, this article recommends non-structural measures in the form of maintaining the natural rainfall run-off ratios, protecting hydrologically sensitive areas, preventing sedimentation in the natural and man-made drainage system, minimizing topography changes and soil compaction, preventing straightening and channelizing the existing streams through different Acts and Rules, policies, programmes and projects by both the Bhopal Municipal Corporation and Bhopal Development Authority. The topography of Bhopal favours efficient and rapid drainage of the planning area through a network of as many as five small rivers across four directions, besides four dams and many small and big lakes (the city is known as the City of Lakes).
This article, therefore, makes an attempt to calculate the peak run-off released in the city and recommends its conveyance through the natural drainage basins scattered all across the city and its periphery. The rational method estimates the peak run-off (Qp) as Qp = C × I × A, where C is the coefficient of run-off, A is the area of the catchment, and I is the intensity of rainfall.
In metric units, this equation is expressed as
where Qp is the peak run-off rate (m³/s); C is the coefficient of run-off; I is the mean intensity of precipitation (mm/h) for a duration equal to the time of concentration and for an accidence probability; A is the area of the catchment (km²).
Several assumptions have been made to calculate the peak run-off rate, namely: (i) peak flow occurs when the entire catchment is contributing to the flow; (ii) rainfall intensity is uniform over the entire catchment; (iii) rainfall intensity is uniform over a time duration equal to the time of concentration and (iv) catchment beyond the Bhopal master plan boundary stands excluded. In order to compute the area of catchment, the impervious surface in the Bhopal master plan has been subtracted from the total area using unsupervised Classification Techniques in Erdas Imagine Software.
Values of C, I and A are computed (adopted) as follows:
C = 7.7 (since Bhopal city comes under central India, the value of C has been adopted from Kothyari and Garde, 1992); I = C T0.20 / t0.71 (R2 24))0.33, where C = run-off coefficient; T = return period in years and t = storm duration in hours. Assuming T as 10 years, t as 6 hours and C as 7.7, and using the given equation, the value of I is found to be 14.11 mm/hour; A = km² (total impervious surface within Bhopal master plan area). It is assumed that rainfall on the permeable surface does not run off.
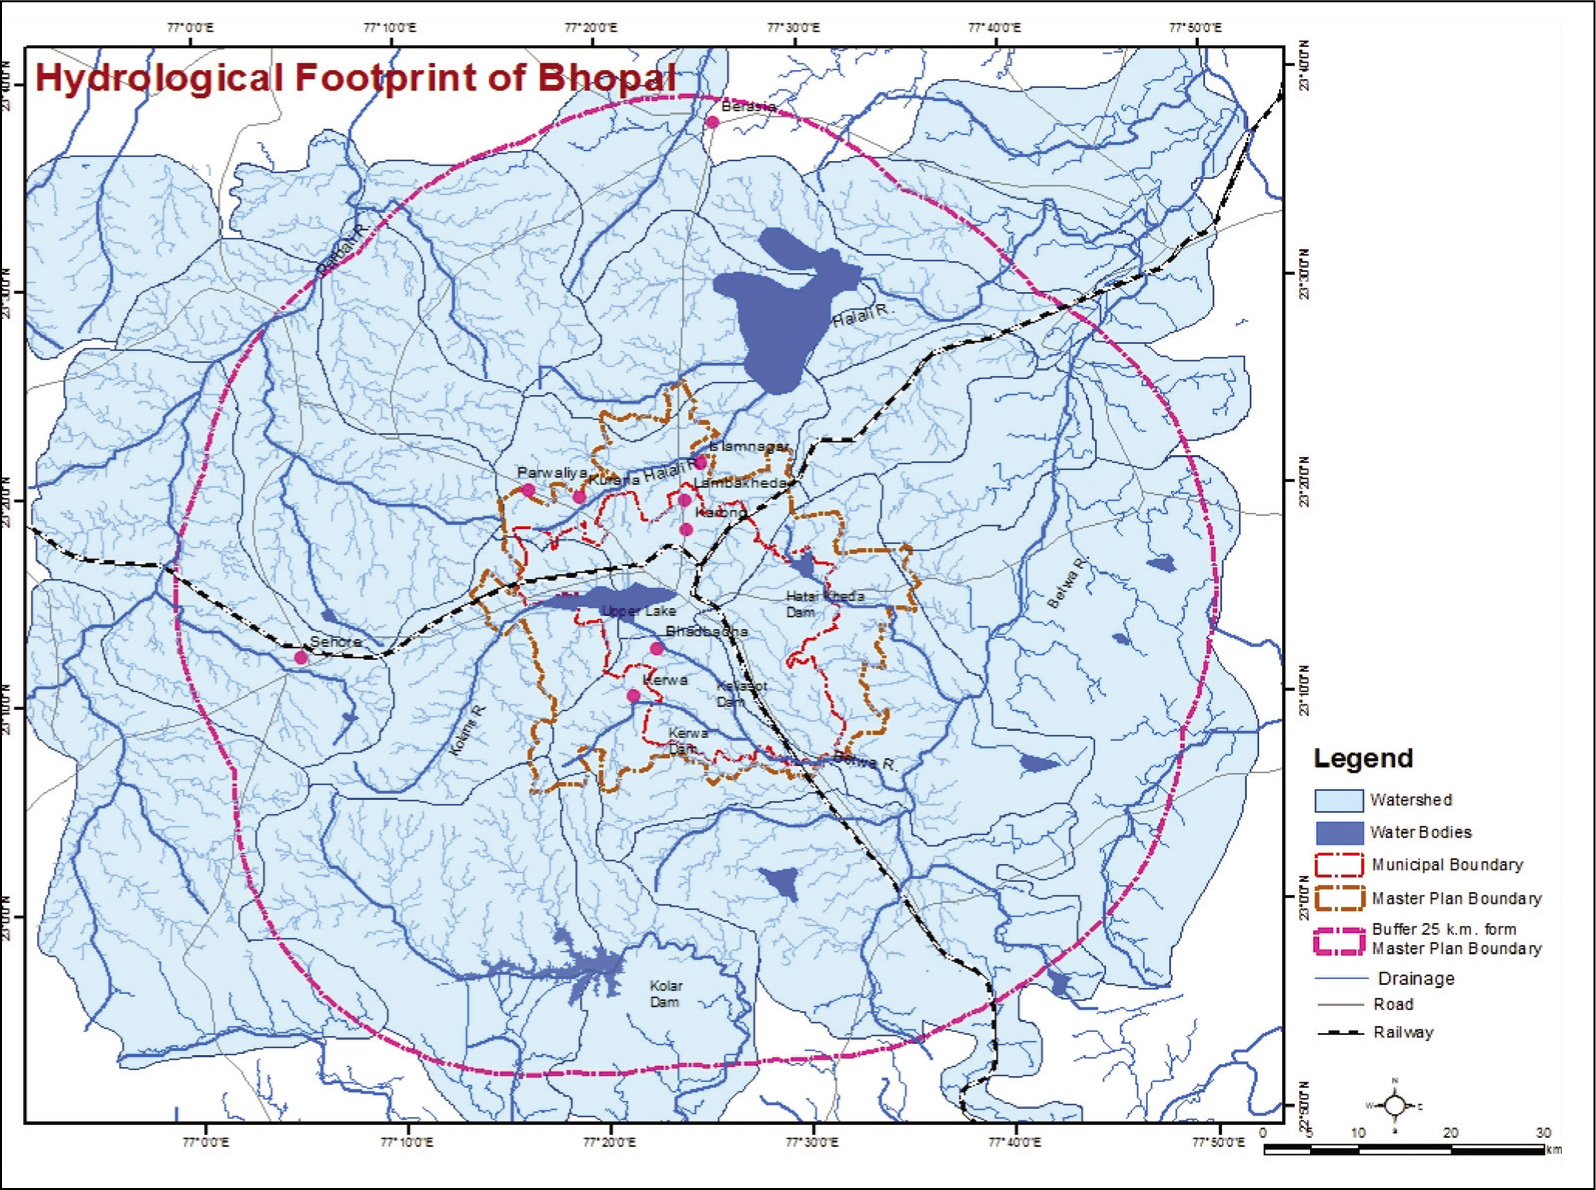
Therefore, the peak run-off of 1,901 m³/s can be easily carried away by the 695-kilometre-long natural drainage channels spread across the 2005 master plan boundary of the city (Figure 2). These natural drainage channels may be considered Bhopal’s hydrological footprint.
Hydrological Footprint.
Economic Footprint
The UGB of a city also needs the delineation of its economic footprint. The economic footprint of a city may be interpreted as the area it depends upon for its daily food consumption. A city depends on its agricultural hinterland for agricultural produce, especially vegetables, milk, fish and meat. The range of a good/product is the maximum distance that people (both seller and consumer) are prepared to travel to sell (purchase) it. Besides deciding the crops, inputs, extent of marketable surplus, farmers take into account the production costs, transportation costs, selling prices, wage rates, etc., while deciding on their farming activities (Buckmaster et al., 2012). Farm households around Bhopal city are no different for whom transportation costs are especially relevant as they have fewer options for freight movement. Since the farmers located far from Bhopal city face higher transportation costs, they usually avoid the Bhopal market and instead look for other cities to sell their products. It is only obvious that distance from the city determines the production and therefore the cost of a particular agricultural product. Thus, staple crops which are longer lasting and can be transported more cheaply are grown further away from the city than fruit and vegetables (perishable items) which demand a shorter haulage time. Since these two types of crops require different production and marketing practices, farmers around Bhopal city are likely to focus their efforts on one type or the other. If costs of market participation exceed the net revenue from vegetable production and sales, farmers will forgo the potential income from vegetables in favour of a more reliable income from staple crops, and vice versa. The decision between the production of vegetables and staple crops depends on the distance from the farmland to the market in kilometres as well as time in minutes.
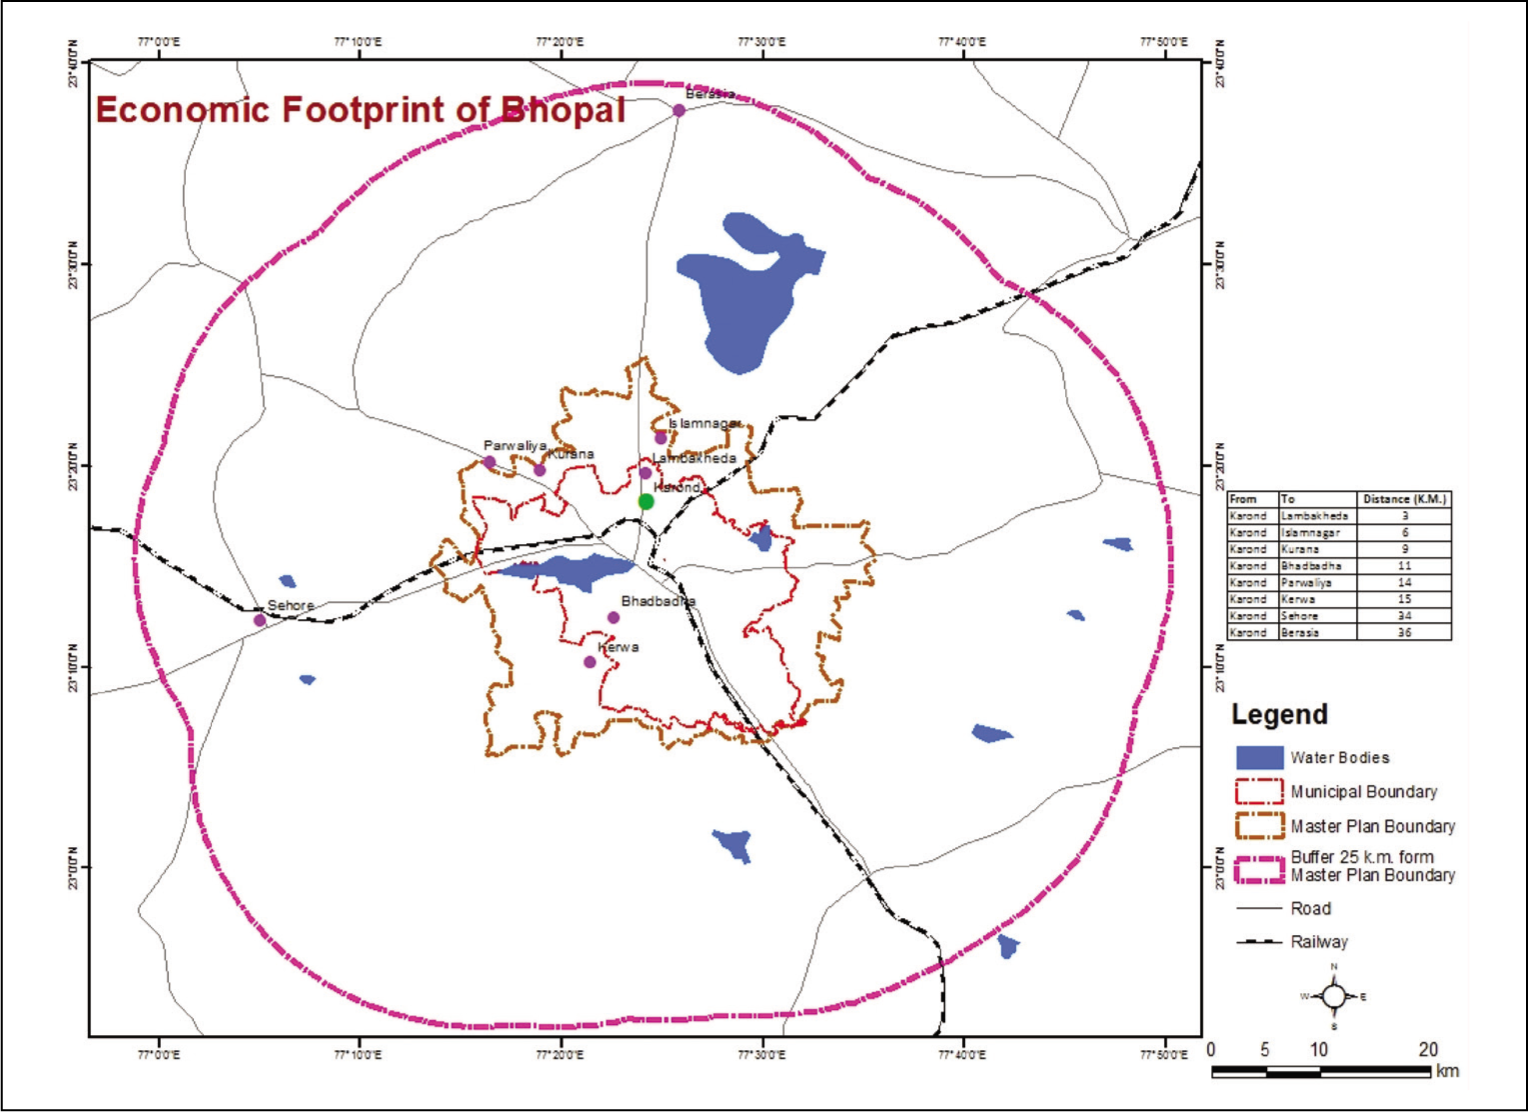
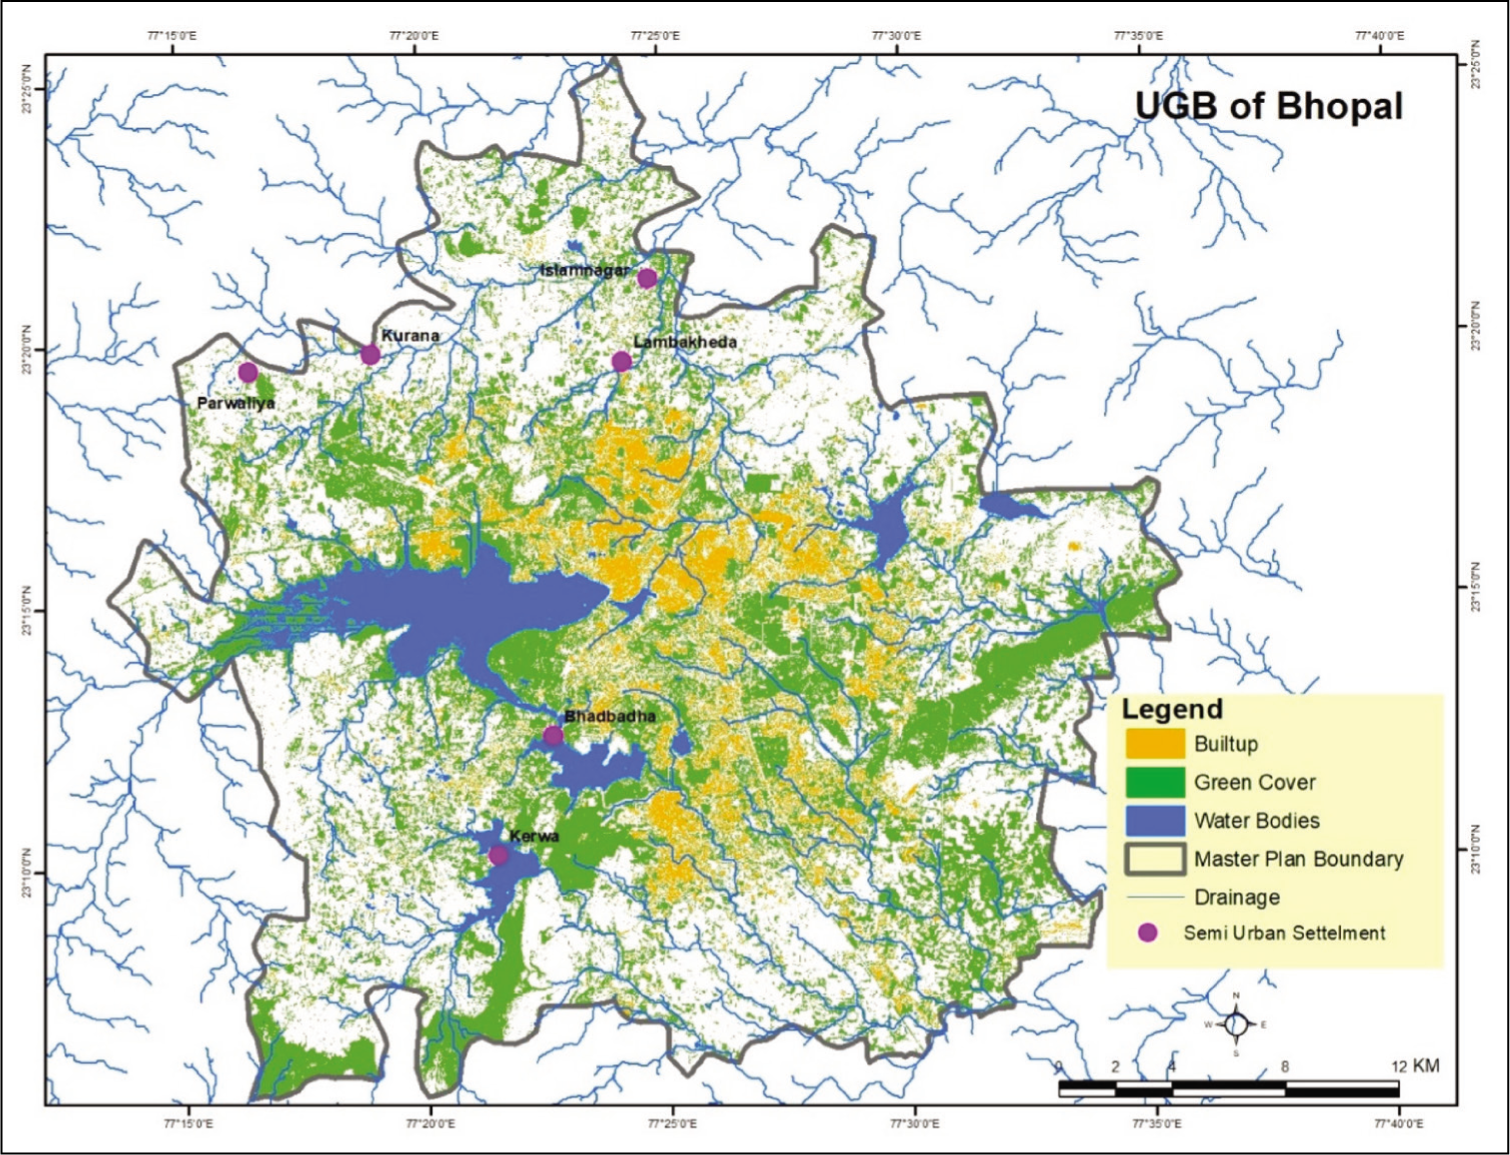
The objective of this article is to ascertain what effect, if any, distance and time to reach the market has on the decision to produce and/or sell vegetables (milk supply is not considered due to lack of data) by the farmers from the surrounding rural and semi-urban settlements of the city to the Bhopal market. This article studied the vegetable wholesale market in Bhopal, which is located at Karond in Municipal Ward Number 70. In this study, the vegetable-producing centres are taken to be the semi-urban settlements of Lambakheda, Islamnagar, Kurana, Bhadbadha, Parwaliya and Kerwa that are located within the 2005 master plan boundary of Bhopal. In order to measure the importance of time and distance on the decision to produce vegetables by the farmers of the above-mentioned semi-urban settlements, the following regression equation is used:
where the dependent variable Y represents the number of vegetable-laden trucks (since no estimate of vegetable production was available across the vegetable growing centres); X1 stands for the distance between the vegetable wholesale market and vegetable-producing centres in kilometres; X2 stands for the time taken to reach the vegetable wholesale market in hours; and et is the usual disturbance term with the cardinal assumptions of zero mean, constant variance, normally distributed, no autocorrelation and no correlation with the explanatory variables.
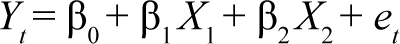
The regression results (Table 3) expectedly show that both the distance between the vegetable wholesale market and vegetable producing centres (X1) and the time taken to reach the vegetable wholesale market in hours (X2) have a negative impact. It means that a one-unit increase in the distance between the vegetable wholesale market and vegetable-producing centres will decrease the number of truck arrivals by nine units, and likewise, a one-unit increase in time taken to reach the vegetable wholesale market in hours will decrease the number of truck arrivals by 28 units. Since the data points (distance and time) for the regression equation are in reference to the above-mentioned semi-urban settlements (vegetable-producing centres) of Lambakheda, Islamnagar, Kurana, Bhadbadha, Parwaliya and Kerwa, these six settlements are conceptually considered to constitute the economic footprint of Bhopal, which supply vegetables to the city daily and are incorporated within the Bhopal master plan (Figure 3).
Regression Analysis on Impact of Distance and Time on Vegetable Production.
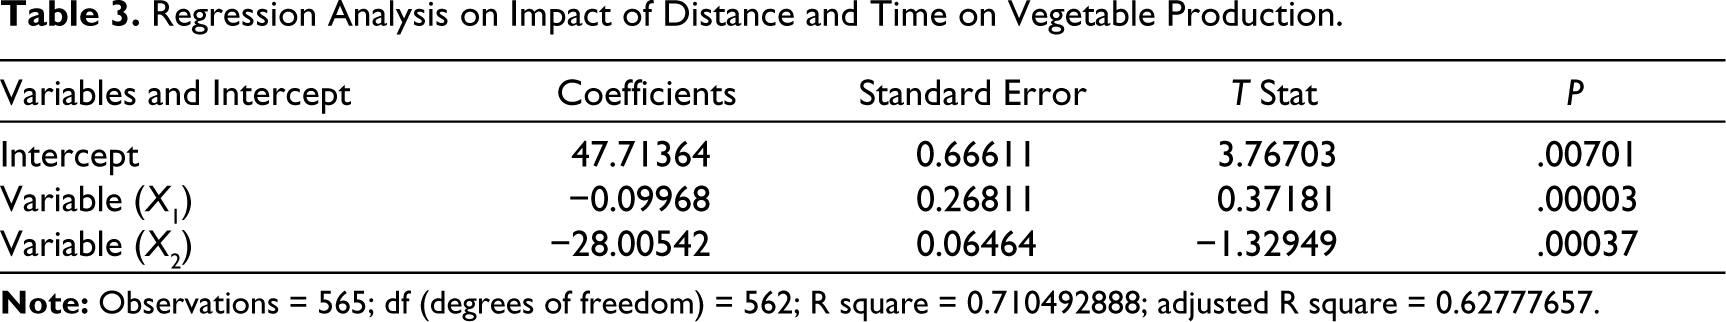
Economic Footprint.
Conclusion
This article empirically establishes that the current UGB (master plan boundary) of Bhopal can be considered as its UGB and hopes that the approach followed will help urban planners across geographies to delineate the UGBs of all cities objectively on the basis of these three urban footprints. The footprints projected for the city of Bhopal suggest: (i) 386 hectares of green cover required to absorb the city’s carbon emission can be easily provided by the city’s vast 278 km2 green cover (Figure 1); (ii) the rain run-off coefficient of the city at 1,901 m³/s can be carried away by the 695-kilometre-long natural drainage channels spread across the master plan boundary of the city (Figure 2); and (iii) the city’s vegetable supply is seen to be produced by the semi-urban settlements within the city’s master plan area (Figure 3). Since the metrics used for measuring the three footprints are different, these could not be clubbed together under one single metric. But all three footprints are superimposed in one figure (Figure 4) to indicate the UGB drawn for the city of Bhopal. Within this UGB, there are 143 villages with a population of 0.15 million occupying 61,492 hectares of land having a density of only 244 persons per km2, which can be retained as rural until warranted for genuine urban exigencies. The argument that retaining the rural areas as rural deprives the rural folk of the benefit of land value appreciation is not tenable as land value appreciation can be ensured for the rural folk by way of tradeable development rights.
UGB Boundary of Bhopal.
This article does not make any attempt to find out the optimal size of a city as there is no answer to what the optimal size of a city should be (Desmet & Esteban, 2014) since we do not know whether the size refers to the spatial expanse of the city or the density of population it can carry. It is held that a city size cannot be ad infinitum and hence a city should not take recourse to periodic extension of its UGB through its master plan. That is, a city should not be allowed to spread its wings indiscriminately without taking into cognizance the aforesaid three urban footprints. We must also realize that it is time to promote subaltern urbanization by promoting the regulated and planned growth of smaller towns and even larger villages adjacent to the city. The future urban destination of India should be its smaller towns and larger villages. This article also does not examine how the unabated conurbations and indiscriminate conversion of rural areas into urban have rendered urban management of bigger cities across India into a quagmire as evident from the existing deficient urban services and occurring catastrophes, besides the loss of identity of the incorporated settlements into the anonymity of the metropolis. Nevertheless, given the urban catastrophes regularly being experienced by Indian cities, it is only obvious that containment of a city through a UGB is more than warranted. Notwithstanding the statutory delimitation (undertaken arbitrarily) of an Indian city through a master/development plan, the political exigency ultimately alters the territorial frame of reference of a city. We should be hopeful that good sense will prevail on all stakeholders to follow the Aristotelian wisdom and admit that every city exists by nature (Ambler, 1985). Cities cannot be relegated to built politics; rather, cities ought to be regulated and promoted as built environment.
Footnotes
Declaration of Conflicting Interests
The authors declared no potential conflicts of interest with respect to the research, authorship and/or publication of this article.
Funding
The authors received no financial support for the research, authorship and/or publication of this article.