
Abstract
This research study explored the link between corporate governance practices (CGPs) and organisational performance in India, especially in the context of some major CG reforms that have been undertaken since the turn of the twenty-first century. The authors also attempted to understand in-depth the implications of these reforms for the companies. For assessing the link between CG practices and organisational performance, data were collected from a sample of 100 listed companies in India using an adapted version of the Institute of Company Secretaries of India (ICSI)’s questionnaire. Multilevel Factor Analysis (MFA) for scores along 5 CG sub-categories revealed 17 first-level and 4 second-level factors. Regression of organisational performance, measured using Compound Annual Growth Rate (CAGR), against these factors showed that the first-level factor representing corporate social responsibility and sustainability (CSRS) was a significant predictor of organisational performance. This finding is significant while considering the introduction of mandatory CG provisions for corporate social responsibility (CSR), applicable to companies meeting specified turnover and profitability thresholds according to CG regulations in India. The findings of this study open the debate on CG regulation and on mandatory and desirable norms in the Indian context. Eligible Indian companies must focus on the CG practice of investing in CSR initiatives through purpose-led CSRS interventions and their long-term benefits, rather than on viewing it as a mandatory CG provision that induces short-term expenses.
Keywords
Introduction
Corporate governance (CG) has acquired a centre stage in business and management. The recent happenings in the corporate world show the far-reaching impact of CG on the society and its functioning. Though there is better clarity on the social and ethical values of good CG, its role in enhancing the business value of corporations is yet to be clearly demonstrated by research studies. This study makes an attempt to understand the most important but least desired relationship between CG and corporate performance.
The Institute of Company Secretaries of India (ICSI, 2014) defines good CG as ‘the application of best management practices, compliance of law in true letter and spirit and adherence to ethical standards for effective management and distribution of wealth and discharge of social responsibility for the sustainable development of all stakeholders’ (p. 38). Byrne (2000) has identified three important criteria for good CG, namely board independence, board accountability and board quality. According to Garratt (2010), the characteristic features of good governance are separating the roles of the Chairman and CEO (who represent ownership and control, respectively), as implied by the agency theory, balancing the composition of the board in terms of skills and competencies as well as the proportions of insiders and outsiders, having defined criteria for director independence, establishing audit committees for remuneration of top-level executives, nomination of directors and for making business strategies, creating robust and transparent processes for appointment of directors and setting up effective performance evaluation systems (linking rewards to performance) and communicating it with investors.
The present study uses Garratt’s (2010) framework to measure the effectiveness of CG practices among a sample of Indian corporate organisations and explores the linkage of these measures to the performance indicators of the respective organisations. This would help understand the probable association between CG practices and organisational performance, which could motivate corporate leaders to invest money, effort and time in CG practices.
Literature Review
CG is the way in which companies are managed and operated. A series of high-profile corporate scandals over the past decades involving corporate giants such as Enron, WorldCom, Tyco, Lehman Brothers and Satyam led to an immediate need for revamping CG norms and guidelines among governments and policymakers. Some popular CG recommendations are the Cadbury Committee Recommendations in the UK (ECGI, 1992), Sarbanes–Oxley Act in the USA (SEC, 2002) and the Organisation for Economic Co-operation and Development (OECD) Principles on Corporate Governance (OECD, 2004). Waves of these developments abroad crossed over to India and stimulated the formation of various committees on CG, such as the Kumar Mangalam Birla Committee (SEBI, 2000), the Naresh Chandra Committee (NFCG, 2002) and the Narayana Murthy Committee (NFCG, 2003). The Securities and Exchange Board of India (SEBI) has made the disclosure of CG practices in the annual reports mandatory for Indian companies through Clause 49 of the listing agreement. Improved disclosure results in improved transparency, which is one of the most essential elements of healthy CG practices (Bhasin, 2010).
List of Committees on CG in India with Terms of Reference and Key Contributions.
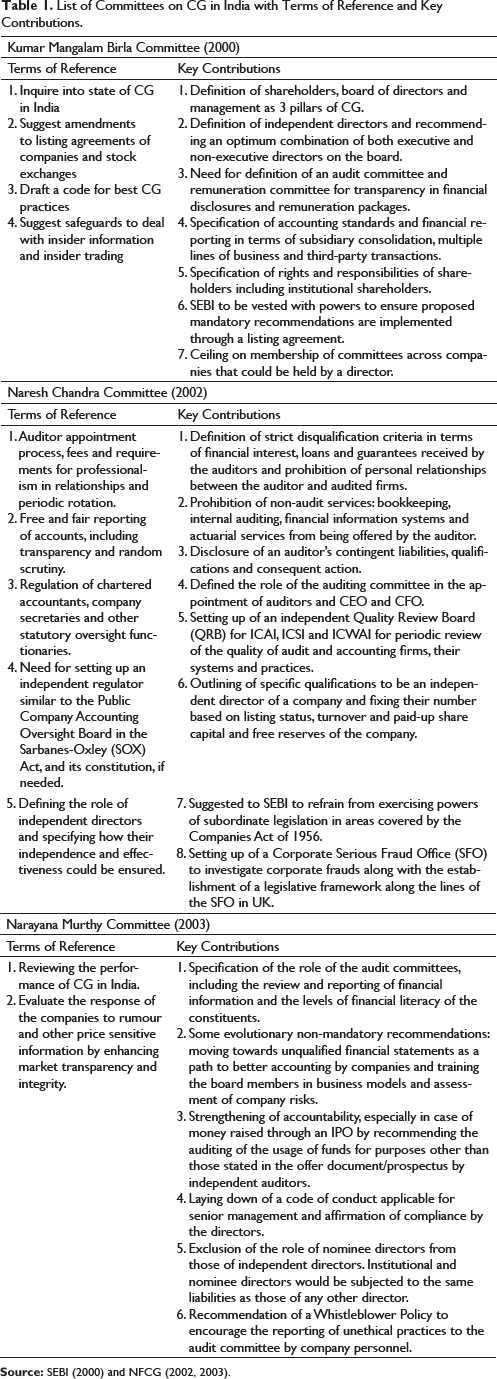
The major sources of enterprise in early industrialised India were family firms backed by wealthy industrialists. Over time, this has evolved into an issue involving the protection of major and minor stakeholders in addition to issues of agency (Kumar, 2020). The economic crisis faced by the country in 1991 led to the setting up of the market regulator, SEBI in 1992 with a focus on CG reforms and initially to regulate the securities market (Kumar, 2020). The earliest organised initiative towards CG in India started in1999 when the Confederation of Indian Industry (CII) introduced ‘Code of Corporate Governance’. This code specified expected norms of firms in terms of accounting transparency and disclosure in line with internationally acceptable norms and emphasised upon the role of audit committees in ensuring CG (Rajiah-Benett, 2020). Today, implementation of CG in India is closely regulated by SEBI and the Ministry of Corporate Affairs (MCA), and a key legislation outlining more stringent norms of CG such in terms of disclosures, transparency and norms is the amended Companies Act 2013 (Arora & Bodhanwala, 2018). With the initial thrust of large business enterprises in India being family-based, there is a need to assess the composition of the board and its structure closely. There have been concerns about the effectiveness of CG monitoring and the extraordinary powers enjoyed by the dominant shareholders in the context of CG in India (Almaqtari et al., 2020). A weak CG structure, especially in the developing world poses a serious challenge to the practice and adherence of CG (Al-ahdal et al., 2020). Ararat et al. (2020) have noted that like all markets and businesses around the world, there has been an evolution of the CG scenario in emerging markets too, with accumulation of experiential knowledge over the years, leading to increased focus on the role and structure of the governing entity, the board. They also point out that not all the CG reforms may be intended to achieve the best possible outcomes. In their in-depth study on 29 types of firms in India’s manufacturing sector for nearly a decade, Arora and Sharma (2016) found a favourable and increased intellectual contribution of outside or independent directors. CG in the Indian context, thus, poses a unique set of challenges and opportunities.
Disclosure practices in CG through annual reports of firms have been studied in both India and abroad. There have been descriptive, normative, qualitative and empirical studies on disclosure of CG practices in a comprehensive manner, covering disclosure of board size, board independence, corporate social responsibility (CSR) activities and so on. Good CG is rewarded by good company performance, and many studies have linked the two in the global context (e.g., Bebchuk et al., 2008; Chhaochharia & Grinstein, 2007; Core et al., 2006; Cremers & Nair, 2005; Dittmar & Mahrt-Smith, 2007; Gompers et al., 2003; Yermack, 1996). Generally, certain CG practices are associated with higher firm value. Much of this literature investigates the specific aspects of CG structures based on board or ownership structures and attempts to link them with some aspect of corporate performance. Research studies on various aspects of CG have highlighted several factors associated with CG and performance. The findings include a positive relationship between CG-related information and stock prices (Penman, 1980; Waymire, 1984). Also, there could be an increased focus on CG, and disclosure could matter more in those countries which have poor legal environments (Durnev & Kim, 2005; Klapper & Love, 2004). Firms’ incentives to adopt better CG practices increase with the level of development in the country as they have a better chance to access external finance (Doidge et al., 2007). In their attempt to prepare a Corporate Governance Index (CGI) for India, Arora and Bodhanwala (2018) placed major emphasis on variables such as board size, board proportion of independent directors, conduct of board meetings and the equity and shareholding patterns. They found that board structure and size had a significant impact on the firm’s performance through monitoring. In their meta-analytic study, Ali et al. (2020) have pointed out contrasting effects of board independence, board meetings and board structure on firm performance in CG studies carried out in the Indian context. Nevertheless, this is an indicator about the prominence of the structure and function of the board as well as the independence of directors and their role in contributing to firm performance. Then there have also been concerns about the treatment of minority stakeholders in case of boards of group-affiliated firms (Chakrabarti et al., 2008). Aggarwal et al. (2019) conducted a unique study in which they assessed the potential impact of demographic diversity of corporate boards on firm performance in case of both independent and group-affiliated firms. They found diversity to negatively influence firm performance for group-affiliated firms but to positively influence performance for independent firms, even with special measures of performance like merger and acquisition performance (Aggarwal et al., 2019).
This leaves open the question whether the intent behind the staffing of corporate boards is to either ensure effective CG or to showcase adherence to CG norms. Large shareholders play a key role in firms in emerging markets, one that often comes with consequences to be borne by their poor compatriots (Ararat et al., 2020). Nashier and Gupta (2020) used shareholder percentage to measure the impact of Ownership Concentration (OC) on firm performance in India using a very large sample of firm-year observations. Though initially, as an endogenous variable, OC was not found to significantly impact firm performance, it was found to positively impact both the marketing and accounting performance of the firm once controlled for. While OC can be used as a method for reducing agency costs, investor decisions could also be based on observing such trends. In their study on 2,552 non-financial firms in India, Sehrawat et al. (2020) assessed the impact of audit committee independence, board size and managerial ownership on firm performance. While managerial ownership alone was associated with firm performance measured as return on assets (ROA), both managerial ownership and board size showed a positive association with firm performance measured as Tobin’s Q. In their meta-analysis of 115 papers on CG published over the period 2008–2018, Gulati et al. (2020) have noted that board size (45%), CEO duality (32%) and independent directors (21%) figure most prominently among the studied endogenous variables, followed by board independence (11%) and diversity, frequency of meetings and OC (10%). Hence, even in today’s modern era, traditional concerns about the effects of OC in the context of CG are not unfounded.
Al-ahdal et al. (2020) conducted a comparative study on effects of indices—board accountability, audit committees and transparency and disclosure (TD)—among non-financial listed firms in India and in the Gulf Cooperation Countries (GCC). The culture followed in both countries, including the legal guidelines and expectations would be different. Their outcomes indicated a better firm and CG performance in India when compared to GCC. In terms of board accountability, the effects were similar, but a positive impact of audit committees and a negative impact of TD on firm performance were observed. In their study on 38 Ghanaian firms, Puni and Anlesinya (2020) found that the presence of both inside and outside directors on the board had a significant positive impact on firm performance, but also that having an audit committee had a negative impact on the same. An increased frequency of board meetings also had a positive impact on the firm’s financial performance. Such observations provide some pointers about the likelihood of adherence to these aspects of CG in a developing country context.
In post-independent India, the Companies Act was enacted for the first time in 1951 and was revised in 1956. This act gave the government and the judiciary the power to regulate and intervene (if required) in the functioning of the companies (Bhattacharya, 2020). Latest amendments to the company law in India (the Companies Act of 2013) have made it mandatory for firms having a higher slab of revenues in a given financial year (FY) to constitute a CSR Committee comprising of not less than three directors (with at least 1 independent director). This CSR Committee is authorised to define and approve the firm’s CSR Policy, according to which the firm must then spend at least 2% of the average of the net profits made by the firm in the three immediately preceding FYs in pursuance of the same (MCA, n.d.). While CSR no doubt allows for firms to demonstrate their contributions towards social causes in a deontic manner, the likely impact of this regulation in the Indian context is yet to be fully measured. In their study on US banks (a developed country context), Miller et al. (2020) found that the CSR reputation of a firm (based on its compliance with CSR regulations in force) does impact firm performance. Walker et al. (2019), in their study of 16 countries comprising both coordinated market economies (CMEs) and liberal market economies (LMEs), observed that firms in CMEs have a higher CSR than those from LMEs. Though India was not included in the sample, such studies do emphasise upon the likely contribution and expectation from CSR in the context of CG.
In his study on CG in the Indian Corporate Sector, Patibandla (2006) opines that the higher the share of investment by the governmental financial institution, the lower was the firm’s profitability; however, a higher share of foreign equity investment led to higher level of profitability. Enhancing foreign equity investment and reducing government investment in Indian firms is, therefore, a method using which CG could be improved, as foreign institutional investors (FIIs) would invest in information and tools to monitor the managers of the firms.
Given the high prevalence of studies linking CG practices and organisational performance in the developed countries, and the relatively lesser number of similar studies in the Indian context, this was the background in which this study was undertaken. From the literature, we could determine that there were five key areas in CG, namely board structure, board processes (BPs), TD, protection and enhancement of stakeholder interests and CSR whose association and impact on the firm performance needed to be closely examined in a developing country context. Hence, we proceeded further in this direction.
Objectives of the Study
The objectives of this research study are
To assess the level of practice of five dimensions of corporate governance practices (CGPs) identified from the literature—board structure and committees (BSC), BPs, TD, stakeholders’ value enhancement (SVE) and corporate social responsibility and sustainability (CSRS). To identify the dimensions perceived as most relevant by practitioners and, therefore, contribute to effective CG. To examine the association of organisational compliance measured along the CGP’s dimensions with organisational performance, measured in terms of Compound Annual Growth Rate (CAGR).
Research Methodology
The review of existing literature revealed a shortage of ‘scales’ to measure CG practices, especially in the Indian context (with due regard to Indian laws). After extensive search, five instruments used in the research on CG that were relevant to the current study were selected for analysis. They are ICRA Corporate Governance Survey (ICRA, 2004); Corporate Governance Questionnaire by the Capital Market Development Authority (CMDA, 2007); Emerging Markets Committee (EMC)—Task Force of the International Council of Securities Associations (ICSA)—Questionnaire on Corporate Governance Survey (ICSA, 2007); Development Finance Institution (DFI) Toolkit on Corporate Governance by International Finance Corporation (IFC, 2010); and ICSI Survey for the National Awards for Excellence in Corporate Governance (ICSI, 2013).
From among the instruments examined, ICSI’s (2013) questionnaire was the most comprehensive one that measured all the five important dimensions of CG, mentioned earlier. ICSI (2013) had designed the questionnaire for identifying the best CG performer for the 13th National Award for Excellence in Corporate Governance 2013 among the listed companies in India. However, as the responses were to be provided in the YES/NO format in the questionnaire, it was not effective for rigorous statistical analysis. Hence, we substantially redesigned this questionnaire as a 5-point Likert scale (rating from ‘Least Relevant’ to ‘Most Relevant’) to understand the relevance and effectiveness of the CG practices from a practitioners’ perspective.
Sample Selection and Survey Process
A sample of 100 listed companies in India was selected for the survey using non-probabilistic judgemental sampling procedure. Company information was sourced from the websites of the Bombay Stock Exchange (BSE)/National Stock Exchange (NSE) on which they were listed. A copy of the questionnaire was then emailed to the Company Secretaries of these companies. After a familiarisation period of 1–2 days, structured telephonic interviews (of 40–45 minutes duration on average) were carried out and responses were collected.
Description of Questionnaire Used for the Study
The original ICSI (2013) questionnaire had four sections. Board structure and processes (31 questions); TD compliances (12 questions); SVE (13 questions); and CSR and sustainability (7 questions). The first section in the questionnaire was too large (with 31 items), as it combined two issues, board structure and BPs. Hence, while redesigning the questionnaire, this section was split into two—BSCs and BPs. These two, along with the remaining three sections of the ICSI questionnaire, constituted the five sections in the questionnaire used in this study. The rating system was also modified to a 5-point Likert scale on the perceived relevance of the listed practices for the effective management of CG. The original scheme of YES/NO responses was also retained with a slight modification (addition of a NA option) so that we could assess the extent of CG practices in the respondent organisations.
The questionnaire comprised two main parts. Part I asked for company information and had two subsections. Section A captured general information, such as main business area, listing details and board composition; the sustainability initiatives and CSR of the company; and whether the company had won any awards for CG. Section B of Part I dealt with the financial/performance information on the company, such as sales turnover, profitability, dividend rate, market capitalisation and some well-known financial ratios, such as P/E ratio and debt-to-equity ratio, for the previous 3 FYs. These data were used to compute CAGR, which was used as a metric of organisational performance in this study. Part II contained102 questions adapted from the ICSI questionnaire that measured the relevance of CG practices for ensuring the effectiveness of CG in the organisation. These questions were now regrouped under five major sub-themes of CG practices—BSC; BP; TDs; SVE; and CSRS. These questions were anchored on a 5-point Likert scale with option ‘1’ meaning ‘Not relevant for any CG issues’ and option ‘5’ meaning ‘Relevant for all CG issues’. Respondents were also asked to answer YES, NO or Not Applicable (NA) against each of these questions to indicate whether the items being measured were applicable to and followed in their company, applicable to but not followed in their company and not applicable to their company, respectively.
Hence, two types of variables were measured—the extent of compliance to CG practices and the perceived relevance of these practices—in addition to organisational demographics and performance details. For elimination of respondent bias, the subheadings were removed. The construct validity of the questions used was very clear with the adapted version of the ICSI questionnaire.
Data Analysis
As there were 102 CG variables, plus a few more in the sections on demographics and performance, a reduction of dimensions was the first step to meaningful interpretation. However, 100 respondents was not a large-enough number to do an overall factor analysis. Hence, each of the five sections was subjected to factor analysis separately and was later consolidated using a second-level factor analysis. Factor scores, which give an idea of perceived relevance, were computed at both levels. The next step in the analysis was to compute an index for the extent of CG practices. This was done by counting the number of ‘YES-responses’ on all the variables under a factor and dividing it by the number of variables (to obtain the index, which will be a number equal to or less than one) and multiplying it by 100 to convert this index into percentage. The percentage scores on compliance could be treated as a continuous variable and correlated with the CAGR, which then can be subjected to regression analysis.
To summarise the procedure of analysis described above, the steps involved may be presented as factor analysis (section-wise, and overall using the factor-scores derived from the first level) of the 102 CG practice variables in order to identify the major dimensions of CG practices; computing the average scores for each factor (including the first-level factors) to rate them on the relevance perceived by practitioners; computing the percentage scores for each dimension of CG practice (including the first-level factors) to understand the popularity of each type of practice; computing the overall CG practice scores for all the 100 respondents by counting the ‘YES-responses’ on the 102 items and converting the number to percentages; computing the CAGR for all the 100 respondents; correlating the CG practice scores with CAGR, which could also be done for the overall factors (or even the first-level factors); and regression analysis to understand the association of various dimensions of CG practice, if any, with CAGR.
Factor Analysis
Data collected against questionnaire items for the relevance of CGPs in the areas of BSCs, BPs, TD, SVE and CSRS were separately factor-analysed using principal component analysis (PCA) with varimax rotation. Variables with a loading of 0.5 or more were accepted as components of a factor. The factors obtained under each category were also checked for their reliability using Cronbach’s alpha. A Cronbach’s alpha value of 0.7 and above indicated that a particular factor was reliable.
First-level Factor Analysis
First-level Factor Reliability, Average Factor Scores, Compliance Scores and Non-compliance Scores.
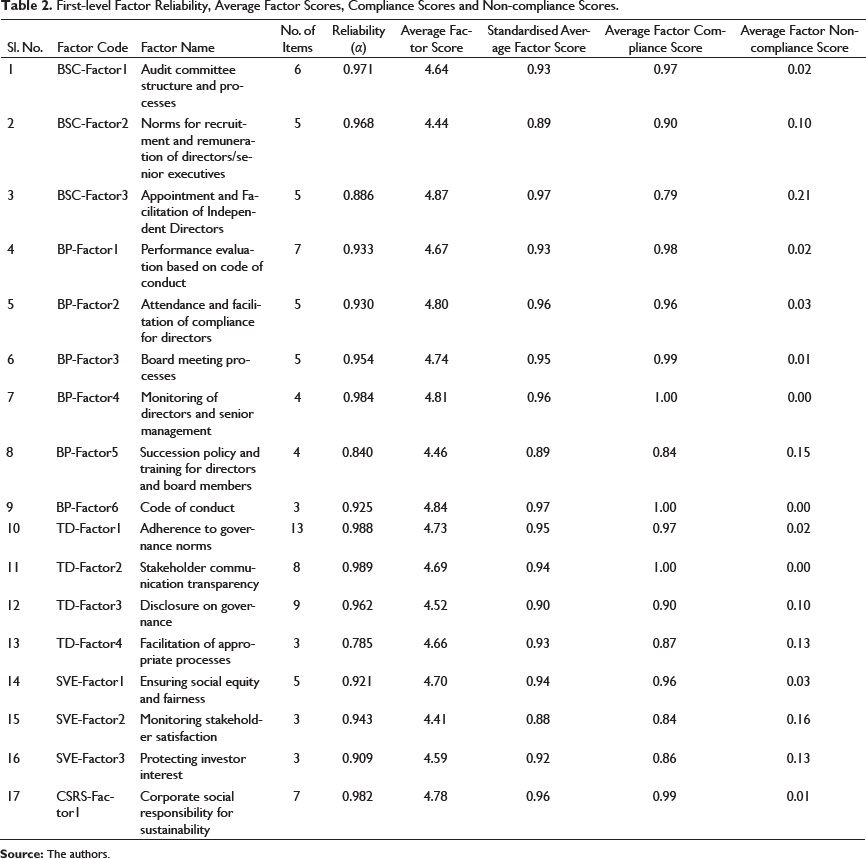
Factor analysis of 33 items in the questionnaire used to measure the relevance of CG practices relating to TD yielded 4 factors: ‘Adherence to Governance Norms’, ‘Stakeholder Communication Transparency’, ‘Disclosure on Governance’ and ‘Facilitation of Appropriate Processes’. Factor analysis of 11 items in the questionnaire used to measure the relevance of CG practices relating to SVE yielded 3 factors: ‘Ensuring Social Equity and Fairness’, ‘Monitoring Stakeholder Satisfaction’ and ‘Protecting Investor Interest’. Factor analysis of seven items in the questionnaire used to measure the relevance of CG practices relating to CSRS yielded an unrotated solution with all items loading onto a single factor: ‘Corporate Social Responsibility for Sustainability’ (see Table 2).
Correlations Between First-level Factor Scores.
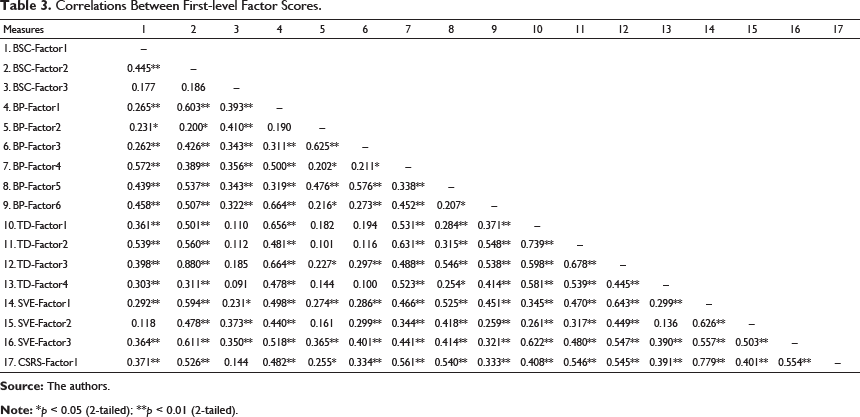
The second-level factor analysis was performed using PCA and varimax rotation (with N = 100), where the first-level factors served as the variables, and their factor-scores (average score of the variables constituting a factor) were used as the variable scores. A new set of factors was obtained called the CG factors, for they represented the underlying associations between measures of CG in five different areas.
Second-level Factor Analysis: Identifying the Corporate Governance Factors
Results of the Second-Level Factor Analysis: The Four Corporate Governance Factors (Vs = 17; N = 100).
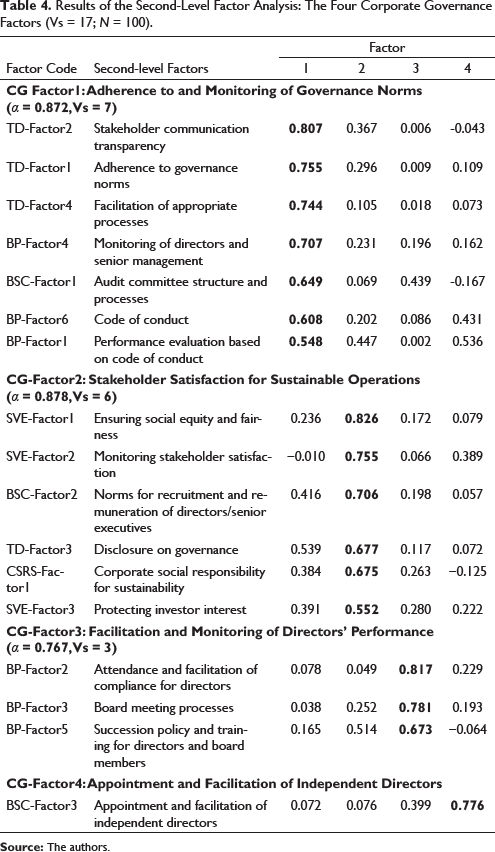
The four factors that emerged after the second-level factor analysis were adherence to and monitoring of governance norms; stakeholder satisfaction for sustainable operations; facilitation and monitoring of directors’ performance; and appointment and facilitation of independent directors. It is logical to believe that these four pillars are critical to CG, and that they help us in understanding the CG process better.
Analysis of Corporate Governance Compliance and Organisational Performance
Computation of Compliance Scores
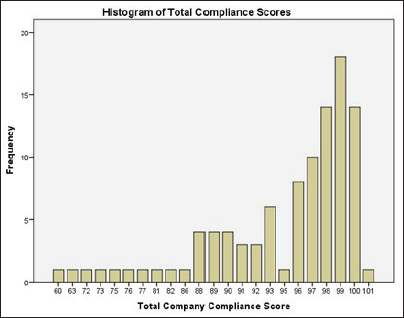
The next step was to assess the degree of compliance with CG norms and guidelines. Along with assessing the degree of relevance, Company Secretaries were asked to indicate the compliance for each question in terms of three responses—YES, NO or NA (see Section 4.2 for meaning). Addition of the number of ‘YES’ responses reported in response to all 102 questions gave the compliance scores. Figure 1 shows the histogram of compliance scores obtained from all respondents. Over 90% of respondents had compliance scores in the interval of 81–100. The next step was the computation of the average compliance scores, which were computed as a percentage of the compliance score obtained on a base of 102, the total number of questions.
Computation of Organisational Performance Scores
CAGR of the companies was used to measure their financial/organisational performance. Details of the operating incomes of the companies for the 3 FYs, 2012–2013, 2013–2014 and 2014–2015 were collected in Part I of the questionnaire. As we had the financial data for two FY intervals, CAGR was calculated using the following formula:

Correlation Between Organisational Performance and Compliance
A correlation analysis to examine the possible association between the measure of organisational performance (CAGR) (M = 0.121, SD = 0.477) and the average compliance scores (M = 0.921, SD = 0.076) of the companies revealed that they were negatively correlated (r (98) = −0.196) and that the correlation was not statistically significant.
Correlation and Regression Analysis Using First-level Factor Scores
The next step in the analysis was the examination of the possible association between company compliance scores obtained along both the first-level and second-level factors and organisational performance using correlation and regression analysis.
Computation of Average Compliance and Non-compliance Scores
The average compliance and non-compliance scores along each factor of relevance that was obtained under the five categories, BSC, BP, TD, SVE and CSRS, were computed as the total number of ‘YES’ and ‘NO’ responses, respectively, by the companies for each item loading on the factor divided by the number of items loading onto a factor. This computation was done along all of the 17 first-level factors and 4 second-level CG factors.
Relative Importance of First-level Factor and Compliance Scores
Table 1 also shows the average factor scores and the average compliance and non-compliance scores evaluated along the first-level factors. The factor scores have been calculated using the average scores indicated for the relevance of all items that load onto a factor on a Likert-scale of 1–5. The average factor score in the table represents the mean factor score obtained from all the 100 companies. This has further been standardised by dividing it by five to give a value between zero and one that was rounded off to two decimal places to provide a percentage. The average factor compliance and non-compliance scores are the mean values of the average compliance scores and non-compliance scores that were computed for all the 100 companies along the first-level factors.
The first-level factors ‘Code of Conduct’ (BP-Factor6) and ‘Appointment and Facilitation of Independent Directors’ (BSC-Factor3) had the highest relevance scores of 97%, while ‘Monitoring Stakeholder Satisfaction’ (SVE-Factor2) had 88% and ‘Norms for Recruitment and Remuneration of Directors/Senior Executives’ (BSC-Factor2) and ‘Succession Policy and Training for Directors and Board Members’ (BP-Factor5), with 89% each, had the lowest relevance.
The average compliance factor scores and the average non-compliance factor scores were observed to be largely mutually exclusive, and hence, this analysis was restricted only to the compliance data. Three factors, ‘Code of Conduct’ (BP-Factor6), ‘Monitoring of Directors and Senior Management’ (BP-Factor4) and ‘Stakeholder Communication Transparency’ (TD-Factor2) had 100% compliance. The factors ‘Appointment and Facilitation of Independent Directors’ (BSC-Factor3) had 79%, while ‘Monitoring Stakeholder Satisfaction’ (SVE-Factor2) and ‘Succession Policy and Training for Directors and Board Members’ (BP-Factor5), both with scores of 84%, had the lowest compliance scores.
Correlation and Regression Analysis Using Average Compliance Along the First-level Factors
Correlations Between CAGR and Average Compliance Scores Along the First-level Factors.
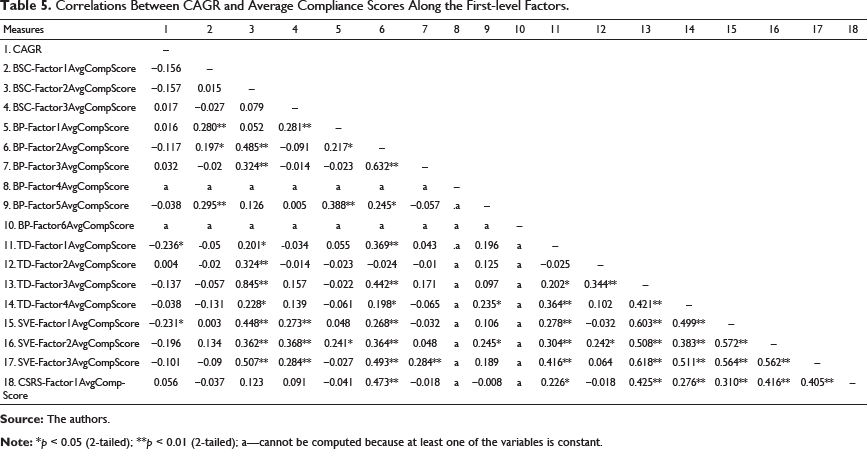
TD-Factor1: Adherence to governance norms
SVE-Factor1: Ensuring social equity and fairness
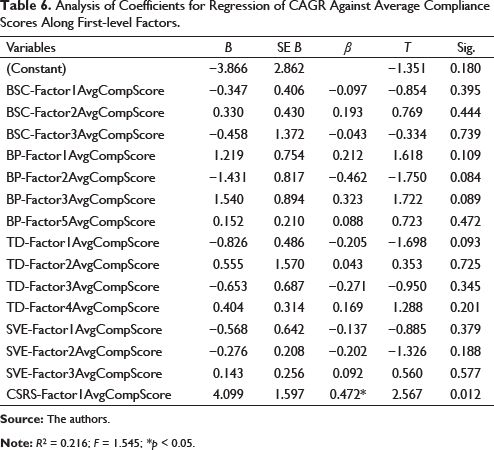
To measure the impact of any changes in the average compliance reported by companies along the 17 first-level factors, the following equation was evaluated:

Analysis of Coefficients for Regression of CAGR Against Average Compliance Scores Along First-level Factors.
Correlation and Regression Analysis Using Second-level Factor Scores
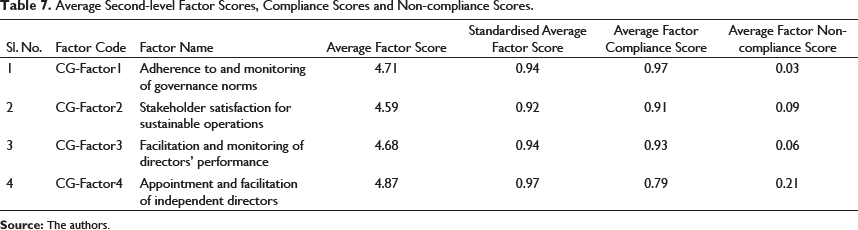
Relative Importance of Second-level Factor and Compliance Scores
The average factor compliance and non-compliance scores were computed for all the 100 companies along each of the 4 second-level factors in a manner similar to those calculated along the first-level factors. As the average factor compliance scores and the average factor non-compliance scores were observed to be largely mutually exclusive, the analysis was restricted to using compliance scores.
Average Second-level Factor Scores, Compliance Scores and Non-compliance Scores.
Correlation and Regression Analysis Using Average Compliance Along the Second-level Factors
Correlations Between CAGR and the Average Compliance Scores Along Second-level Factors.
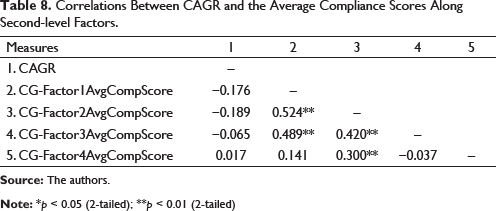
To measure the impact of the average compliance scores obtained along the four CG factors on CAGR, the following multiple regression equation was evaluated:

By substituting the variables,
Analysis of Coefficients for Regression of CAGR Against Average Compliance Scores Along Second-level Factors.
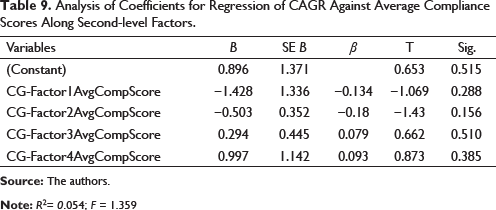
The line of best fit that could quantify organisational performance in terms of the average compliance scores along the second-level CG factors obtained by the regression analysis was
Organisational performance (CAGR) = 0.896 − 1.428 × (average compliance scores along ‘Adherence to and Monitoring of Governance Norms’) − 0.503 × (average compliance scores along ‘Stakeholder Satisfaction for Sustainable Operations’) + 0.294 × (average compliance scores along ‘Facilitation and Monitoring of Directors’ Performance’) + 0.997 × (average compliance scores along ‘Appointment and Facilitation of Independent Directors’).
Consolidated Findings of the Study
Findings of the Correlation Between Compliance and Organisational Performance
It was found that organisational performance (CAGR) and compliance had a negative correlation, which was not significant.
Findings of the Correlation and Regression Analysis Using First-level Factor Scores
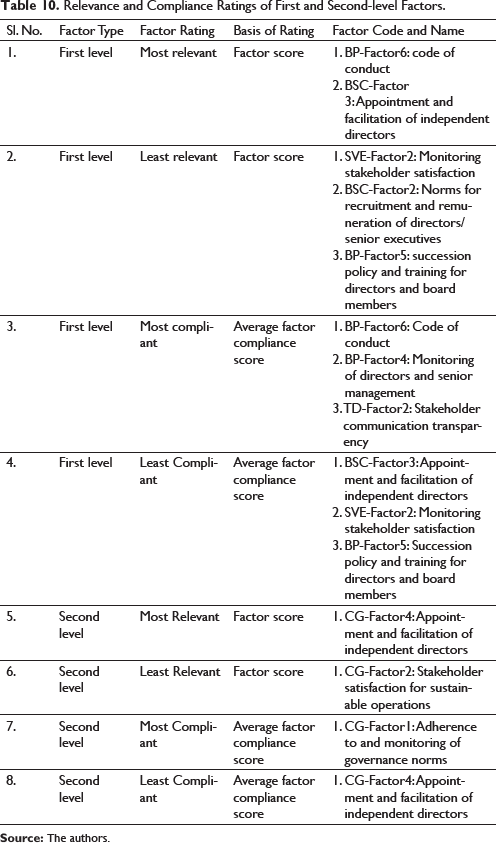
Relevance and Compliance Ratings of First and Second-level Factors.
Average compliance scores along the following first-level factors had significant negative correlations with organisational performance (CAGR):
TD-Factor1: Adherence to governance norms
SVE-Factor1: Ensuring social equity and fairness
Average compliance score along the first-level factor ‘Corporate Social Responsibility for Sustainability’ (CSRS-Factor1) was found to be a significant predictor of organisational performance (CAGR).
Findings of the Correlation and Regression Analysis Using Second-level Factor Scores
None of the average compliance scores obtained along the second-level factors was found to be significantly correlated with organisational performance (CAGR).
None of the average compliance scores for the second-level factors were found to be significant predictors of organisational performance.
Conclusion
CG is gaining emerging importance in management because of its role in preventing unfair practices by corporations and thereby ensuring their long-term sustainability. In the Indian context, in spite of several prescriptions, there is a deficiency of academic perspectives and empirical research, a gap this study attempted to fill. However, time and budget restrictions meant that a sample size of 100 was very small considering that there are over 130,000 registered companies in India (PTI, 2014). The findings of this study are, therefore, indicative of some CG trends in India and may be used to generate hypotheses for further research, and its major contributions are outlined below
Starting with a list of 102 CG-related practices, this study was able to consolidate them into 4 major dimensions of CG, thereby identifying the 4 pillars on which the CG edifice is supported—stakeholder satisfaction; governance norms; investor directors and top management; and independent directors. As pointed out earlier, the identification of these four factors from a large number of CG practices has led to a better understanding of the purpose and process of CG. It may be inferred from this finding that the purpose of CG is to ensure stakeholder satisfaction (Factor 2) by adhering strictly to the prevailing norms of CG (Factor 1), which is accomplished through the facilitation and monitoring of the performance of both the stakeholder-directors/top management (Factor 3) as well as the independent directors (Factor 4). The ‘long-term sustainability’, which is stated as a major goal of CG is expected to result from the satisfaction of all stakeholders. In other words, equitable and fair treatment of all stakeholders is likely to ensure the support of all for the enterprise, which in turn would help the company to offer relevant services to all concerned and thereby ensure its own sustainability. Compliance with CSR regulations may be an option for enterprises to follow in this regard. As this was a self-reported survey, the ratings and relevance for CG practices were on the higher side. However, perceived relevance does not always lead to a corresponding level of practice, with the exception of ‘Code of Conduct’ (BP-Factor6), a high-relevance/high-practice factor’ and ‘Monitoring Stakeholder Satisfaction’ (SVE-Factor2), a low-relevance/low-practice factor. The respondents were apparently more focused on mandatory norms than desirable ones. From the correlation and regression analysis involving CAGR and CG compliance scores, some rather unexpected findings have emerged, as in the case of compliance scores along first-level factors, ‘Adherence to Governance Norms’ (TD-Factor1), and ‘Ensuring Social Equity and Fairness’ (SVE-Factor1), which had significant negative correlations with CAGR. However, this may be indicative of a short-run phenomenon. Compliance to norms of equity, fairness and CG may augur well for the sustainability of the organisation in the long run. This must be examined in detail as performance data for this study were collected only over a period of 3 years.
Overall, the finding of this study is that regulation as a tool must be used sparingly and judiciously. In the Indian context, it must be noted that CG has not yet become an inseparable part of corporate culture. This means that government and public institutions need to further develop and enforce the norms of good governance, until it becomes a strong culture in the corporate sector. While CG regulation may have negative short-run effects, its judicious use could develop a salutary culture of good governance in the long run, leading to long-term sustainability of the enterprise through stakeholder satisfaction.
Footnotes
Acknowledgements
The authors of this article gratefully acknowledge the support provided by the National Foundation for Corporate Governance (NFCG), New Delhi, India, the Centre for Corporate Governance and Citizenship (CCGC) and the Indian Institute of Management Bangalore (IIMB), Bengaluru, India. This article presents the research findings of a study titled Corporate Governance Practices and Organizational Performance: An Empirical Investigation of Indian Corporate Organizations that was sponsored by the NFCG and was conducted and reported by Mathew J. Manimala, Kishinchand Poornima Wasdani and Abhishek Vijaygopal, under the aegis of CCGC, IIMB. The study report is hosted on the NFCG website and is available for download at the link:
Declaration of Conflicting Interests
Funding
The authors disclosed receipt of the following financial support for the research, authorship and/or publication of this article: This work was supported by the National Foundation for Corporate Governance (NFCG), New Delhi, India.