
Abstract
Despite the significant role of model or demonstrator farmers in disseminating new technologies, systematic and empirical examination of the behavioural characteristics that distinguish demonstrator farmers from other farmers is lacking. Understanding the characteristics of demonstrator farmers is as important as the characteristics of the technology or practice being demonstrated in model farms. Thus, this article examines whether attitudes to risks distinguish demonstrators from non-demonstrator farmers. The results show that a larger proportion of demonstrator farmers will take risks as compared to non-demonstrators. The results also indicate that being less risk-averse increases the chances of being a demonstrator farmer. The implication is that while demonstrators tolerate the risks that accompany adopting technologies, the reverse could be the case for non-demonstrator farmers. Crucially, this finding will inform the decision-making of extension agents when choosing demonstrator farmers. This article will also serve as evidence for future programmes not to rely wholly on demonstrator farmers as the decisively indicative test of farmers’ overall risk attitude.
1. Introduction
1.1 Background and Overview
Adopting new farm technologies and management practices often involves uncertainties and risks (Marra et al., 2003). For this reason, farmers’ risk attitudes will likely drive decision-making. In order to encourage adoption, farm demonstrations have been used to assist farmers in assessing risks (Khan et al., 2009; Mbure & Sullivan, 2017). Demonstrator or model farmers, 1 as referred to in this article, are those farmers that singly or jointly host educational activities conducted systematically on a portion of their land to demonstrate and popularise improved technologies or new practices, and provide an interface between research/extension and fellow farmers (Bhandari et al., 2022; Taylor & Bhasme, 2018). Non-demonstrator farmers, on the other hand, are fellow farmers made up of both participants (i.e., farmers who visited a model or demonstration farm) and non-participants of such farmer-to-farmer learning arrangements. Farm demonstration is essential as it is an efficient way to reach many farmers, particularly when it is led by fellow farmers (Pappa et al., 2018). Demonstrator farmers are instrumental to the demonstration’s effectiveness. Previous adoption studies have found that many farmers learn and adopt technologies and practices from attending farm demonstrations and observing farmer neighbours.
Despite the significant role of demonstrator farmers, a deeper understanding of the characteristics that distinguish demonstrator farmers from non-demonstrators is limited. While a plethora of adoption literature identified numerous factors that influenced farmers’ decisions to host a farm demonstration, little focus has been placed on investigating attitudinal factors and whether their effect differs between demonstrator and non-demonstrator farmers. Previous studies, for example, Hard et al. (2016), focused on demonstrators’ attitudes towards a given technology. Emerick and Dar (2017) examined other important characteristics of demonstrators without considering risk attitudes. The question that has remained unanswered is: Does being less risk-averse spur demonstrator farmers to put themselves in the frontline (which involves dedicating resources to trial a process that is expected) to produce visible results significant enough to convince fellow farmers? This article addresses this question by investigating whether risk attitude is an important attribute that distinguishes demonstrators from non-demonstrators.
The article also contributes empirically to the experimental literature on farmers decision-making by estimating risk preferences using two methodologies; first, determined by the variance of the lotteries and second, derived from estimating a utility function. In line with previous studies which relied on lab-in-the-field experiments to elicit decision-makers’ (DM) risk attitudes and linked the findings with real-life economic decisions, this article combines survey and experimental measures of risk preferences to meet similar objectives. The most important result in this article is that risk preferences (estimated by using both the variance and utility function methods) constitute a statistically significant and important predictor of whether farmers take up demonstration roles. Both results suggest that a decrease in risk aversion 2 increases the probability of being a demonstrator farmer.
1.2 Rationale for the Study and Justification for the Case
This article uses a case study of rice farmers in India to examine whether being less risk-averse is a credential for demonstrator farmers. Rice is an important staple food and export crop in India (Kumar et al., 2016; Malaiarasan et al., 2021; Parappurathu et al., 2014). However, there have been concerns over the years that the older varieties that farmers cultivate have relatively lower yields and are less stress-tolerant (see Siddiq, 2000). Therefore, to increase productivity and improve the rice farmers’ livelihoods, the Indian Council of Agricultural Research initiated the All India Coordinated Rice Improvement Project. However, despite the release of numerous improved rice varieties and institutional support, the consistent findings in the literature are that the adoption rates of these rice varieties are low (Budhathoki & Bhatta, 2016; Singh & Varshney, 2016).
The Directorate for Rice Research and the Ministry of Agriculture recognised the importance of demonstration and set up the front-line demonstration in 1990. While this demonstration method has shown promise, there are also drawbacks to upscaling, particularly as scientists directly led the planning, execution and monitoring of the farm demonstrations. In contrast, there is empirical evidence that on-farm demonstrations where farmers themselves take the lead (but receive support from researchers or extension agents) are more relatable to fellow farmers and, thus, more effective (Marchand et al., 2019). It could also be postulated that the challenges documented in the Indian context may be due to the focus being solely on the demonstration without paying any attention to the demonstrators’ characteristics.
The consideration of risk attitudes has not received much attention in the adoption literature (Gebreegziabher & Tadesse, 2014; Hamilton-Webb et al., 2017; Ranganathan et al., 2016). Specifically, among Indian farmers, risk attitudes—a potentially important characteristic influencing farmers’ decision to host demonstration plots—have been scarcely considered. However, when such information is lacking, the outcome of a well-intentioned demonstration may differ from expectation.
This article will interest extension practitioners who rely on demonstrator farmers to create awareness, encourage learning, or disseminate technologies. Similarly, agricultural researchers who need to bridge their output (i.e., new technologies or practices) with adaptation in representative field conditions will benefit from the findings in this study in demonstrator selection. The government will also benefit from the utilisation of low-cost services which farmer-led demonstration provides. Finally, it will also guide innovation dissemination programmes interested in understanding the characteristics of demonstrator farmers and provide the basis for rethinking previous reliance wholly on demonstrator farmers as the litmus test of farmers’ overall risk tolerance.
1.3 Theories behind Demonstration
Several theories provide the necessary framework for understanding the function of demonstrations. First, there are links between the theory of imitation (de Tarde, 1890) and demonstration. According to de Tarde, conscious or unconscious imitation is a cardinal interpersonal trait and the pre-requisite to social change. The theory propounded by de Tarde recognised the influence and role an individual socially closest to the source of the innovation played as a change agent in social systems. This theory served as one of the precursors of innovation diffusion research. Another relevant theory is the Social Learning Theory, which stipulates that observation, imitation and modelling are the basis through which individuals learn from each other. Thus, learning is not limited by a person’s experiences but also occurs by observing other people’s actions and the consequences of such actions. Unlike other traditional behavioural theories, the perspective from which social learning theory describes an individual’s behaviour is in terms of constant complementary interaction between behaviour and its environmental influences.
The Diffusion of Innovation Theory mooted by Rogers (1962) could lend a hand in highlighting the usefulness of on-farm demonstration. Rogers’ idea was that the adoption decision involves acquiring knowledge of the innovation, which is instrumental in persuasion and decision-making and subsequently implementing and appraising the effectiveness of the innovation. Further, the theory suggests that the DM, technology characteristics and social system are instrumental to the adoption decision. Overall, the premise of these theories that individuals learn by observing others and that learning within a social network is important highlights the significant role of demonstrator farmers and provides the foundation and justification for examining the characteristics that define these groups of farmers.
1.4 Previous Findings on Demonstrators’ Characteristics
Previous studies on demonstration have reported that the demonstrator’s characteristics are an important determinant of effective demonstrations. Seminal studies that compared the characteristics of demonstrators with fellow farmers (e.g., Bailey, 1965; Rogers & Leuthold, 1962) found that demonstrators differed from fellow farmers in several personal characteristics. Ingram et al. (2018) also reported that the demonstrator farmers’ characteristics are crucial in effective demonstrations, as they find that these characteristics influence the adoption of new technologies and practices in specific regions. According to Kumar (2014) and Franzel et al. (2015), the important characteristics of a demonstrator farmer include the number of years of farming experience, leadership qualities, communication and people skills, empathy and a good reputation and community status. However, the demonstrator’s attitude to risk, which could potentially drive the decision to host an on-farm demonstration, is not examined. The closest to this article is Chodavadia et al. (2013); however, their conclusion was based on descriptive statistics.
In the literature, suggestions and findings of how demonstrators can be optimally selected is not unanimous. Demonstrators may range from farmer volunteers to farmers selected on the basis of certain attributes or by considering certain factors. On the one hand, the selection process may be through collaboration between stakeholders and the host communities (Franzel et al., 2015). On the other hand, demonstrators are selected by the extension officer (Ben Yishay & Mobarak, 2019; Morss et al., 2019). Also, the process may take a more democratic approach where farmers collectively participate in selecting the farmer to host the farm demonstration (Emerick & Dar, 2020). There have also been cases where selection is based on wealth depending upon the scale of the demonstration. On the one hand, wealthier farmers can afford to allocate resources to demonstration plots. On the other hand, poorer farmers could be selected where the intent is to help them overcome the barriers to adoption (Mbure & Sullivan, 2017). While there are credible reasons for employing the different selection methods, the scarcity of empirical studies on demonstrators’ attitudes to risk (in addition to other farmer and farm characteristics) to inform the selection criteria implies that previous selection decisions are based on insufficient information.
In India specifically, demonstrator farmers range from the well-educated, relatively wealthier farmers, those who own more land or have leadership positions to those who are more representative of their fellow farmers with respect to their social and wealth status. The incentive of being a demonstrator farmer was mainly in the forms of tailored visits and support from extension officers, subsidised inputs and public recognition (Taylor & Bhasme, 2018). These farmers either volunteer or are mainly selected on the basis of their agricultural expertise and good standing within the community (Meena et al., 2016).
2. Materials and Methods
The two approaches employed in estimating risk preferences in this article are the variance of the lotteries in the experimental measure (discussed in the data section) and risk preferences estimated via the utility function.
2.1 Risk Preference Determined by Lottery Variance
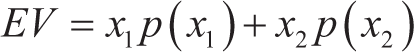
The variance of the lottery in this case refers to how large the mean deviation is between the payoffs of the lottery and its expected value (EV) specified as follows:

where x1 and x2 are two possible outcomes that denote the lower and higher payoff respectively, EV represents the expected value and p the probability of the respective payoffs. The EV of the lottery is given as:
In this case, if a DM picks a sure outcome (non-lottery), then the DM is categorised as extremely risk-averse. However, as the DM picks choices along the lottery spectrum, the DM is categorised ranging from being strongly risk-averse to risk-neutral depending upon the variance of the lottery.
2.2 The Expected Utility (EU) Model
This article employs a utility-based method, one of the ways in which risk attitudes are compared in the present study. The Expected Utility Theory (EUT) arguably is the benchmark theory of decision-making under risk and dominates the early decision-making literature. According to von Neumann and Morgenstern (1944), the EUT model is specified as:
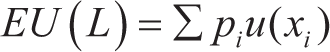
or in the case of just two payoffs,

where L is a lottery with probability pi and payoff x1 and u (.) is the utility function. Given any two lotteries where ≻ represents preference, it is assumed that L1 ≻ L2 if EU(L1) > EU(L2).
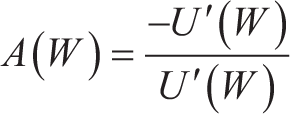
According to the EUT, the shape of the utility function determines the risk attitude. For a concave (convex) utility function, the DM is risk-averse (seeking), while a DM with a linear utility function is categorised as being risk-neutral. In estimating the utility function, several parametric forms have been widely used in the literature. The Relative Risk Aversion (RRA) and the Absolute Risk Aversion (ARA) [Arrow (1965) and Pratt (1978)] have been widely employed. The ARA defines the manner in which risk aversion changes with different wealth or income levels, while the RRA explains how risk aversion changes when risky prospects and wealth or income levels are changed by an equal proportion. Assuming a DM having a Bernoulli utility function, that is twice differentiable where W denotes income or wealth, then ARA and RRA are given as delineated in Equations (5) and (6), respectively.

Several classes of utility functions have been used in the literature for mathematical modelling of preferences. However, this article assumes a Constant Relative Risk Aversion (CRRA) utility function. In the CRRA utility function, a farmer has a constant aversion to a proportional loss of wealth even though the absolute loss increases. The CRRA is specified as follows:
For γ = 1, the utility function of CRRA is given by:

For γ > 0, the utility function of CRRA takes the form:
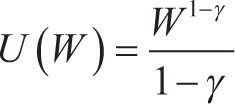
Here, the coefficient of relative risk aversion (γ) is the parameter of interest. The greater the value of γ, the stronger the risk aversion, that is, the farmer is risk-seeking if γ < 0, risk-neutral if γ = 0 and risk-averse if γ > 0. The preference for this function arises from the necessity of estimating only a single parameter. Besides, the CRRA tractability and behavioural plausibility compared to other utility functions and its suitability in representing subjects with similar characteristics as the farmers in this study justify its use (Verdone & Seidl, 2016).
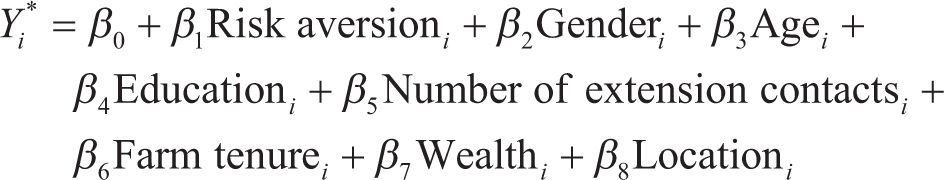
2.3 The Probit Regression Model
This article uses the cumulative standard normal distribution function Φ(•) to model the regression function; the binary response variable (Y) takes on the values of 0 and 1. The assumption is that

where Y is the dependent variable, β0 + β1X represents a quantile q and

in which case the probit coefficient β1 is the change in q due to a one-unit change in X. This article employs the maximum likelihood estimation (MLE) technique for estimating the probit model parameters. The specified probit Equation (15) assumed that the data were generated from a random sample having N size with a sample observation denoted by i, (i = 1, …, N). Thus,
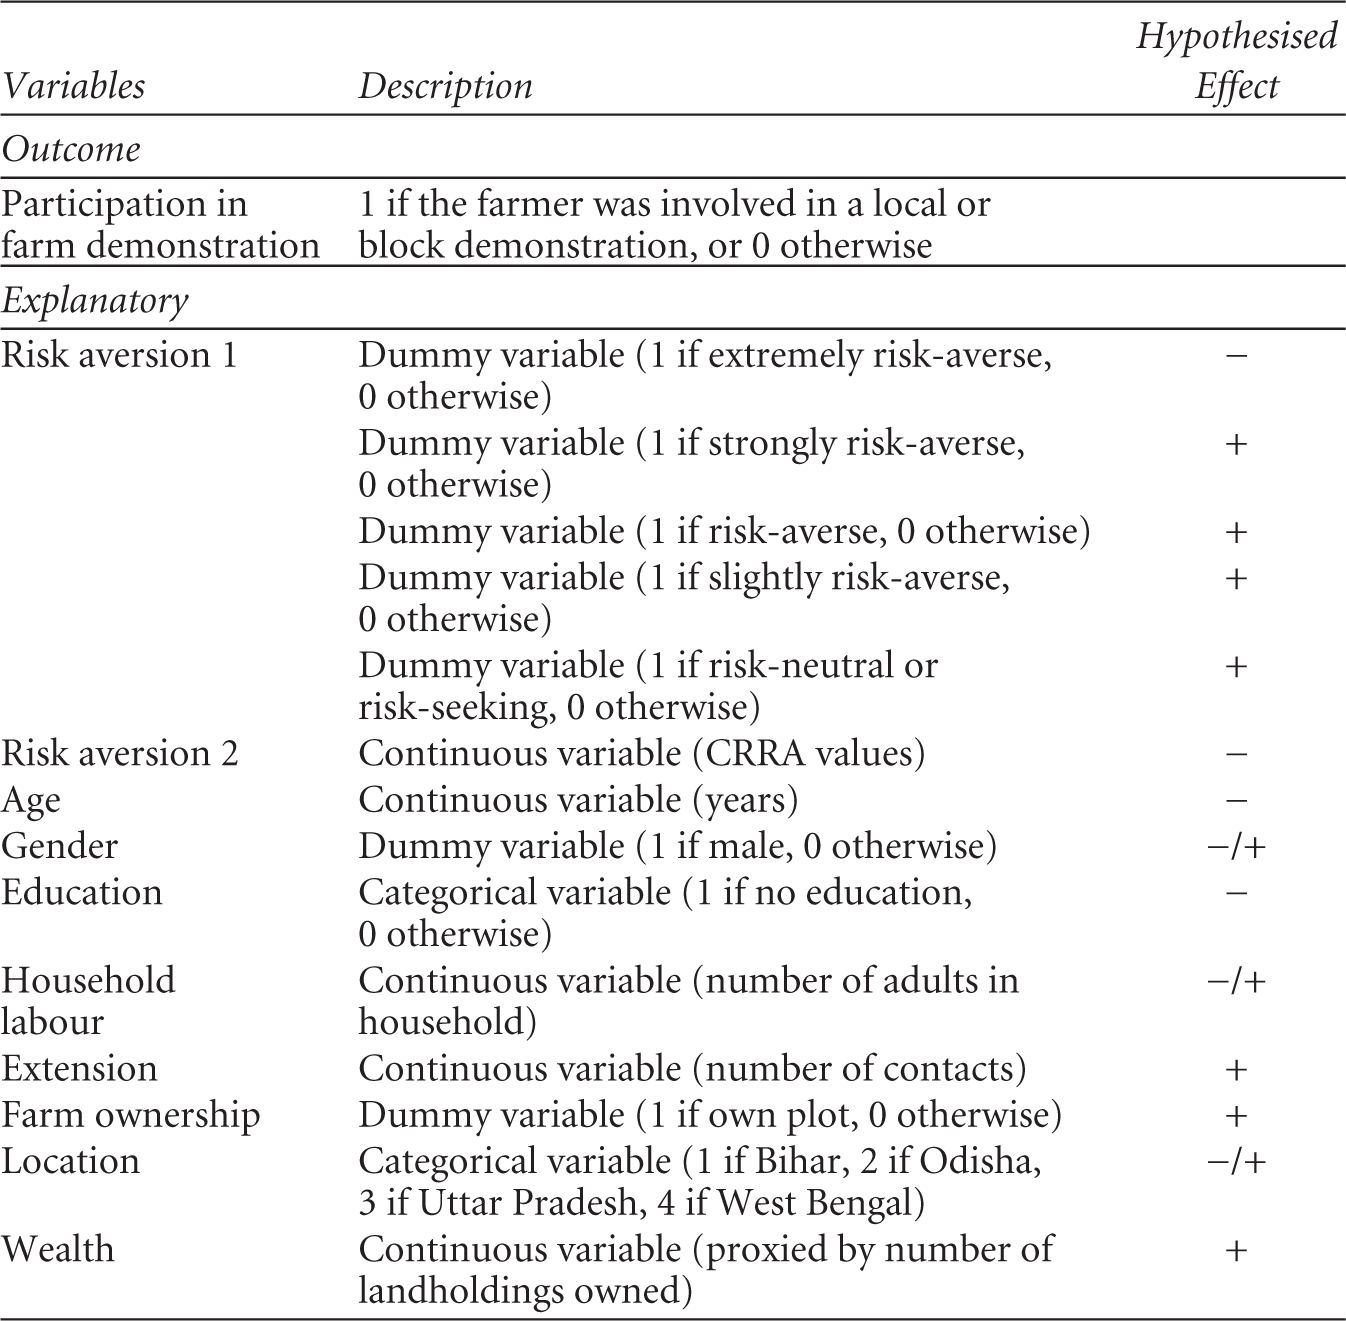
The description of the explanatory and response variables is presented in Table 1.
Description of Variables Used to Estimate the Probit Regression Model
2.4 Data
The data for this study are from the 2014 Rice Monitoring Survey-South Asia, a project implemented by International Rice Research Institute (IRRI) and supported by the Bill and Melinda Gates Foundation. The data are a representative survey across four States in India. The survey consisted of information on the characteristics of rice farmers and farms, rice varieties and information on field/block demonstrations. Although the sample consisted of 6,000 respondents, only 5,833 of these respondents were used in the empirical analysis. The reason as to why some respondents were excluded from the analysis was their incomplete responses.
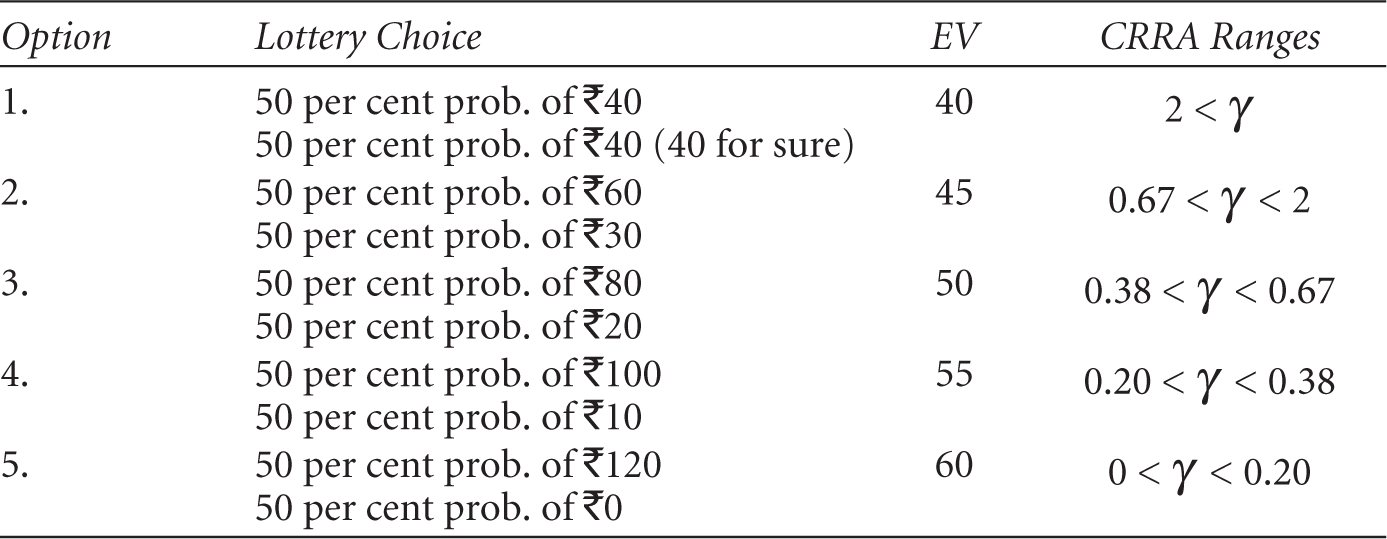
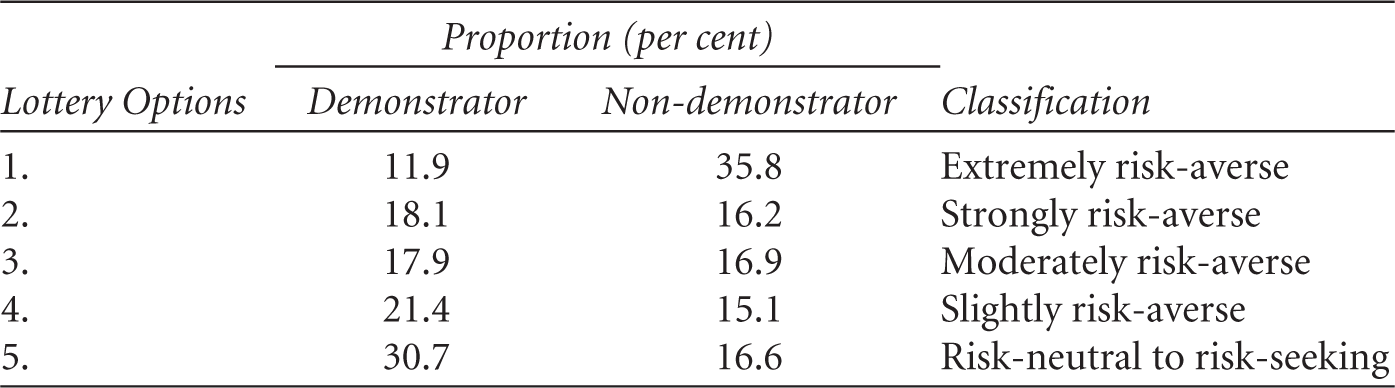
The Eckel and Grossman (2002) method used to measure risk preference was modified to fit the objectives for which the data were collected. Respondents were presented with five lotteries from which they chose one out of five 50/50 lotteries they preferred, as shown in Table 2. The options consisted of one option with a sure payoff and four lotteries having a 50 per cent chance of getting a low outcome and a 50 per cent chance of getting a high outcome. The first option offered a safe payoff involving a certain return with no risk, while lotteries 2–5 increased linearly in the expected payoff and risk. For instance, one of the risky options was a lottery consisting of a 50 per cent chance of getting ₹60 and a 50 per cent chance of getting ₹30. The Eckel and Grossman (2002) experiment is suitable for the subjects in this article as it is simple and easy to comprehend, and results in fewer inconsistencies in subject response.
As presented in Table 2, extremely risk-averse farmers would ‘give up’ the expected payoff to avoid variance by choosing the sure payoff over the lottery. A moderately risk-averse farmer would pick one among the intermediate options (2–4 in Table 2), while a risk-neutral or risk-seeking farmer would pick option 5. The advantage of the Eckel and Grossman method over other methods is that it is cognitively easier to understand, particularly among respondents with low numeracy skills, and produces good predictive accuracy.
Lottery Choices Used to Estimate Risk Aversion
3. Results and Discussion
3.1 Data Description
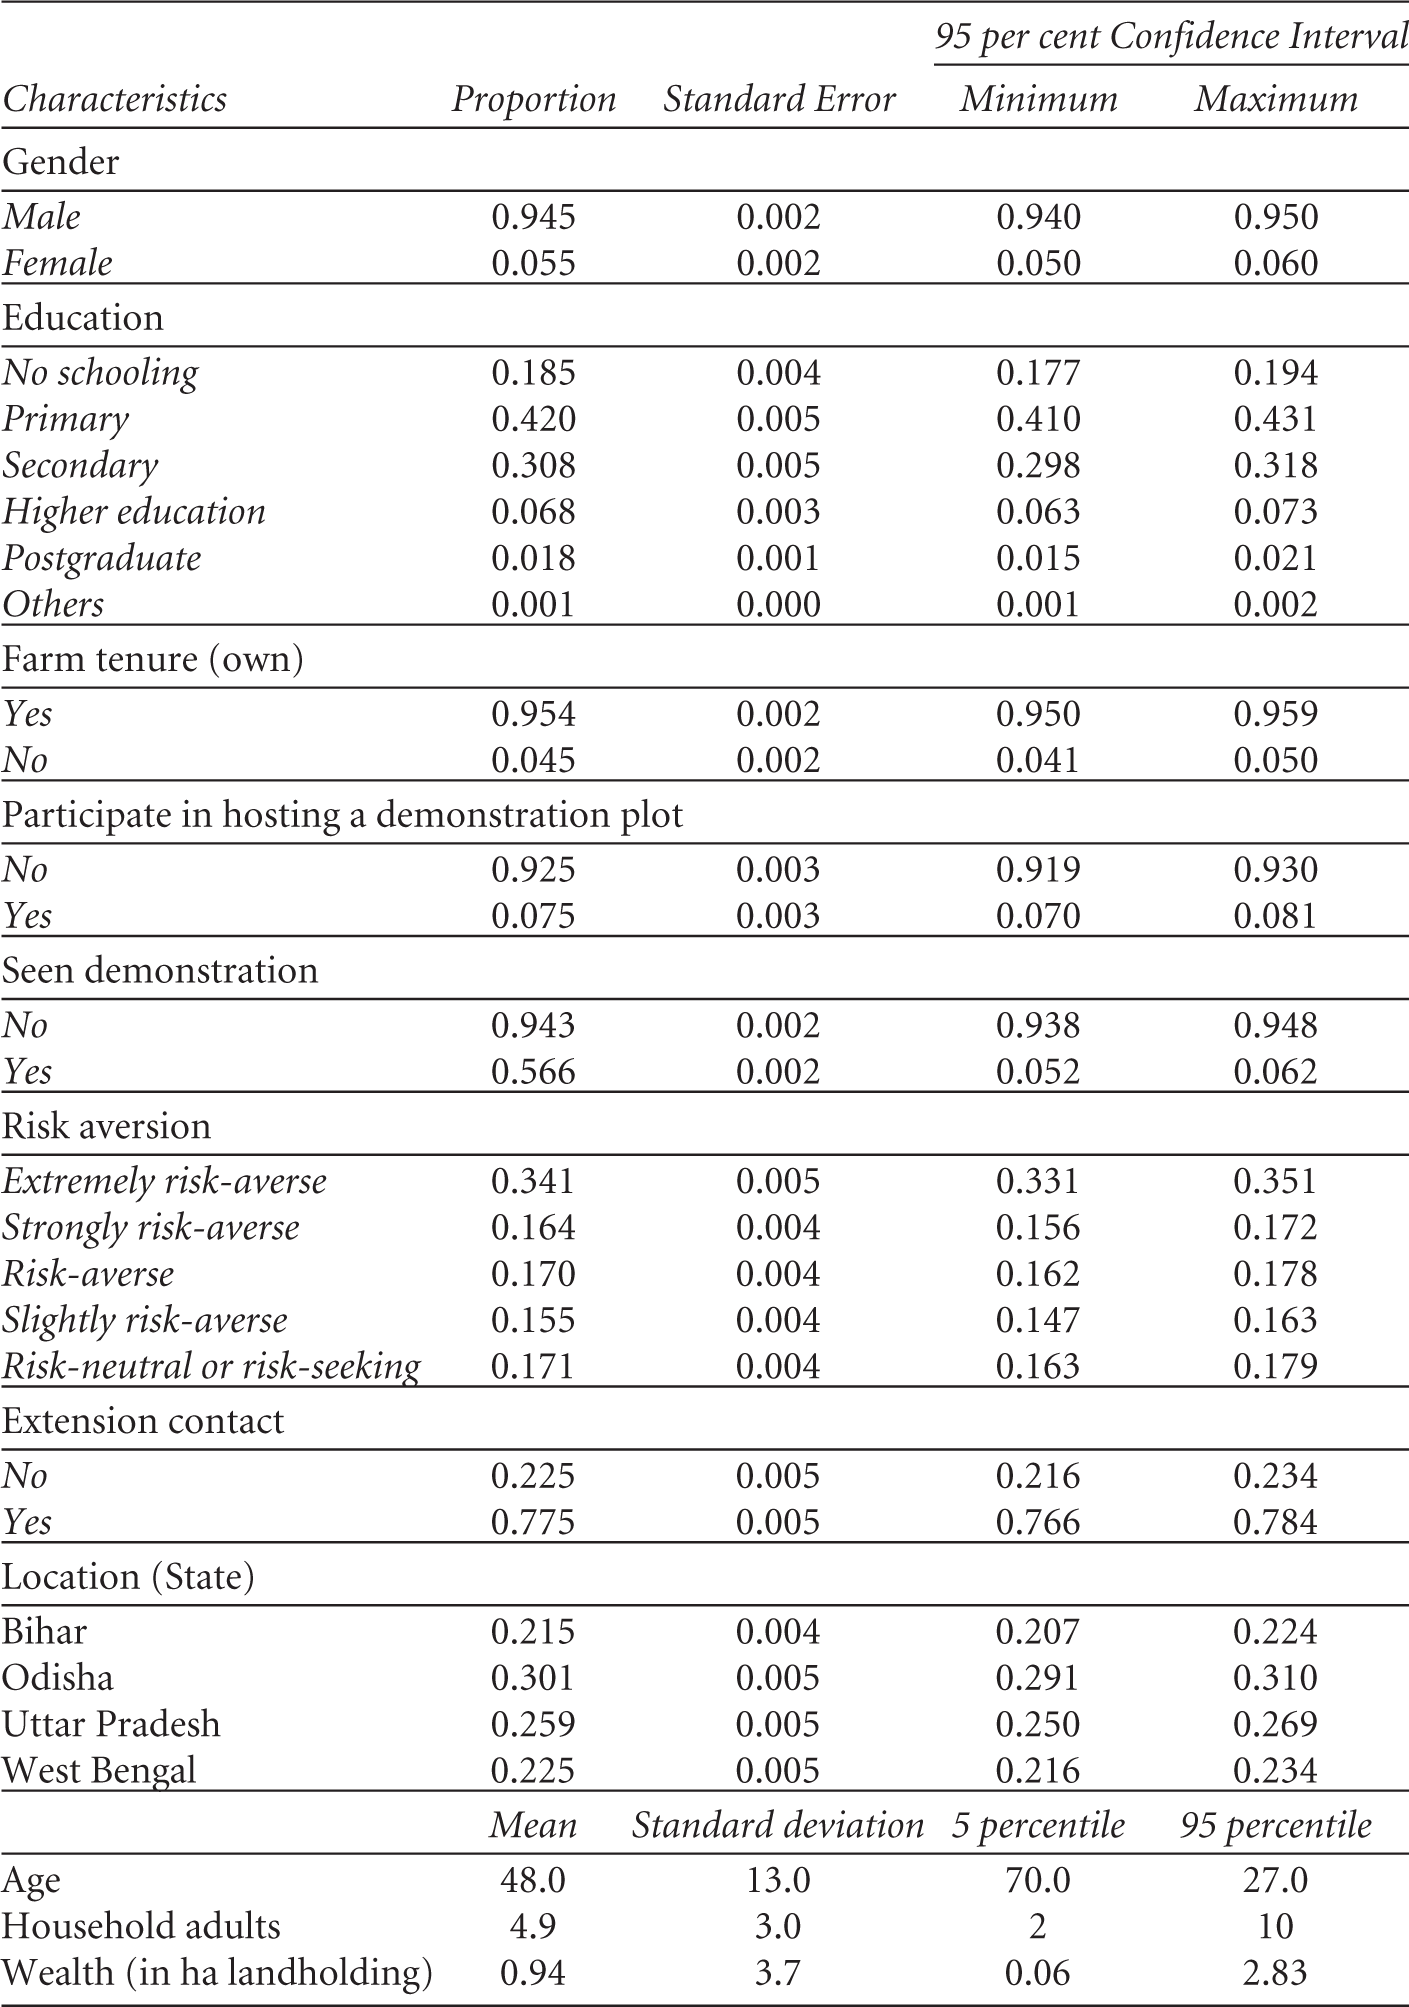
Table 3 describes the characteristics of rice farmers in the sample. The age range of respondents is between 18 and 96 years, with a mean age of 48 years. Most respondents, accounting for over 94 per cent of the total, are male. Among the respondents, 18 per cent reported no formal education. The average labour force proxied by the number of adults in the household was approximately five people. The proportion of farmers owning their plots is 59 per cent.
Descriptive Statistics of Subjects
Assuming that each farmer behaved according to the CRRA predictions, a farmer with γ > 0 is categorised as risk-averse, γ < 0 as risk-loving and γ = 0 as risk-neutral. However, since the lotteries described in this article do not incorporate a risk-seeking range, the following discussion is limited to γ > 0. As shown in Table 4, after disaggregating rice farmers into demonstrators and fellow farmers (non-demonstrators), the proportion of demonstrator farmers whose risk status spans various lower levels of risk aversion (as compared to extremely risk-averse status) is 88 per cent. This proportion, however, is lower (i.e., 64 per cent) for non-demonstrators. In other words, the results show that 12 per cent of the demonstrators will not take risks as compared to 36 per cent of the non-demonstrators. The test of whether the two groups differ significantly is significant at p < .05 (z = −20.9, p < .000).
Classification of Risk Tolerance Based on Estimation of Constant Relative Risk Aversion Coefficient (CRRA)
3.2 Probit Regression Results
Four models are estimated to determine the relationship between risk attitudes and farm demonstration hosting. The purpose of estimating these regression models was to evaluate whether the association between risk attitudes as an attribute of demonstrator farmers would be identified after accounting for other predictor variables. The independent variables representing risk preference in Models I and II were obtained by estimating the CRRA utility function. For Models III and IV, however, the risk tolerance variable was obtained from the variance of the lotteries. Models I and III had risk attitude as the sole independent variable, that is, they are restricted specifications of Models II and IV, respectively. The specifications addressed the potential problems of multicollinearity and confounding variables. Both Models II and IV included other relevant variables drawn from literature and related theories such as age, gender, number of adults in the household, and farm tenure.
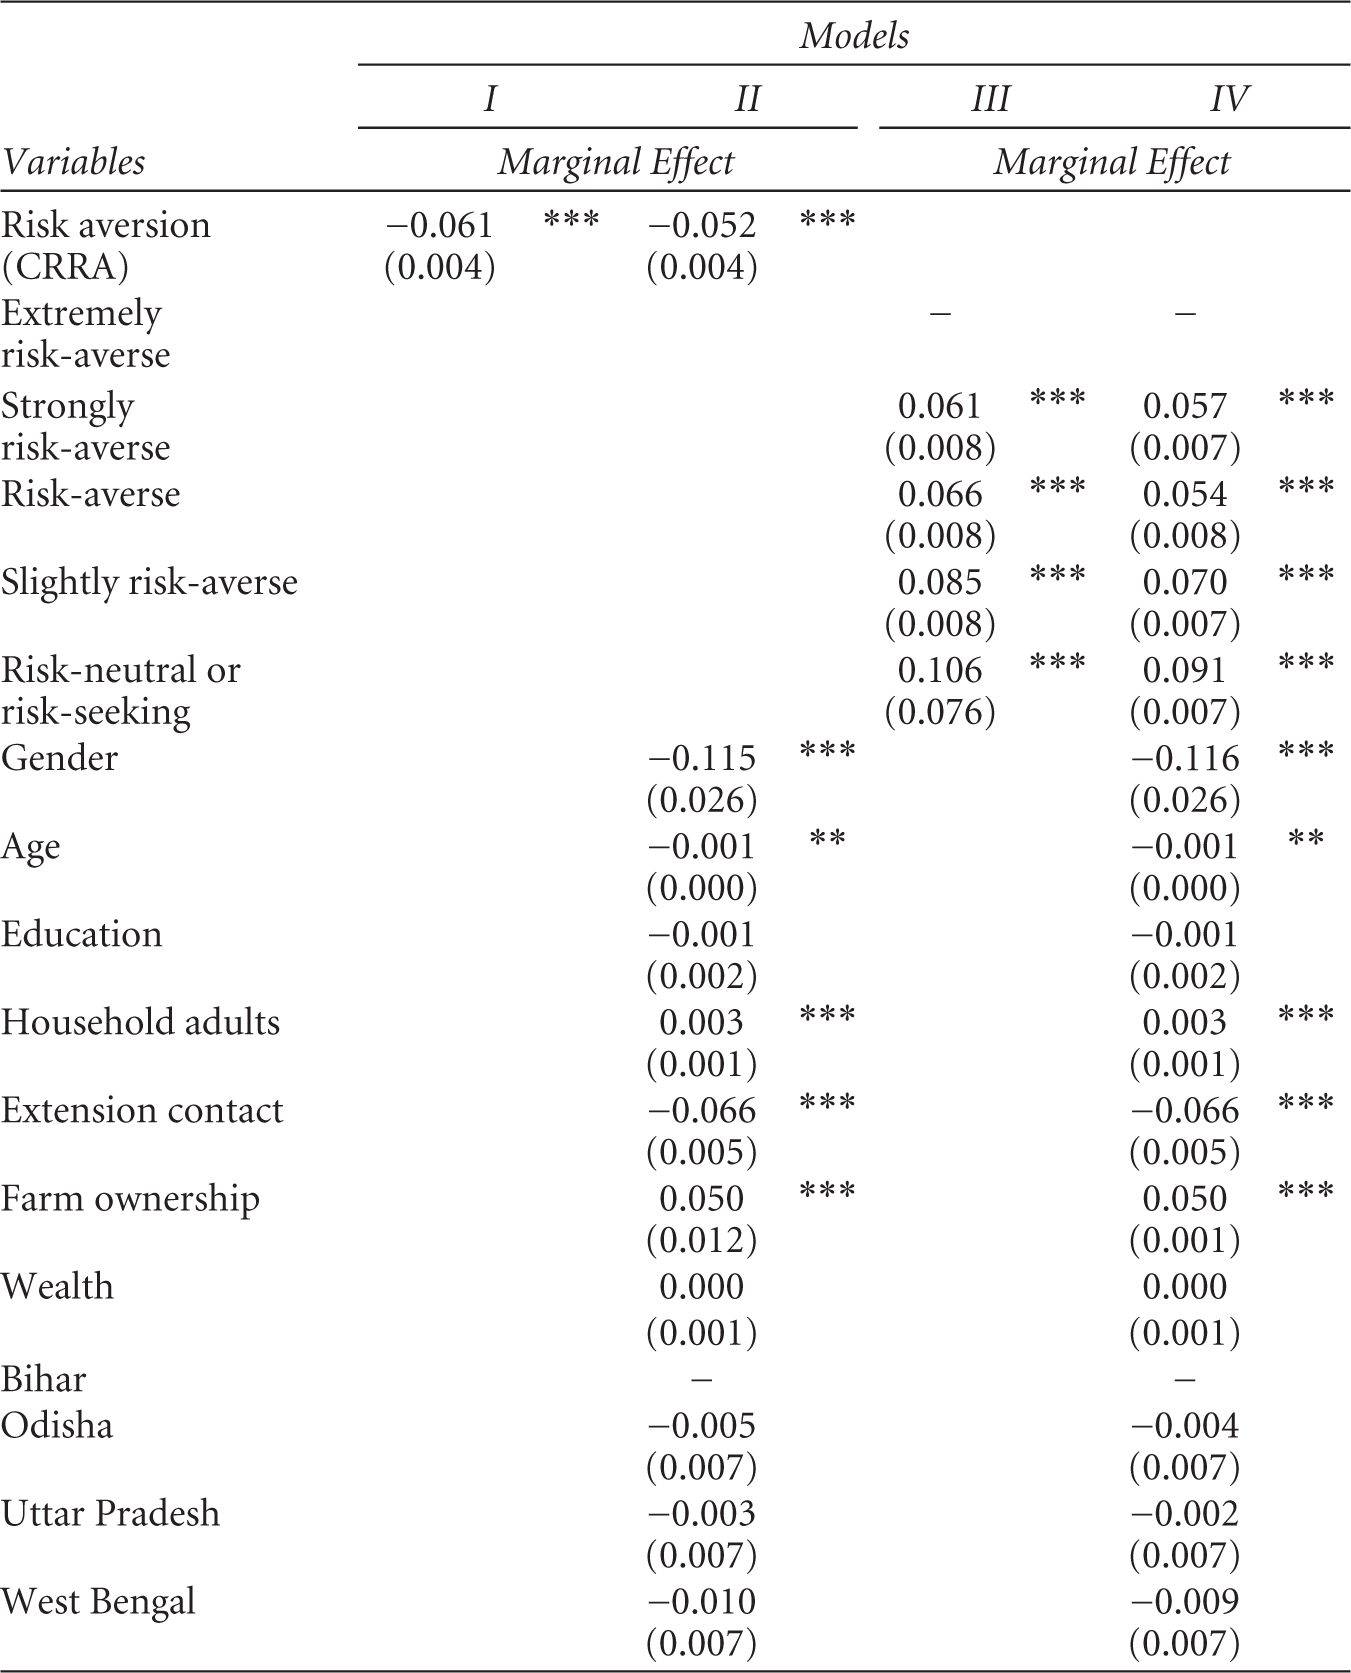
The results of the probit estimation are presented in Table 5. Risk aversion and several control variables, that is, gender, age, household size and farm ownership, align with a priori expectation and are significant at the 1 per cent level. Specifically, the level of risk aversion is an important attribute differentiating rice farmers’ hosting farm demonstrations from non-demonstrators. The coefficient of risk aversion (estimated by using the variance and utility function methods) is significant at a 1 per cent level for all the four reported models. The CRRA coefficient suggests that an increase in risk aversion significantly decreases the probability of the farmer being a demonstrator. Similarly, the risk-variance coefficients show that moderately risk-averse and risk-neutral farmers were more likely to be demonstrator farmers than extremely risk-averse farmers.
Probit Regression Results Estimating Risk Attitudes as Attributes of Demonstrators
Source: The author.
In order to get a better perspective, the marginal effects of the explanatory variables are reported in Table 5. For Models III and IV, which categorise risk attitude based on the lottery variance, the positive marginal effect implies that changes from extremely risk-averse to (the various categories of) moderate risk-averse/risk-neutral farmers increase the probability that a farmer hosts a demonstration plot by 5.4 percentage points at the least. Similarly, for Models I and II, which categorise risk attitude based on the CRRA, the negative marginal effect indicates that a unit increase in risk aversion decreases the probability that a farmer would be a demonstrator by 5.2 per cent.
Age had a significant negative effect on hosting a demonstration plot, suggesting that younger farmers are more likely to be demonstrators. The number of household adults (possibly a proxy for household labour) had a statistically significant and positive effect on hosting demonstration plots. Specifically, an increase in the number of household adults increases the probability of a farmer hosting a demonstration plot. The results in Table 5 also show a significant and positive relationship between gender and hosting farm demonstration. However, this finding is interpreted with caution, as this effect may be attributed to the skewed gender proportion. Farm ownership is positively related to hosting a demonstration plot, indicating that landowners are more likely to be demonstrator farmers as compared to tenant farmers. Farmers who reported frequent extension contacts were less likely to be demonstrator farmers. This may appear counter-intuitive; however, frequent extension visits may be misinterpreted by fellow farmers that the extension agent is responsible for the implementation of the farm demonstration. On the other hand, farmers requiring more frequent visits are more likely to need help to establish confidence either with understanding or acceptance of a new technology.
3.3 Discussion
Farmer demonstrators play a significant role in helping fellow farmers assess risks and encouraging technology adoption. Thus, effort needs to be targeted at understanding the characteristics of demonstrators, an important step towards ensuring that farm demonstrations are successful. The article investigated whether being less risk-averse is a credential for rice farmers’ hosting demonstration plots. The methodology employed in this article shows the practicability of combining surveys and experiments in measuring risk attitudes and linking the findings with other attributes that distinguish demonstrator farmers.
The findings in this article extend previous studies (e.g., Franzel et al., 2015; Kumar, 2014) that did not account for risk attitudes when examining the characteristics that set demonstrators apart from fellow farmers. The new evidence presented in this article that less risk-averse farmers are more likely to host demonstration plots is important for adoption studies. Demonstrator farmers host sites after assessing the risks associated with the innovation and are satisfied it is within their risk threshold. The implication is that while demonstrator farmers may tolerate the risks that accompany adopting innovations, the reverse could be the case for other fellow farmers. Therefore, relying on the fact that demonstrators are willing to try and possibly adopt new rice technologies and practices to draw conclusions that fellow farmers may follow suit could be misleading.
The small proportion of demonstrator farmers in the study areas possibly explains why the majority of farmers had not attended a demonstration session, implying that the demonstration potential of the region is not being used to its full potential. The consequence is evident in the considerably large adoption lags of new and improved rice varieties of approximately 12–20 years reported in Singh and Varshney (2016) and Bannor et al. (2020).
The relevance of this article in examining the differences between demonstrator and non-demonstrator farmers for extension is two-fold. First, selecting the ‘right’ demonstrator farmer is critical to the success of the demonstration. Good selection criteria are discussed later. Second, a better understanding of the factors influencing farmers’ willingness to host demonstration plots can improve demonstration effectiveness. Further, recognising the differences in risk threshold could help inform extension services of attitude-related obstacles, an important step in helping non-demonstrators overcome such barriers.
Regarding other variables, that is, age, gender, household labour and extension contacts, overall, the findings in this article corroborate the study of Chodavadia et al. (2013) comparing demonstrators and fellow farmers, which found that demonstrators differ in various socio-economic measures. This finding provides holistic information necessary for designing effective farm demonstrations and developing techniques to involve farmers as active participants in their diffusion.
Given that risk attitude influences the demonstrators’ decision to learn about innovations by observation, imitation and modelling, a contribution of this article is to provide empirical evidence that farmers do not just ‘imitate’ without a sense of self-control, but that each decision is dependent on cognitive functioning which the level of risk aversion may govern. Crucially, the methodology applied and demonstrated in this article also holds benefits for examining the attitudinal factors that drive hosting demonstrations of various agricultural innovations worldwide.
With respect to the recommendations on the factors to be considered when designing demonstrations and approaching potential farm demonstration hosts, the findings from this article are invaluable to various stakeholders. The article recommends that demonstrations should be designed to be flexible and consider heterogeneity in farmers’ risk attitudes. In addition, efforts should be targeted at lowering the risk threshold that accompanies new technologies and the effect of perceived risks on the farmers’ decision to try and then disseminate new technologies through farm demonstration. Further, it is important to ensure that farmers are aware of the range along which the potential outcomes vary during discussions ahead of implementing the farm demonstration. The smaller the range (i.e., if there is less variance), the more likely that it will be considered for demonstration. Crucially, some flexibility should be introduced, permitting farmers of different risk categories to choose facets that they are less risk-averse to try at first before progressing to other aspects that involve a higher risk threshold as long as this approach does not undermine the demonstration’s effectiveness.
While no single approach is suitable for use in all circumstances, informed criteria for approaching and selecting demonstration hosts can contribute to improving the demonstration. In selecting a demonstration host, it is necessary to consider that the level of risk they may be willing to take may differ if the farm demonstration activity is promoted by scientists, extension workers, or fellow farmers. Although the predominant preference is to select the ‘progressive farmer’ as a demonstrator, the current evidence in this article of systematic differences in risk attitudes suggests that certain categories of farmers are unintentionally likely to be side lined in the selection process. In contrast, an ‘atypical’ farmer demonstrator can be a good source of inspiration and spur the interest of many other farmers who may see them as a better reflection of themselves. It is important to recruit a range of host farmers to cater for heterogeneity in the risk attitudes of demonstration participants. This could be achieved by using simple techniques to appraise the risk attitudes of farmers in advance. Overall, any farmer who shows readiness to lead the process and takes responsibility for scaling up demonstrations should be assisted in overcoming any perceived risks that could serve as barriers to accepting to host a farm demonstration.
4. Conclusions
This article pays attention to demonstrator farmers and examines risk attitude as a determinant for rice farmers taking up demonstration hosting responsibilities. The article finds that risk aversion was an important distinguishing factor between farmer demonstrators and non-demonstrators. Furthermore, an increase in risk aversion decreases the predicted probability of being a demonstrator. This attribute possibly drives farmer demonstrators to try a process that is expected to produce visible results significant enough to convince fellow farmers to adopt rice technologies.
The implication for policy and practice arising from the findings from this study is as follows. There is a need to tailor interventions to accommodate heterogeneity in farmers’ risk attitudes, such as offering single-use incentives or support kits to minimise initial risk or introducing innovations that differ in ‘riskiness’. This will ensure that irrespective of the individual farmers’ risk attitudes, they can contribute to hosting a farm demonstration and aid the diffusion of innovation in the long run. Overall, by understanding farmers’ characteristics, stakeholders can give targeted advice, anticipate farmers’ decision to be farm demonstration hosts and, most importantly, adopt improved technologies or practices.
Despite this article’s notable contribution to theory, practice and the literature on agricultural demonstration, it is not without limitations. The Eckel and Grossman ordered lottery selection design elicits risk preferences that produce a coarser categorisation and the predictive accuracy is comparatively lower than that of other complex methods. In addition, it is prone to stake effects arising from changing payoffs and fixed probability weighting across all lotteries. However, this effect is minimal in the low stakes used in this article. This article makes no distinction between the rice varieties or technologies that were demonstrated but acknowledges that risk attitude may vary across the varieties available for demonstration, as studies have shown that risk attitude is content- and context-specific. The article also did not compare sustained adoption between demonstrators and non-demonstrator farmers or differentiate risk attitudes of the two categories of non-demonstrators (i.e., participants of demonstration and non-participants) gaps that motivate future research. Further research is also required to understand other important attributes (for instance, time preferences) of demonstrator farmers and extend similar research to understanding and consequently improving other crop and livestock demonstration exercises.
Footnotes
Declaration of Conflicting Interests
The author declared no potential conflicts of interest with respect to the research, authorship and/or publication of this article.
Funding
The author received no financial support for the research, authorship and/or publication of this article.
Availability of Data and Material
The datasets used in this study are available in the IRRI Farm Household Survey Database, http://ricestat.irri.org/fhsd/php/panel.php?page=1), [Grant Number: Rice Monitoring Survey in South Asia].