
Abstract
Background:
T1 Dixon sequence acquisition can help in getting multifold structural information in cases of sacroiliitis in axial spondyloarthropathy (axSpA). Herein, we aim to assess the diagnostic accuracy of multipoint T1 Dixon imaging in patients of sacroiliitis in axSpA.
Methods:
Observational cross-sectional study was carried out over a period of 18 months on a total of 33 participants. T1-weighted multipoint Dixon sequence was added to routine protocol. Subchondral fatty metaplasia, subchondral sclerosis, backfills, erosions and ankylosis were analysed by two observers with ten years and four years of experience. Contrast-to-noise ratio and Comprehensive Berlin Method (CBM) of fatty lesions and CBM of erosions were calculated.
Wilcoxon test and Bland–Altman plots were used to assess the CNR and CBM values. P value of < .05 was considered statistically significant.
Results:
T1 Fat-only Dixon images and conventional T1-weighted imaging (T1WI) showed statistically significant agreement (Cohen’s kappa = 1.000, P = < .001) with 100% diagnostic accuracy for detecting fatty lesions, erosions and sclerosis without any interobserver variation. The sensitivity of T1 Dixon fat-only images was higher for picking up the backfills, 29 cases (87.9%) by conventional T1WI and 32 cases (96.9%) by Dixon. The mean (±SD (standard deviation)) of the difference between the CNR of fatty lesions was 57 (±61.7), and the CBM of erosions was 3.00 (±1.86), which were statistically significant (Wilcoxon test: V = 151.5, P = < .001, t = −9.835, P = < .001 and V = 0.0, P = < .001 respectively).
Conclusions:
T1W multipoint Dixon can be used as a routine sequence to evaluate and follow up structural changes in cases of axSpA.
Keywords
Introduction
Axial spondyloarthropathy (axSpA) comprises a group of chronic inflammatory seronegative diseases. The sacroiliac joints (SIJs) are often involved in most cases of axSpA, with sacroiliitis being the classic diagnostic radiological hallmark. 1
Most of the cases of axSpA on imaging present with features of active as well as chronic disease. The characterisation and quantification of not only the active inflammatory features of sacroiliitis but also the chronic structural changes, are of paramount importance. The conventional radiographs are not sensitive in picking up these structural changes. Although computed tomography (CT) may be considered gold standard for bony structural changes, there is a significant risk of radiation exposure, especially in patients requiring frequent follow-up.
In routine imaging protocols, the conventional T1-weighted imaging (T1WI) is used to assess the structural changes. Newer hybrid chemical shift-based techniques, such as the Dixon technique, unlike other fat suppression techniques, allow the signal of fat to be suppressed in the post processing rather than acquisition stage, providing us with fat and water distribution maps along with better signal-to-noise ratio (SNR). 2 Till date many studies have been published utilising T2 Dixon in imaging of sacroiliitis; however, T1WI can better characterise the structural changes like erosions, backfills, and fatty lesions. Herein, we aim to assess the diagnostic accuracy of multipoint T1 Dixon imaging in patients of sacroiliitis in axSpA.
Materials and Methods
Study Design and Population
This observational cross-sectional study was carried out over a period of 18 months in the department of radiodiagnosis of a tertiary care apex referral hospital in New Delhi, India, after taking due permission from the institutional ethical committee. A total of 33 participants of age 18-45 fulfilling the inclusion criteria, referred from the department of medicine with nontraumatic inflammatory back pain, were included in the study after taking written informed consent. Patients who fulfilled the inclusion criteria were then subjected to magnetic resonance imaging (MRI) of the SIJ.
MRI Sequences
The MRI examination of SIJs was carried out on 3T MR, GE discovery MR750W, with the use of a dedicated phased array body coil. A T1-weighted multipoint Dixon sequence with four images—water only, in-phase, opposed phase, and fat-only—was added to the routine protocol and performed with the same slice thickness and intersection gap (i.e., field of view (FOV): 250 mm, matrix size: 256 ´ 256, slice thickness: 4 mm, and interslice gap: 0.8 mm) in the coronal oblique plane parallel to long axis of sacrum.
MRI Image Analysis
All MRI sequences were reviewed for qualitative and quantitative assessment by two independent observers with ten years (observer 1) and four years (observer 2) of experience.
Qualitative Analysis
Subchondral fatty deposition, subchondral sclerosis, backfills, erosions and ankylosis were analysed in the scope of this study and were defined by the Assessment of SpondyloArthritis international Society (ASAS) criteria. 3
Subchondral fatty deposition was defined as areas of increased signal on T1WI or T1 Dixon fat-only image in a para-articular location within the bone marrow either on sacral or iliac side.
Subchondral sclerosis was defined area of T1/T2 and T1 Dixon hypointensity in the subchondral bone with maximum thickness of more than 5 mm.
Erosions were scored on T1W and T1 Dixon fat-only image and were defined as areas of low signal intensity at subchondral plate with clearly visible cortical break on at least two adjacent slices.
Backfills were defined as increased signal in the intraarticular location with adjacent cortical bone loss area, clearly demarcated from the adjacent normal marrow by irregular dark signal.
Ankylosis was defined as the presence of bony or bone marrow bridges across the SIJ on T1 and all Dixon images mainly seen along the anteroinferior synovial aspect.
Quantitative Analysis
Contrast-to-noise ratios (CNRs) of fatty lesions in all patients were calculated on T1WI and T1 Dixon fat-only images using the following formula:

where
MeanL is the mean signal intensity of the lesion
MeanBM is the mean signal intensity of the normal-appearing bone marrow near the lesion, and SDair is the SD of the signal intensity of the airspace free of artifact and close to the site of previously obtained signal-intensity measurement.
The signal intensities were measured in the largest lesion. A region of interest (ROI) of ≥5 mm in diameter was drawn, which was copied to the same corresponding location on all images to measure mean signal of the lesion as well for the SD of the signal intensity of air space, thereby reducing the errors in measurement.
Evaluation Using CBM Score
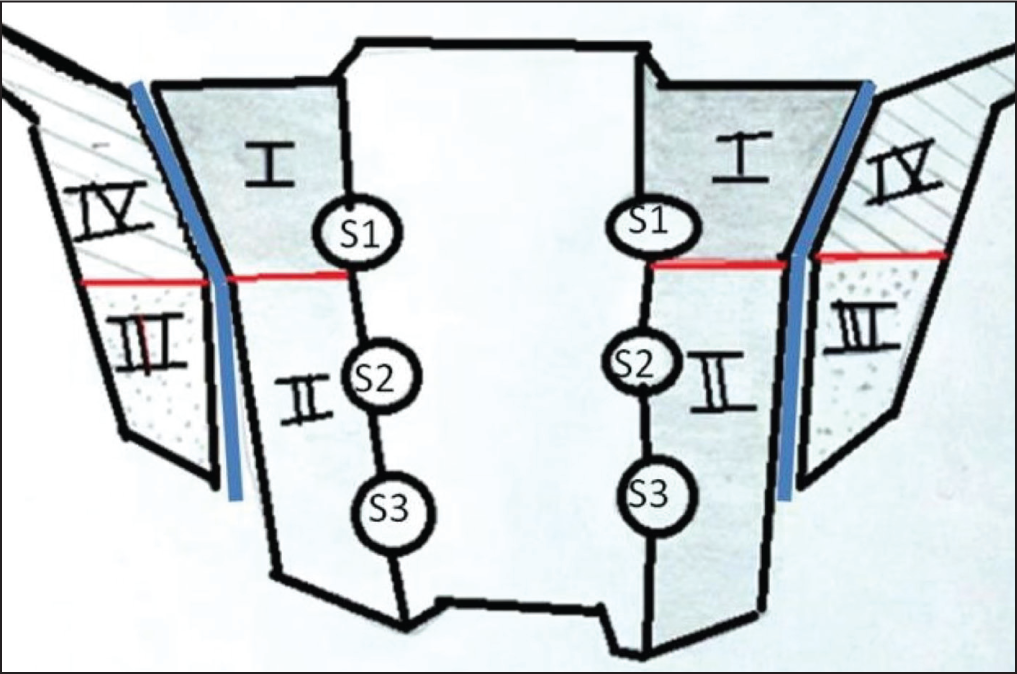
For evaluating the fatty lesions and erosions using Comprehensive Berlin Method (CBM), 4 one SIJ was divided into four quadrants, separating the medial(the sacral part of the joint) from the lateral (the iliac part of the joint) and the anterosuperior part from the posteroinferior part of the SIJ using a fictional horizontal line along the bottom of the first sacral neural foramina (Figure 1). Accordingly, per patient, eight quadrants were evaluated quantifying the number of erosions and fatty lesions from 0 to 3 (0: no erosions, 1: ≤ 33%, 2: 33%–66%, 3: > 66% of the bony joint surface in the respective quadrant). The sum score of all the eight quadrants yielded the CBM score, the range of it being from 0 to 24.
Schematic Diagram of Coronal View of the Sacroiliac Joint Showing Division of the Joint on Each Side into Four Quadrants, Separating the Medial (the Sacral Part of the Joint I and II) from the Lateral (the Iliac Part of the Joint III and IV) by Joint Line (Blue Lines) and the Anterosuperior Part from the Posteroinferior Part Using a Fictional Horizontal Line (Red Lines) Along the Bottom of the First Sacral Neural Foramina.
Statistical Analysis
Categorical variables were presented in number and percentage (%) and continuous variables were presented as mean ± SD and median. Normality of data was tested by Kolmogorov–Smirnov test. If the normality was rejected, then nonparametric test was used. Quantitative variables were compared using paired t-test/Wilcoxon rank-sum test (when the data sets were not normally distributed) between the two methods. A P value of < .05 was considered statistically significant.
Results
The mean (±SD) of age (years) was 31.19 (±7.19). The median (±IQR (interquartile range) of age (years) was 31.00 (±27-36). The age (years) ranged from 18 to 44. The most common symptom was low back pain, raised erythrocyte sedimentation rate (ESR) seen in 30 (90.9%) patients at the time of MRI with 32(96.9%) patients showing bilateral symmetrical involvement.
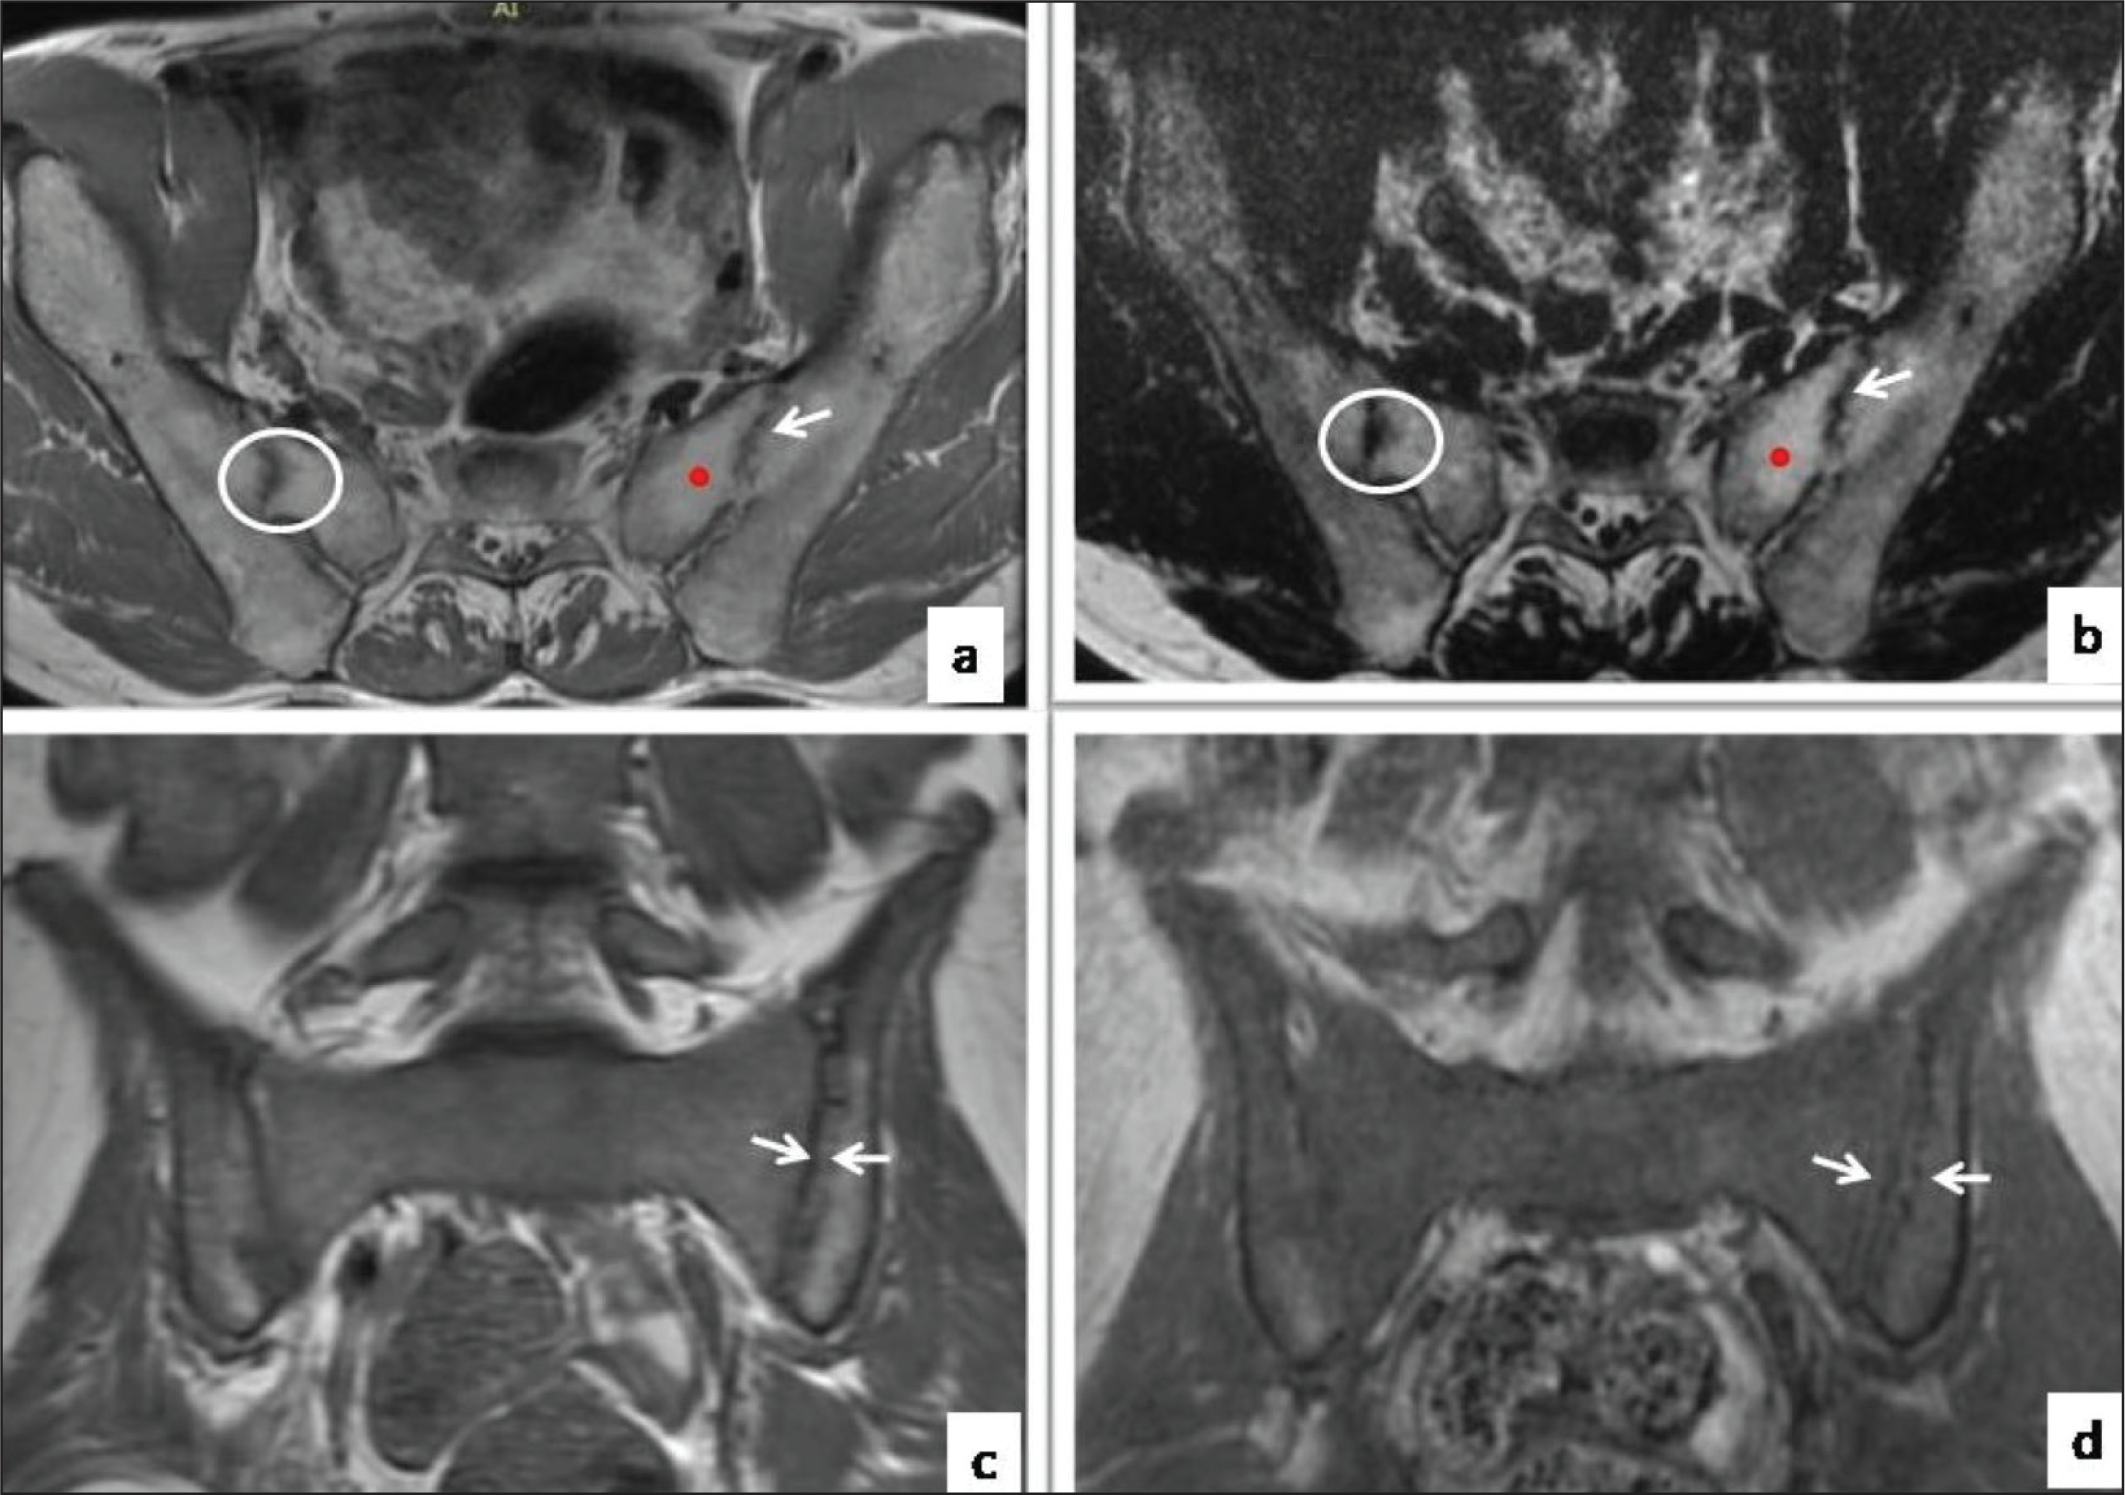
Subchondral fatty deposition was seen in 29 cases (87.9%) on both T1WI (Figure 2a) and T1 Dixon fat- only images (Figure 2b). Subchondral sclerosis was seen in 28 cases (84.8%) on both T1WI and T1 Dixon fat-only images. Erosions were seen in 33 cases (100.0%) on both T1WI and T1 Dixon fat-only images. Bony ankylosis was seen in 23 (69.6%) cases and was absent in 10 (30.4%) cases. T1 Fat-only Dixon images and conventional T1WI showed near perfect agreement between the two methods, and this agreement was statistically significant (Cohen’s kappa = 1.000, P = <.001) with 100% diagnostic accuracy for detecting fatty lesions, erosions and sclerosis. The sensitivity of T1 Dixon fat-only images was higher for picking up the backfills, seen in 29 cases (87.9%) by conventional T1WI (Figure 2c) and 32 cases (96.9%) by T1 Dixon fat-only images (Figure 2d). There was 96.3% agreement for picking up ankylosis between both the T1 fat-only Dixon images and conventional methods. No interobservor variation was observed in picking up the erosions, fatty lesions and subchondral sclerosis on either conventional or Dixon images. There was slight interobservor variation in picking up the bony ankylosis, with one (3.7%) case being reported as presence of ankylosis by observer 2 and absent by observer 1.
Conventional T1WI (a) and Fat Only T1 Dixon Image (b) Showing Fatty Metaplasia (Red Dot), Subchondral Sclerosis (White Circle) and Bony Ankylosis (White Arrow). Conventional T1WI (c) and Fat Only T1 Dixon Image (d) Showing Backfills (Between White Arrows). The Lesions Are Well Demarcated and More Clearly Seen on the Dixon Images.
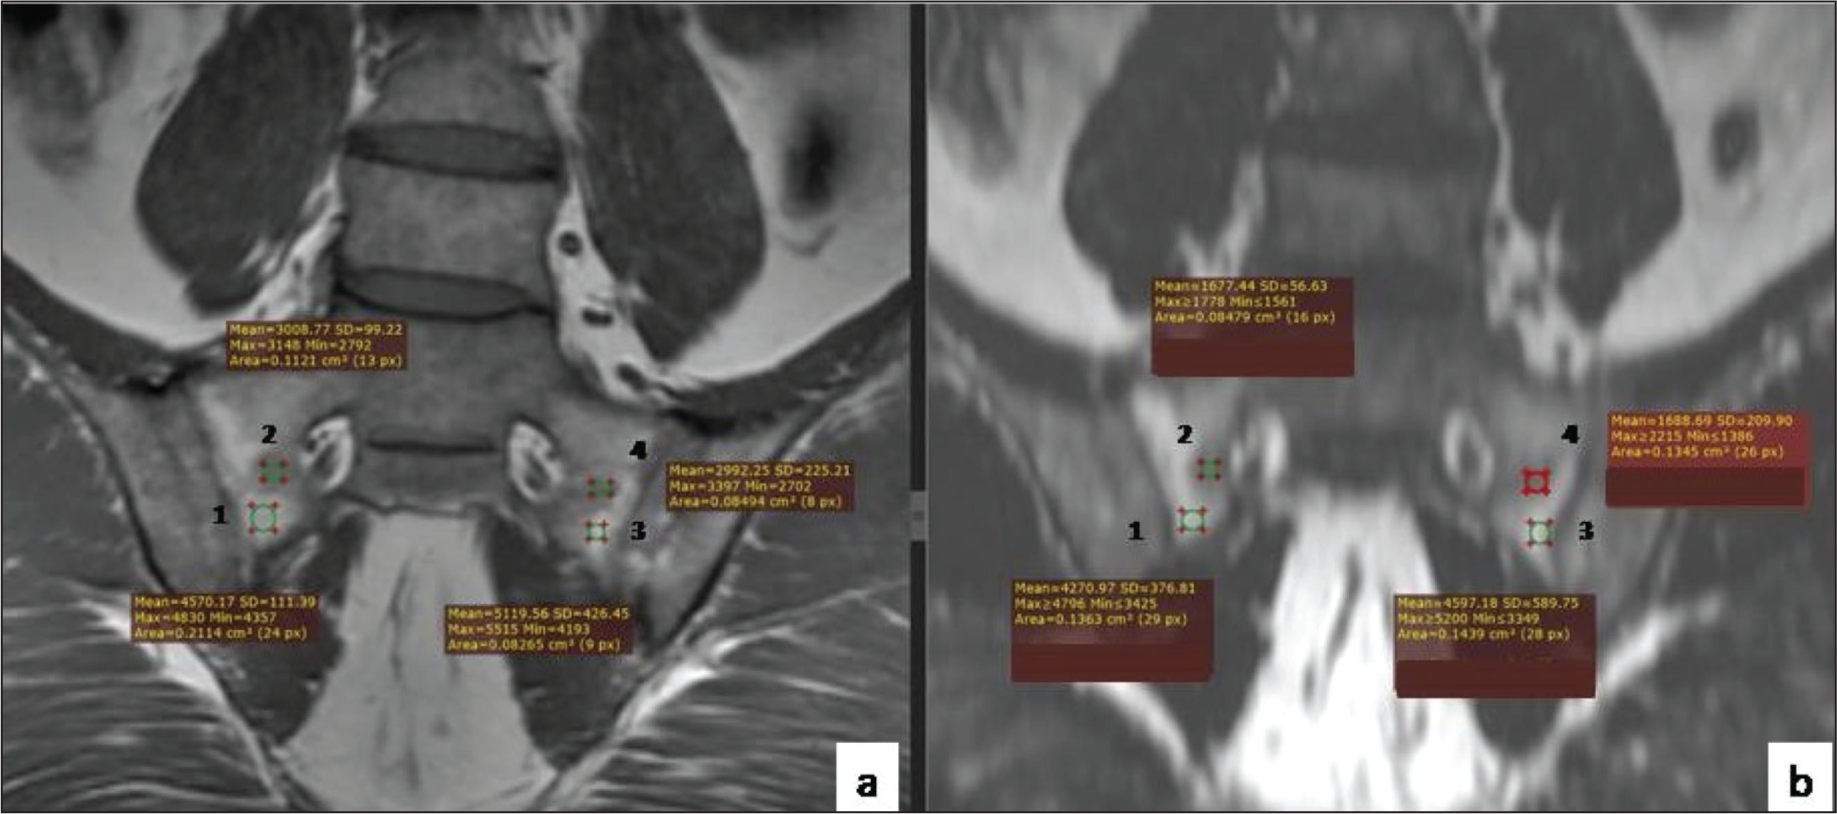
The mean (±SD) of CNR of fatty lesions (conventional) (Figure 3a) was 101.73 (±30.34) and that of CNR of fatty lesions (Dixon) (Figure 3b) was 159.33 (±72.07). The mean (±SD) of the difference between the two was 57 (±61.7), which was statistically significant (Wilcoxon test: V = 151.5, P = <.001) with Bland–Altman plot (Figure 4a). There was a moderate correlation between CNR of fatty lesions (conventional) and CNR of fatty lesions (Dixon), and this correlation was statistically significant (interclass correlation coefficient = 0.38, P = <.001).
Conventional T1WI (a) Showing ROI Selection in the Fatty Metaplasia Areas (1 and 3) and Adjacent Normal Bone Marrow (2 and 4) on Right Side (1, 2) and Left Side (3, 4) Which Are Cloned to the Fat Only T1 Dixon Image (b) Images for the Calculation of CNR.
Bland–Altman Plot for the Difference Mean (±SD) of CNR of Fatty Lesions (a) and Difference Mean (±SD) of CBM of Fatty Lesions (b) by Conventional T1WI and Fat Only T1 Dixon Images. (c) Bar Graph Depicting the Mean (±SD) of CBM of Erosions by Conventional T1WI and Fat Only T1 Dixon Images.
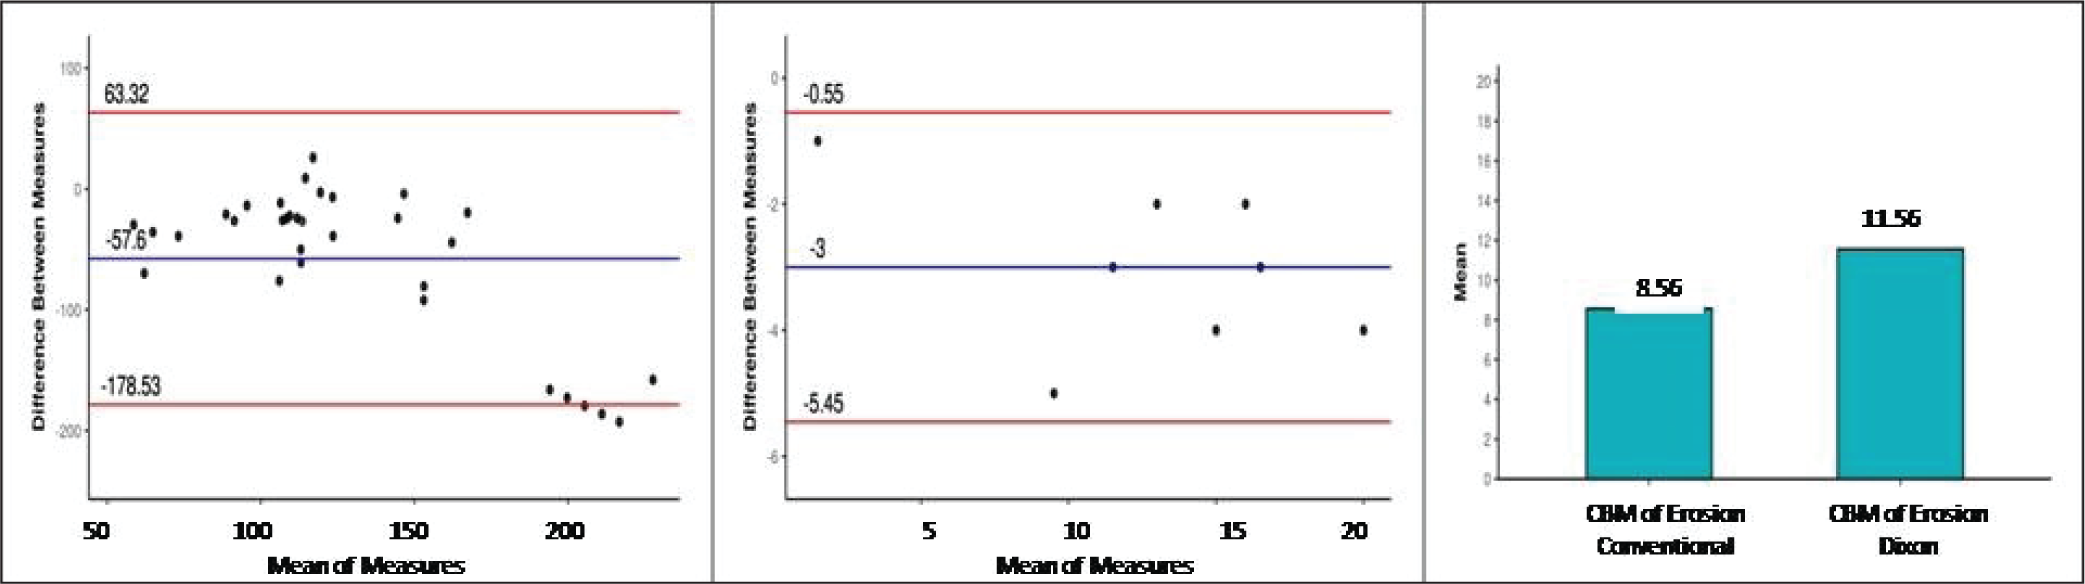
The mean (±SD) of CBM of fatty lesions (conventional) was 11.38 (±5.13) and that of CBM of fatty lesions (Dixon) was 14.38 (±5.66). The mean (±SD) of the difference between the two was 3.00 (±1.25) and this difference was statistically significant (t = −9.835, P = <.001) with Bland–Altman plot (Figure 4b).
The mean (±SD) of CBM of erosions (conventional) was 8.56 (±4.73) and CBM of erosions (Dixon) was 11.56 (±5.98) (Figure 4c). The mean (±SD) of the difference between the two was 3.00 (±1.86), which was statistically significant (Wilcoxon test: V = 0.0, P = <.001).
Discussion
axSpA is a subset of spondyloarthritis, which mainly involves the spine and the SIJs. Delayed diagnosis and treatment can lead to irreparable structural changes that can significantly hamper the quality of life and patient’s mobility, as demonstrated by a study done by Reddy et al. in 2014 on a cohort of 100 patients. 5
Clinical biomarkers, such as ESR, may be helpful in the diagnostic evaluation of axSpA, but it normalises once the active process stops or if the patient enters into remission. 6 In our study, at the time of imaging, close to 91% patients had raised ESR, with mild elevation of ESR seen in the patients with chronic symptoms (>3 years).
MRI has become the gold standard for not only diagnosing the inflammatory and the structural changes in cases of axSpA but also monitoring the treatment response. As there are no reliable serum biomarkers for tracking the progression of disease, 3 MRI features serve as a biomarker of disease activity. 1 In our study, about 90% of the patients showed features of chronic sacroiliitis like fatty lesions, erosions, backfills and sclerosis. The multipoint Dixon method was superior to conventional imaging in detecting subchondral fat depositions and erosions on both qualitative and quantitative assessment as done by calculating the CNR and CBM of the lesions.
Similar findings were also observed by Allam et al., 7 where they found that T1-Dixon method was better in quantifying the structural changes in the sacroiliitis. This can be attributed to excellent homogeneous background suppression along with good SNR of fat components in the fat-only Dixon images. In our study, the SD air on conventional sequences was found out to be 12.4 and that on Dixon sequences was approximately 5.5, suggesting that Dixon sequence has less background noise, that is, lesser artefacts as compared to the conventional sequences. Similar findings were observed by Özgen A 8 in which the SD of signal intensity of airspace free of artefact in Dixon sequence was significantly less than that on conventional sequences. However, they compared features of sacroiliitis on T2-weighted multipoint Dixon with conventional MRI.
We also found that the sensitivity of T1 fat-only Dixon images was higher than that of conventional MRI for picking up the backfills. Studies have postulated that backfill formation is an intermediary step between fatty metaplasia and new bone formation.6,9 A study by Gezer and Duruöz also found that there is a positive correlation between the structural changes and disease activity. 9 Therefore, early pick up of backfills will further help in improving the management.
In our study, eight patients with low ESR values had higher CBM scores for structural changes. They were counselled regarding their structural disease and a significant improvement in drug compliance was observed on follow-up. Six patients, who had pain with mildly elevated ESR but a higher CBM score; previously on nonsteroidal anti-inflammatory drugs (NSAIDs; etoricoxib) and sulfasalazine, underwent modification in the drug regimen. The dose of sulfasalazine was increased from 500 mg to 1 g (Saaz-DS tablet) in two patients. Four patients who were already on double-strength dose of sulfasalazine were started on immune modulators (adalimumab injection once in 15 days for 3 months), with improvement in clinical symptomatology.
No significant interobserver variation was seen in picking up the structural changes by T1 multipoint Dixon technique. The quantitative analysis by the same can remove the subjective bias and therefore can be used even by the less experienced radiologists for an accurate diagnosis, speeding up the patient management.
Our study was done with a limited sample size primarily focusing on the structural changes. A further study with a larger sample size, also correlating the clinical disease activity with quantitative parameters, would be helpful.
Conclusion
In conclusion, the T1-weighted multipoint Dixon method can be used as a routine sequence to evaluate and follow up the cases of axSpA and the findings may be used as imaging marker to assess and quantify structural changes. Early pick up of certain structural lesions like fatty metaplasia and backfills can play a significant role in halting and curtailing the new bone formation in patients with chronic symptoms, with an overall better patient management and prognostication.
Footnotes
Authors’ Contributions
S.A. performed the MRI and wrote the initial manuscript.
R.J., J.G. and Sr. S.G. conceived the study, contributed to interpretation of results and edited the manuscript.
Declaration of Conflicting Interests
The authors declared no potential conflicts of interest with respect to the research, authorship and/or publication of this article.
Ethical Approval
Due permission from the institutional ethical committee (S. No. IEC/VMMC/SJH/Thesis/2020-11/CC-292) was taken.
Funding
The authors received no financial support for the research, authorship and/or publication of this article.
Patient Consent
Patient consent was taken.