
Abstract
Aim:
To evaluate the effectiveness of diffusion-weighted imaging (DWI) and apparent diffusion coefficient (ADC) mapping in diagnosing active sacroiliitis in patients with axial seronegative spondyloarthropathy (SpA).
Material and Methods:
This prospective study comprised 26 patients with MR imaging detected active sacroiliitis categorised as a case group, and compared them with healthy controls. ADC value measurements were obtained from the sacral and iliac sides of the bilateral S.I. joints in each case and control group. Independent samples t-test, Chi-square test, and ROC curve analysis were used.
Result:
Twenty-six patients had active sacroiliitis in 45 S.I. joints, unilateral active sacroiliitis was observed in seven patients (26.9%), bilateral symmetrical in three patients (11.5%) and bilateral asymmetrical in 16 patients (61.5%). The mean ADC value was 1.447 ± 0.528 [SD] × 10–3 mm 2 /s in the right S.I. joint and 1.630 ± 0.441 [SD] × 10–3 mm 2 /s in the left S.I. joint in active sacroiliitis (case group). The mean ADC value of the right S.I. joint was 0.965 ± 0.123 [SD] × 10–3 mm 2 /s and the left S.I. joint was 0.967 ± 0.96 [SD] × 10–3 mm 2 /s in inactive sacroiliitis (control group). A significant difference was observed statistically between the active sacroiliitis and the inactive sacroiliitis with a P < .0005. A cut-off mean ADC value of 1.034 ×10⁻³ mm 2 /s was obtained for differentiating active sacroiliitis from inactive sacroiliitis with a sensitivity of 84.6% and specificity of 84.6% from the ROC curve analysis.
Conclusion:
Diffusion-weighted MRI imaging with ADC value mapping acts as a sensitive diagnostic technique in the detection of active sacroiliitis in axial seronegative spondyloarthropathies and also helps in assessing the treatment response.
Abbreviations
ADC - apparent diffusion coefficient;
ASAS - Assessment in Spondyloarthritis International Society;
CRP - C-reactive protein;
DMARDs - disease-modifying anti-rheumatic drugs;
DWI - diffusion-weighted imaging;
HLA-B27 - human leukocyte antigen B27;
IVIM - intravoxel incoherent motion;
MRI - magnetic resonance imaging;
RF - rheumatoid factor;
ROC - receiver operating characteristic;
ROI - region of interest;
S.I. joint - sacroiliac joint;
SpA - spondyloarthropathy;
STIR - short tau inversion recovery.
Introduction
Axial seronegative spondyloarthropathy (SpA) is a heterogeneous group of autoimmune disorders manifesting with features of both articular and extra-articular involvement. The articular features of seronegative SpA include inflammatory back pain, ankylosis, dactylitis and characteristic enthesitis. The extra-articular features include uveitis, inflammatory bowel disease, cardiac abnormalities, and mucosal inflammation etc. 1
Axial seronegative SpA primarily comprises ankylosing spondylitis (AS), reactive arthritis, psoriatic arthritis, spondylitis associated with inflammatory bowel diseases like Crohn’s disease and ulcerative colitis, and undifferentiated SpA. 2
The prevalence of axial SpA is estimated to range from 0.3% to 1.4% worldwide. 3 In India, its prevalence is 7–9 per 10,000 individuals. 4 Positivity of HLA-B27 was found in more than 90% of patients with AS and even positivity in 6% of the normal Indian population.
The diagnosis of AxSpA is based on a combination of clinical, laboratory, and imaging findings. 5 Clinically patients with AxSpA presented with chronic back pain, where back pain improves with exercise and worsens with rest usually associated with morning stiffness. Mono or polyarticular arthritis with pain and swelling of the joints, enthesitic changes with pain and inflammation at the sites where tendons or ligaments attach to bone, dactylitis, Uveitis, skin changes like psoriasis, and inflammatory bowel disease can be found.5,6 Axial seronegative SpA usually shows HLA-B27 positivity with negative rheumatoid factor (RA). 7
On an MRI scan, the presence of bone marrow oedema (BMO) on STIR images or bone marrow contrast enhancement on post-gadolinium T1W images represents active sacroiliitis. The presence of BMO in consecutive two-slices or multiple BMO on a single-slice image is called active BMO. 8
The sacroiliitis changes are only depicted in the conventional radiograph in long-standing chronic cases. In contrast, conventional MRI sequences with presence of STIR hyperintense BMO and apparent diffusion coefficient (ADC) mapping can aid in the early detection of sacroiliitis. Early treatment response after drug therapy can be identified by the new appearance of T1 hyperintense fat depositions in the previously STIR hyperintense active BMO regions with subsequent reduction of ADC values. 9 Complete treatment response can be identified by complete regression of active BMO with T1 and T2 hypointense bony sclerosis around the affected joints with subsequent lowest ADC values. 9 MRI can detect early BMO in sacroiliitis several years before changes are detected on the plain radiograph. Hence, MRI is postulated as a first-line imaging modality in the diagnosis of early sacroiliitis and identification of treatment response with NSAIDs, DMARDs and tumour necrosis factor (TNF)-inhibitors. 9 MRI with ADC mapping helps in the early diagnosis and detection of early treatment response in such patients with axial seronegative SpA. 10
Clinical and radiological parameters are used to assess the treatment response to the drug therapy like NSAIDs, DMARDs, and TNF-inhibitors. 11 Post-treatment reduction of ADC and normalised ADC values were greater in treatment responders than in non-responders with high sensitivity and specificity. 11 The Spondyloarthritis Research Consortium of Canada Scoring System (SPARCC) shows higher responsiveness to treatment-related changes in sacroiliitis. 12
Higher b-value diffusion-weighted imaging (DWI) MR images provide more conspicuous marginal bony erosion around the S.I. joint in active sacroiliitis and identification of associated surrounding inflammatory component. 8 Early identification and early institution of treatment regimens in axial seronegative SpA can decrease the complications. Patients with axial seronegative SpA with active BMO have a good clinical response to anti-TNF therapy. 13
DWI offers unique insights into tissue microstructure and cellular integrity by measuring diffusion of water molecules within tissues. By utilising different b-values, the sensitivity of ADC mapping to various tissue properties can be manipulated, such as cellularity and vascularity. This allows for improved delineation of inflammatory changes and BMO associated with active sacroiliitis, facilitating earlier and better prognosis after treatment for treatment response especially with intravoxel incoherent motion (IVIM) diffusion-weighted MRI, which is able to provide both diffusion and perfusion information in tissues without any contrast agents. 14 IVIM can detect early inflammatory changes of sacroiliitis before they are visible on conventional MRI and helps in differentiating active inflammation from chronic sacroiliitis. Changes in IVIM parameters can reflect the treatment response to the anti-inflammatory or disease-modifying treatments. 14
Our study aims to evaluate the effectiveness of DWI and ADC mapping in diagnosing active sacroiliitis in patients with axial seronegative SpA.
Materials and Methods
This hospital-based prospective study was conducted in a tertiary care hospital from May 2021 to June 2022. A comprehensive review of patient clinical data and MR imaging data of 26 consecutive patients with active sacroiliitis was performed in this study, with a comparison of data with age and sex-matched 26 healthy patients without active sacroiliitis as a control group. Institutional ethics review committee permission was obtained.
The case group comprised 26 patients suffering from chronic low back pain who underwent MRI scans of the sacroiliac joints and had active sacroiliitis. Sex and age-matched healthy patients without active sacroiliitis were categorised as the control group. Women with a history of childbearing age were excluded from the control group. Individuals engaged in active sports activities, such as football players, were also excluded from the control group. Consent was obtained from all case and control groups.
Two radiologists blinded to clinical information analysed the MRI data for the presence of active BMO, marginal erosions, the pattern of post-contrast enhancement, the status of joint space, presence of joint effusion and adjacent inflammatory components.
Inclusion criteria:
Patients suffering from chronic low backache with active BMO on MRI representing active positive sacroiliitis.
Exclusion criteria:
Already diagnosed cases of seronegative SpA. Already treated patients with active sacroiliitis. Chronic healed sacroiliitis, where T1 and T2 hypointense bony sclerosis identified. Chronic completely healed sacroiliitis and ankylosed S.I joints.
Controls
Sex and age-matched control groups were selected based on negative MRI findings without active sacroiliitis.
MRI Protocols
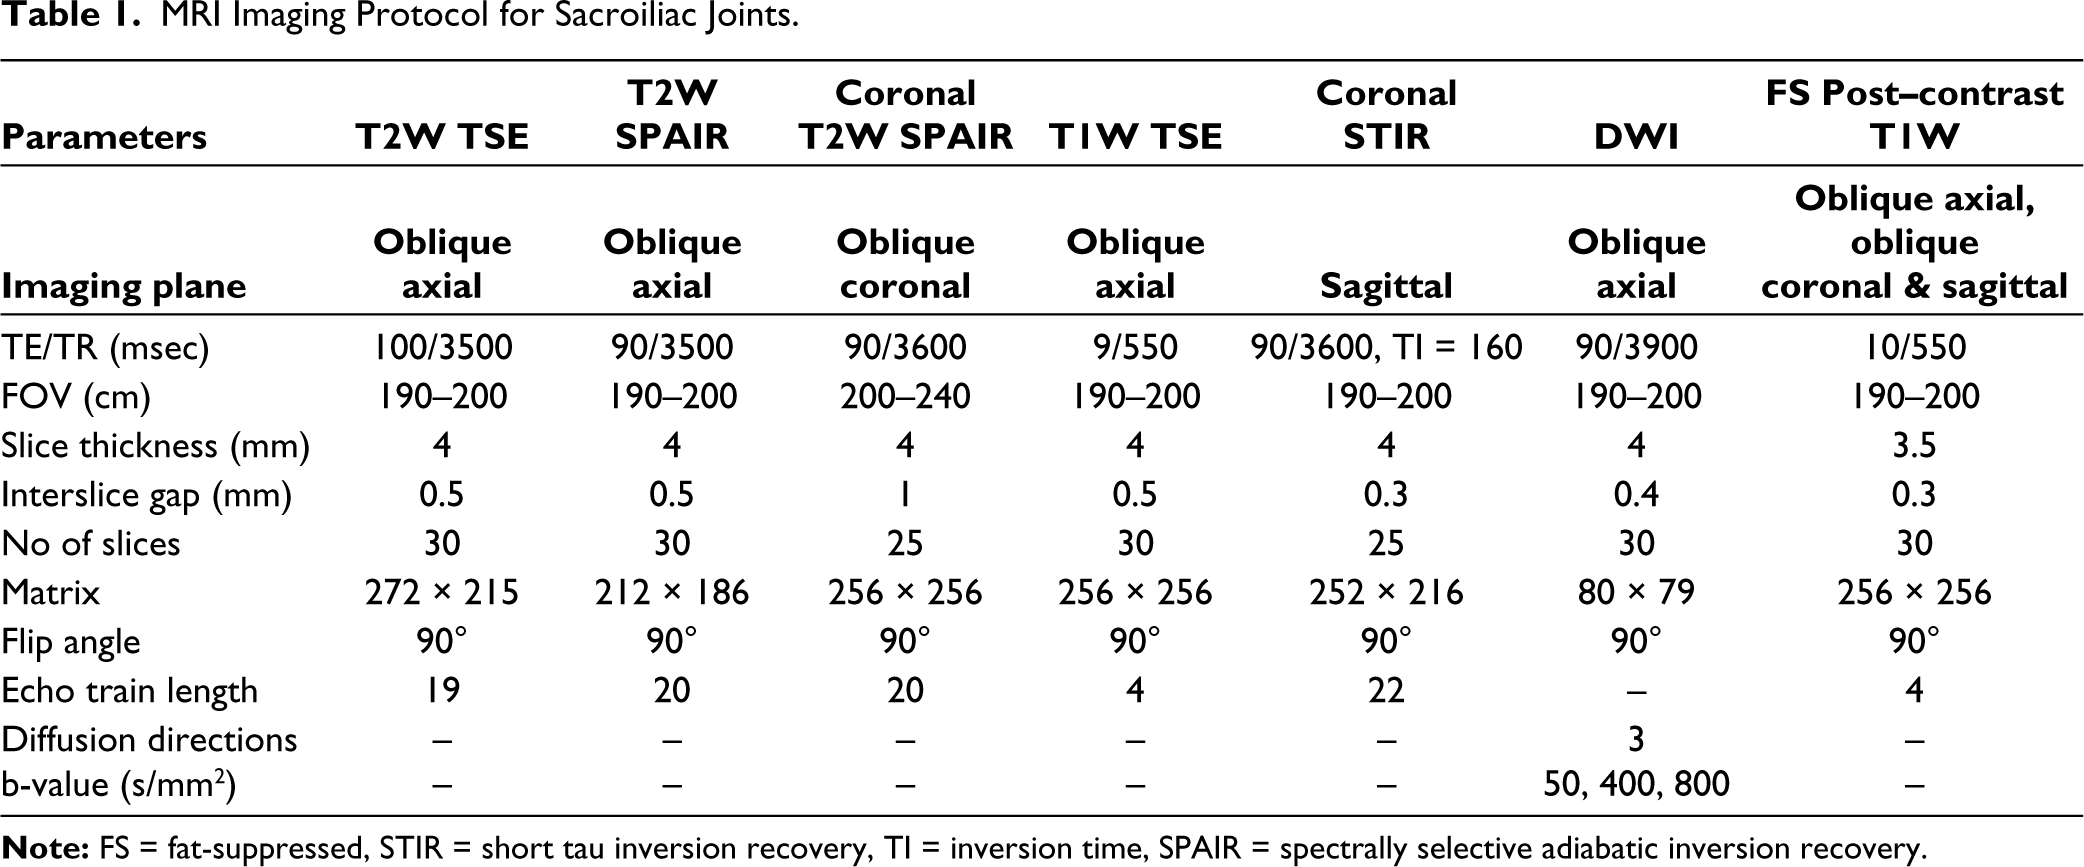
All patients underwent an MRI scan of the pelvis using the 1.5 Tesla Philips Ingenia machine (Netherlands) in a supine position, using a 16-channel phased-array coil. Table 1 shows the parameters of various MRI sequences used for the examination of S.I. joints.
MRI Imaging Protocol for Sacroiliac Joints.
MRI Image Interpretation
The sacroiliac joints were analysed on various conventional and diffusion-weighted MRI sequences. The MRI findings were classified based on the ASAS 2009 criteria for MRI sacroiliitis.
Quantitative DWI Analysis
The ADC values were generated in the operating system console using region of interest (ROI) placed within the sacral and iliac sides of the S.I. joints as upper, middle, and lower 3rd of the S.I. joint. Averages of each sacral and iliac side of individual S.I. joint were obtained, followed by the mean ADC value of each S.I. joint by combining the average ADC value of the sacral and iliac sides of each joint. A constant diameter of circular/elliptical ROI was used with a minimum area of 0.1 cm 2 . Initially, the ROI was placed in the DWI image; after copying the same ROI was pasted in the ADC map image, and then the ADC value was calculated. The ADC values were calculated from b = 50, 400, and 800 s/mm 2 images. The mean ADC values of sacral and iliac sides of S.I. joints, and the average mean ADC values of S.I. joints were obtained in both case and control groups for statistical analysis.
Clinical and Biochemical Correlation
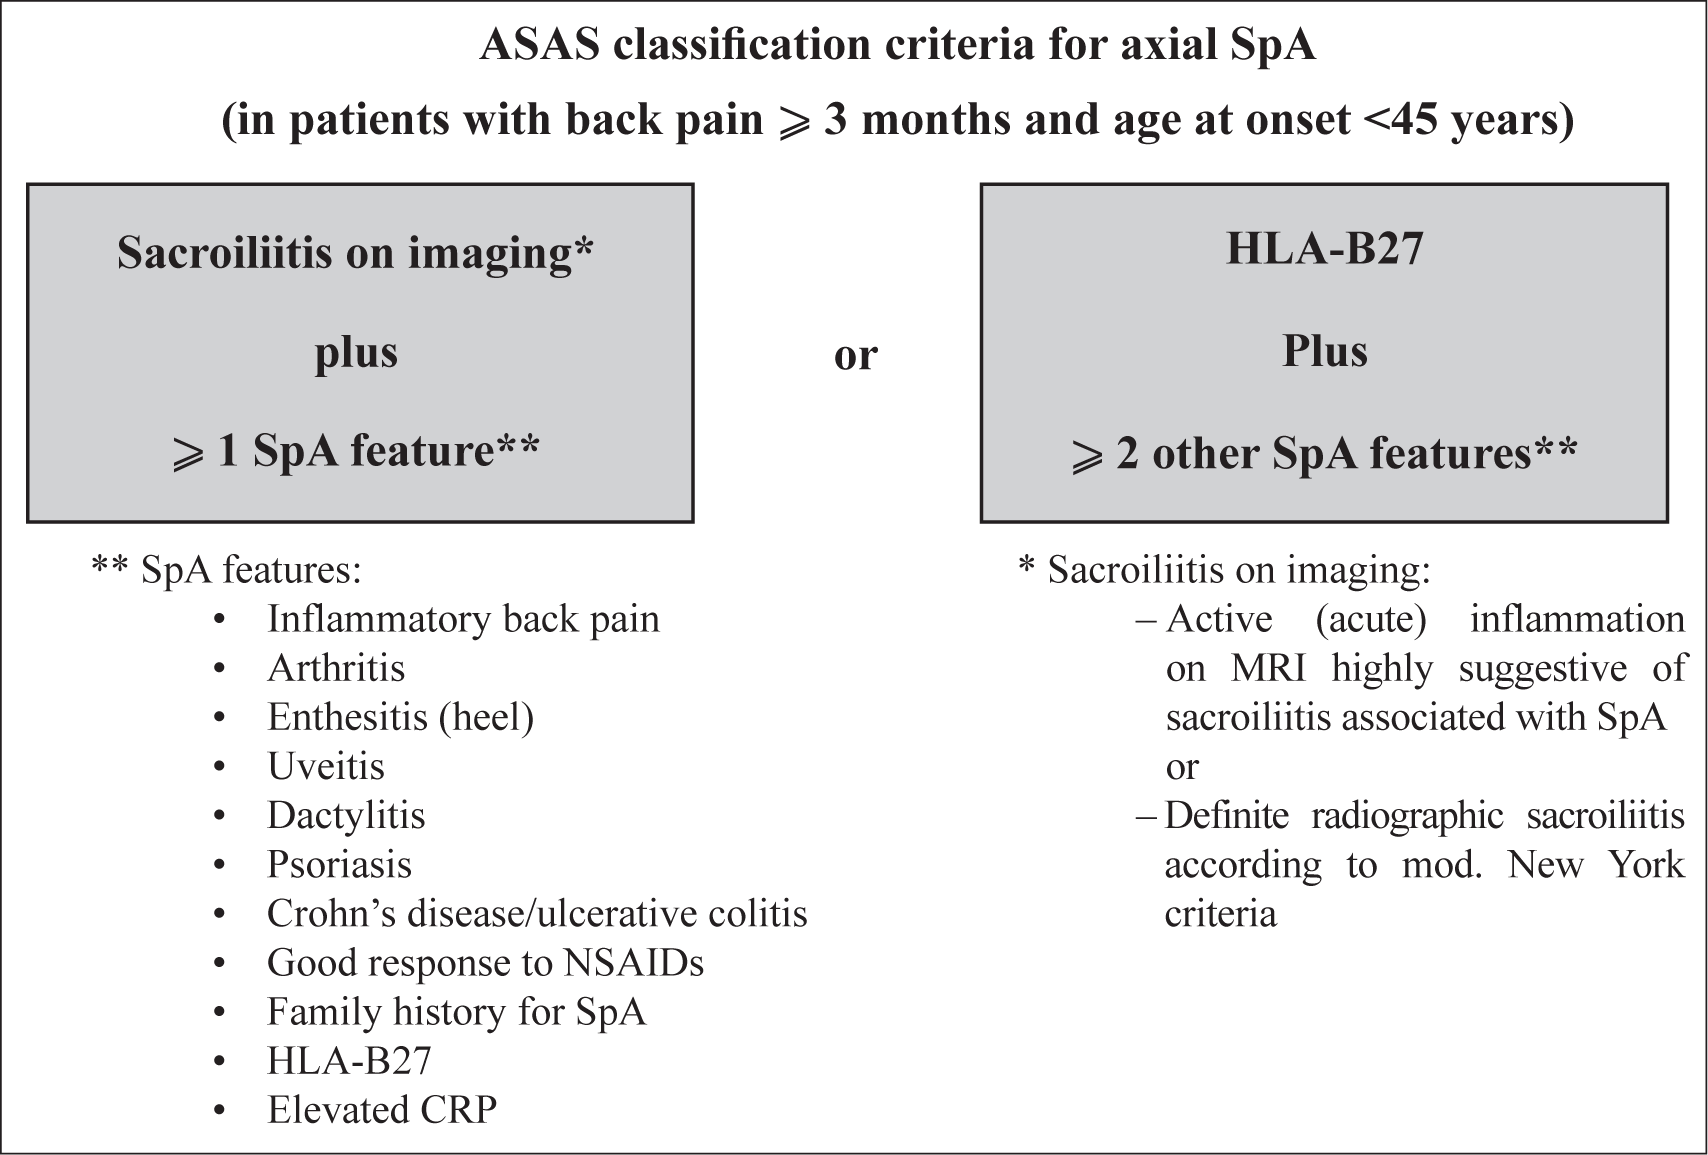
MRI findings were correlated with clinical findings. Clinically, active sacroiliitis was defined when there was low backache with tenderness over the S.I. joint on palpation. The presence of active inflammatory signs over the S.I. joints was also categorised as clinically active sacroiliitis. Biochemical markers like CRP (C-reactive protein) and HLA-B27 (human leukocyte antigen B27) were correlated. Finally, the MRI imaging findings of seronegative SpA were correlated according to the Assessment in Spondyloarthritis International Society (ASAS) classification2,7 (Figure 1).
Statistical analysis
The collected data were analysed using Microsoft Excel and SPSS programmes (version 25, SPSS Inc., Chicago, USA). An unpaired t-test was used to compare the mean ADC values of active sacroiliitis between the case group and the control group. ROC curve analysis was used to find out the cut-off mean ADC values.
Results
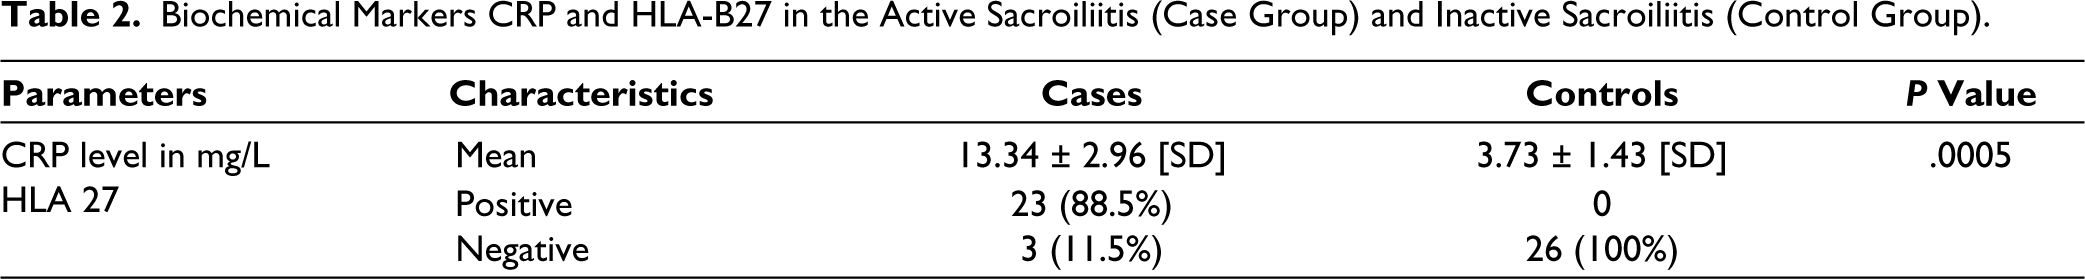
The study included 26 patients with active sacroiliitis affecting 45 sacroiliac joints as a case group, with age- and sex-matches 26 patients as the control group. Sixteen were males and 10 were females, with a male:female ratio of 1.6:1. The mean age was 33.69 ± 8.23 [SD] years, with an age range of 15–46 years. All patients had chronic low backache with a mean duration of symptoms of 7.81 ± 3.95 [SD] months. Twenty-one patients (80.8%) had morning back stiffness. The mean CRP level measures 13.34 ± 2.96 [SD] mg/L, with a range of 8–18 mg/L in the case group shown in Table 2. Of 26 patients, 23 patients (88.5%) showed positivity for the HLA B27 antigen.
Biochemical Markers CRP and HLA-B27 in the Active Sacroiliitis (Case Group) and Inactive Sacroiliitis (Control Group).
On MRI scan, unilateral sacroiliitis was observed in seven patients (26.9%) (Figure 2), bilateral symmetrical sacroiliitis in three patients (11.5%) (Figure 3), and bilateral asymmetrical sacroiliitis in 16 patients (61.5%) (Figures 4 and 5). Seventeen patients (65.4%) showed only involvement of lower 2/3rd of the S.I. joints (Figure 3), two patients (7.7%) showed involvement of upper 1/3rd, and seven patients (26.9%) showed involvement of the whole S.I. joints. All 26 patients showed varied areas of active BMO in the 45 S.I. joints, representing the active sacroiliitis shown in Table 3. Acute chronic sacroiliitis changes with intervening T1 hyperintense fatty infiltrations and T1W and T2W hypointense bony sclerosis were observed in nine patients (34.6%) (Figure 6).
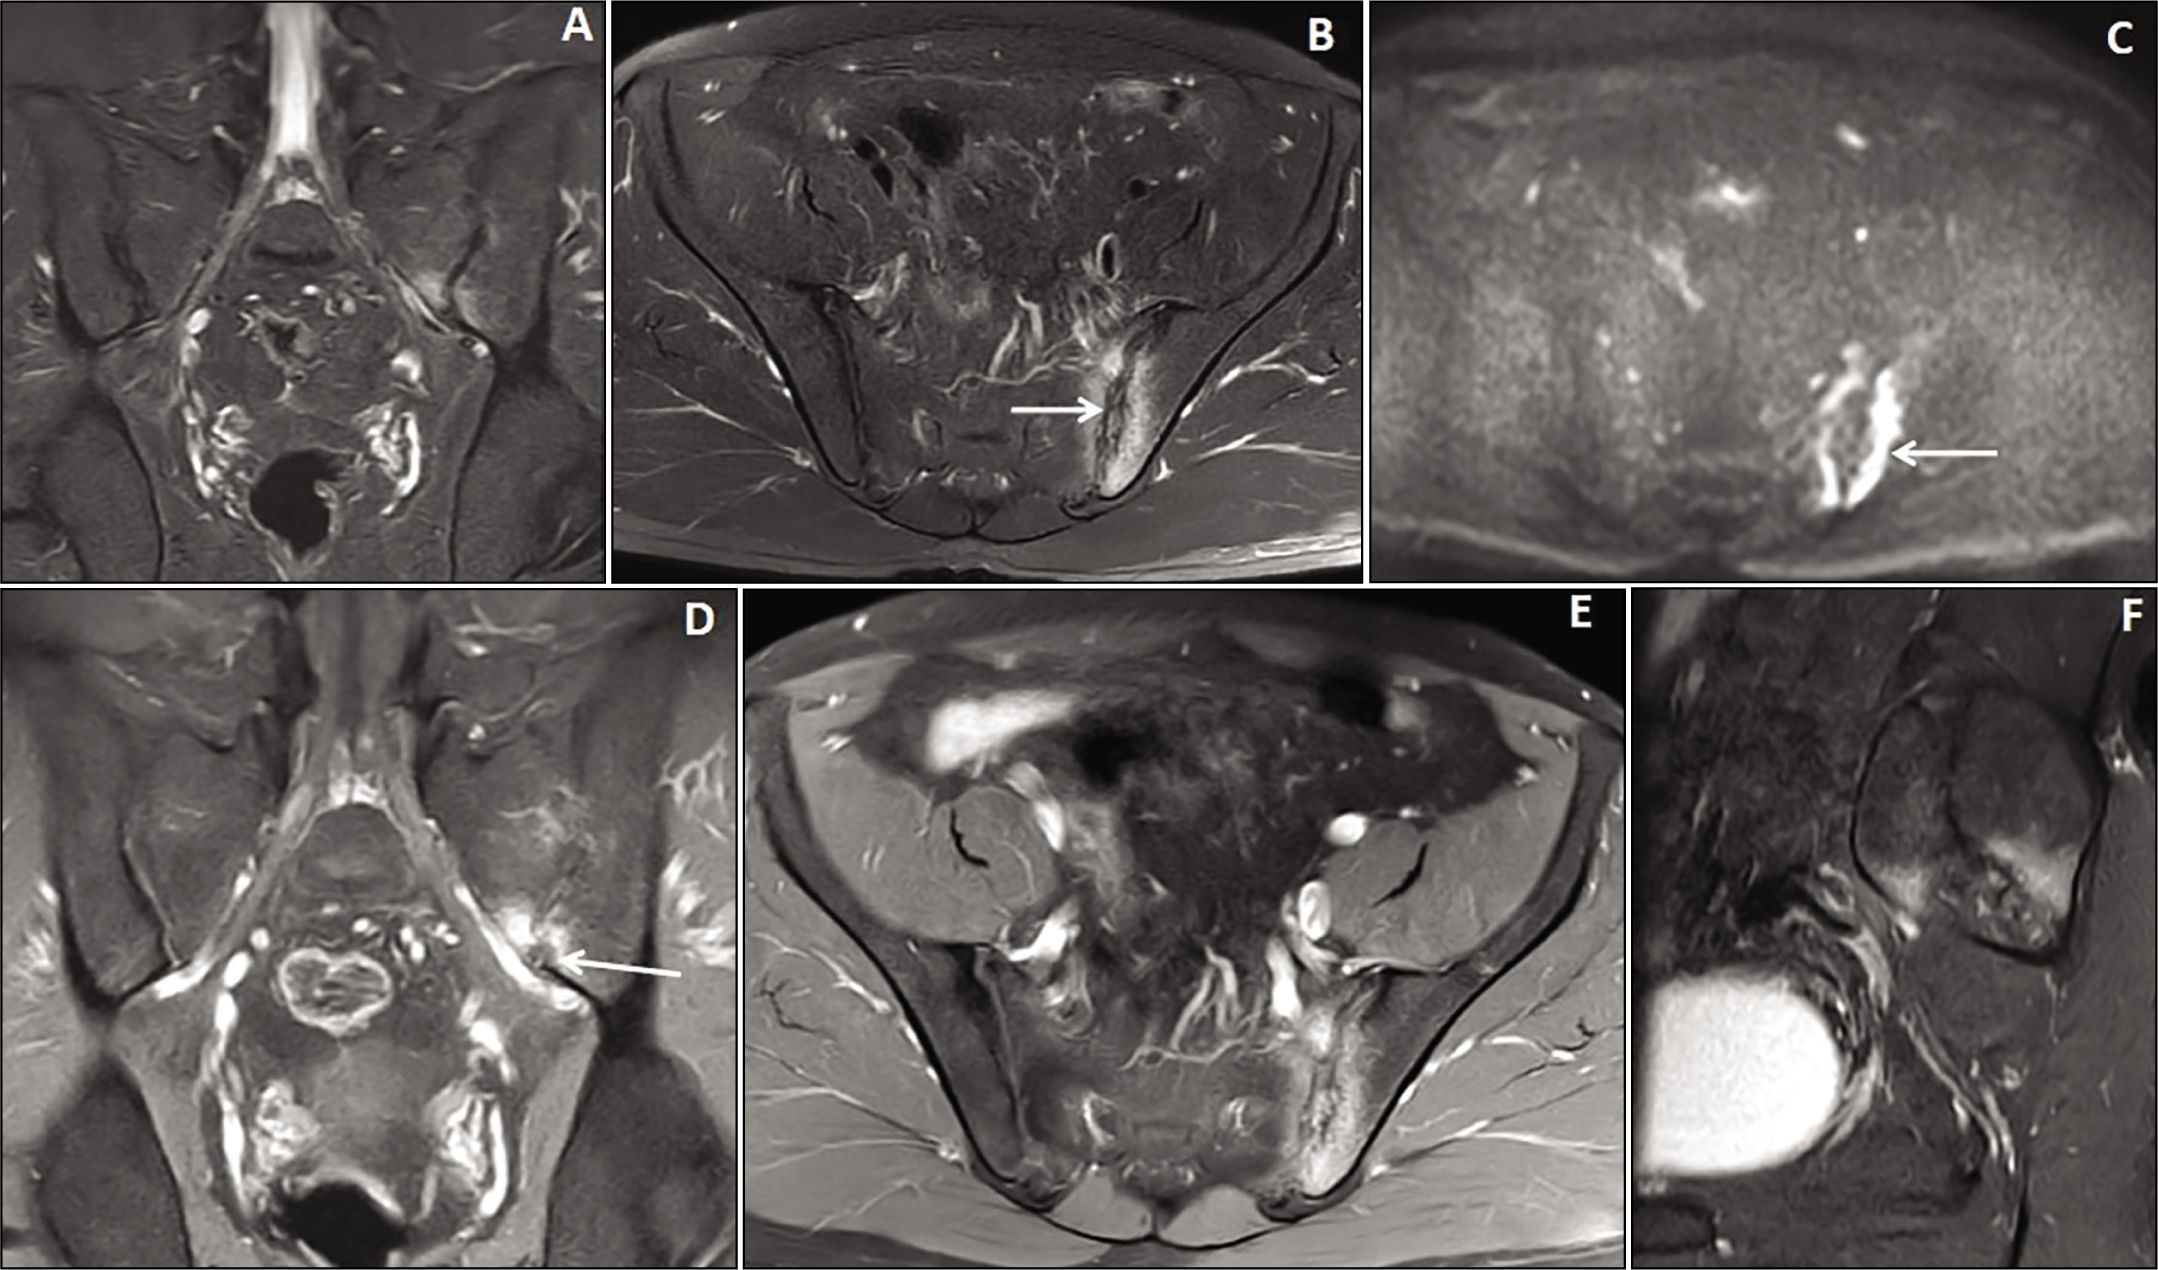
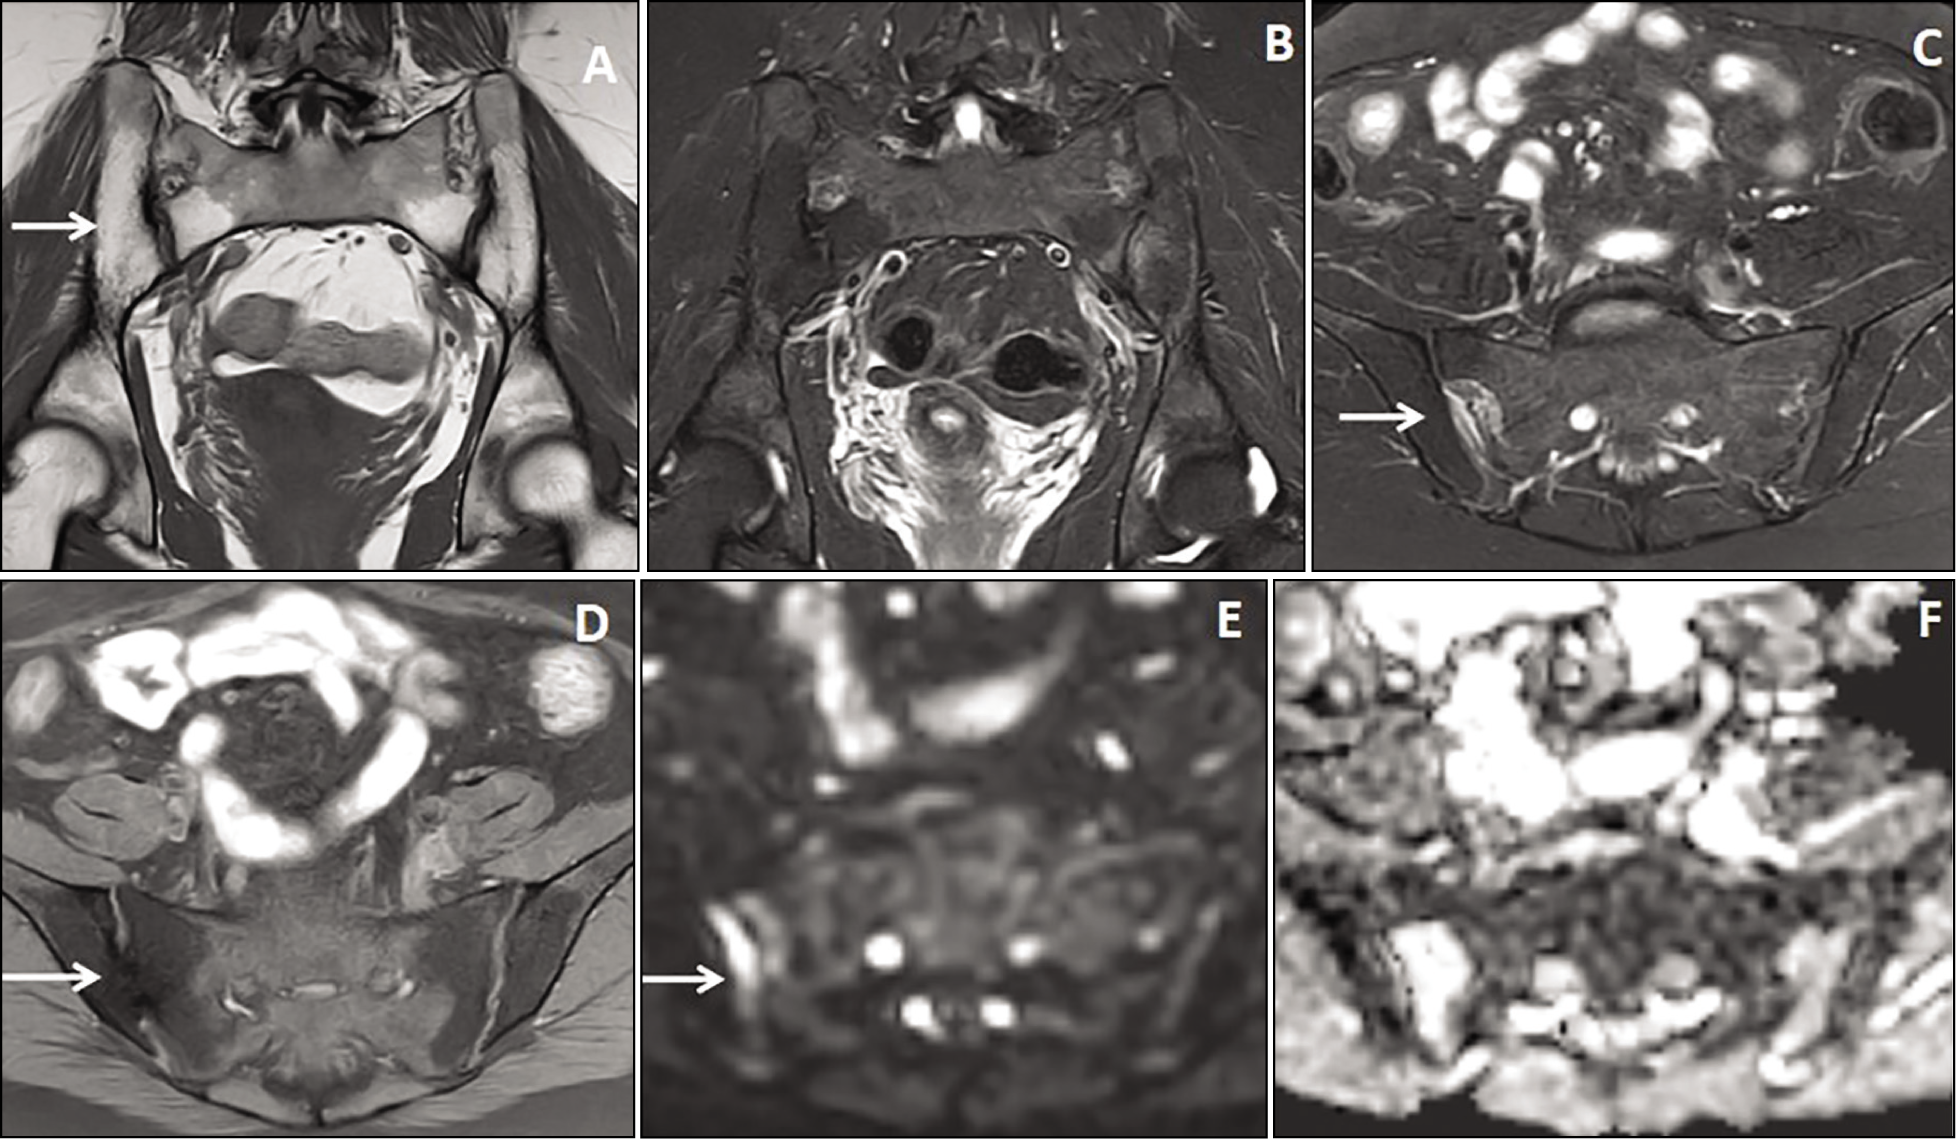
A 40-year-old male patient presented with unilateral sacroiliitis. Coronal and axial STIR MRI images (A & B) showed hyperintensities in both the iliac and sacral sides of the left S.I. joint. The axial DWI image (C) showed bright signals in the affected bones of the left S.I. joint. Post-gadolinium coronal, axial, and sagittal images (D, E, & F) showed irregular marginal enhancement of the sacral and iliac sides of the left S.I. joint with bony erosions (arrow in image D).
A 15-year-old female patient with bilateral symmetrical sacroiliitis. Coronal and axial PDFS MRI images (A & B) showed bilateral, almost symmetrical STIR hyperintensities in the iliac and sacral sides of both S.I. joints. The axial DWI and ADC map images (C & D) showed marginal bright signals (arrow). Axial ADC map images (E & F) demonstrated the technique of placing equal-sized ROIs for the measurement of various ADC values in the iliac and sacral sides of the S.I. joints.
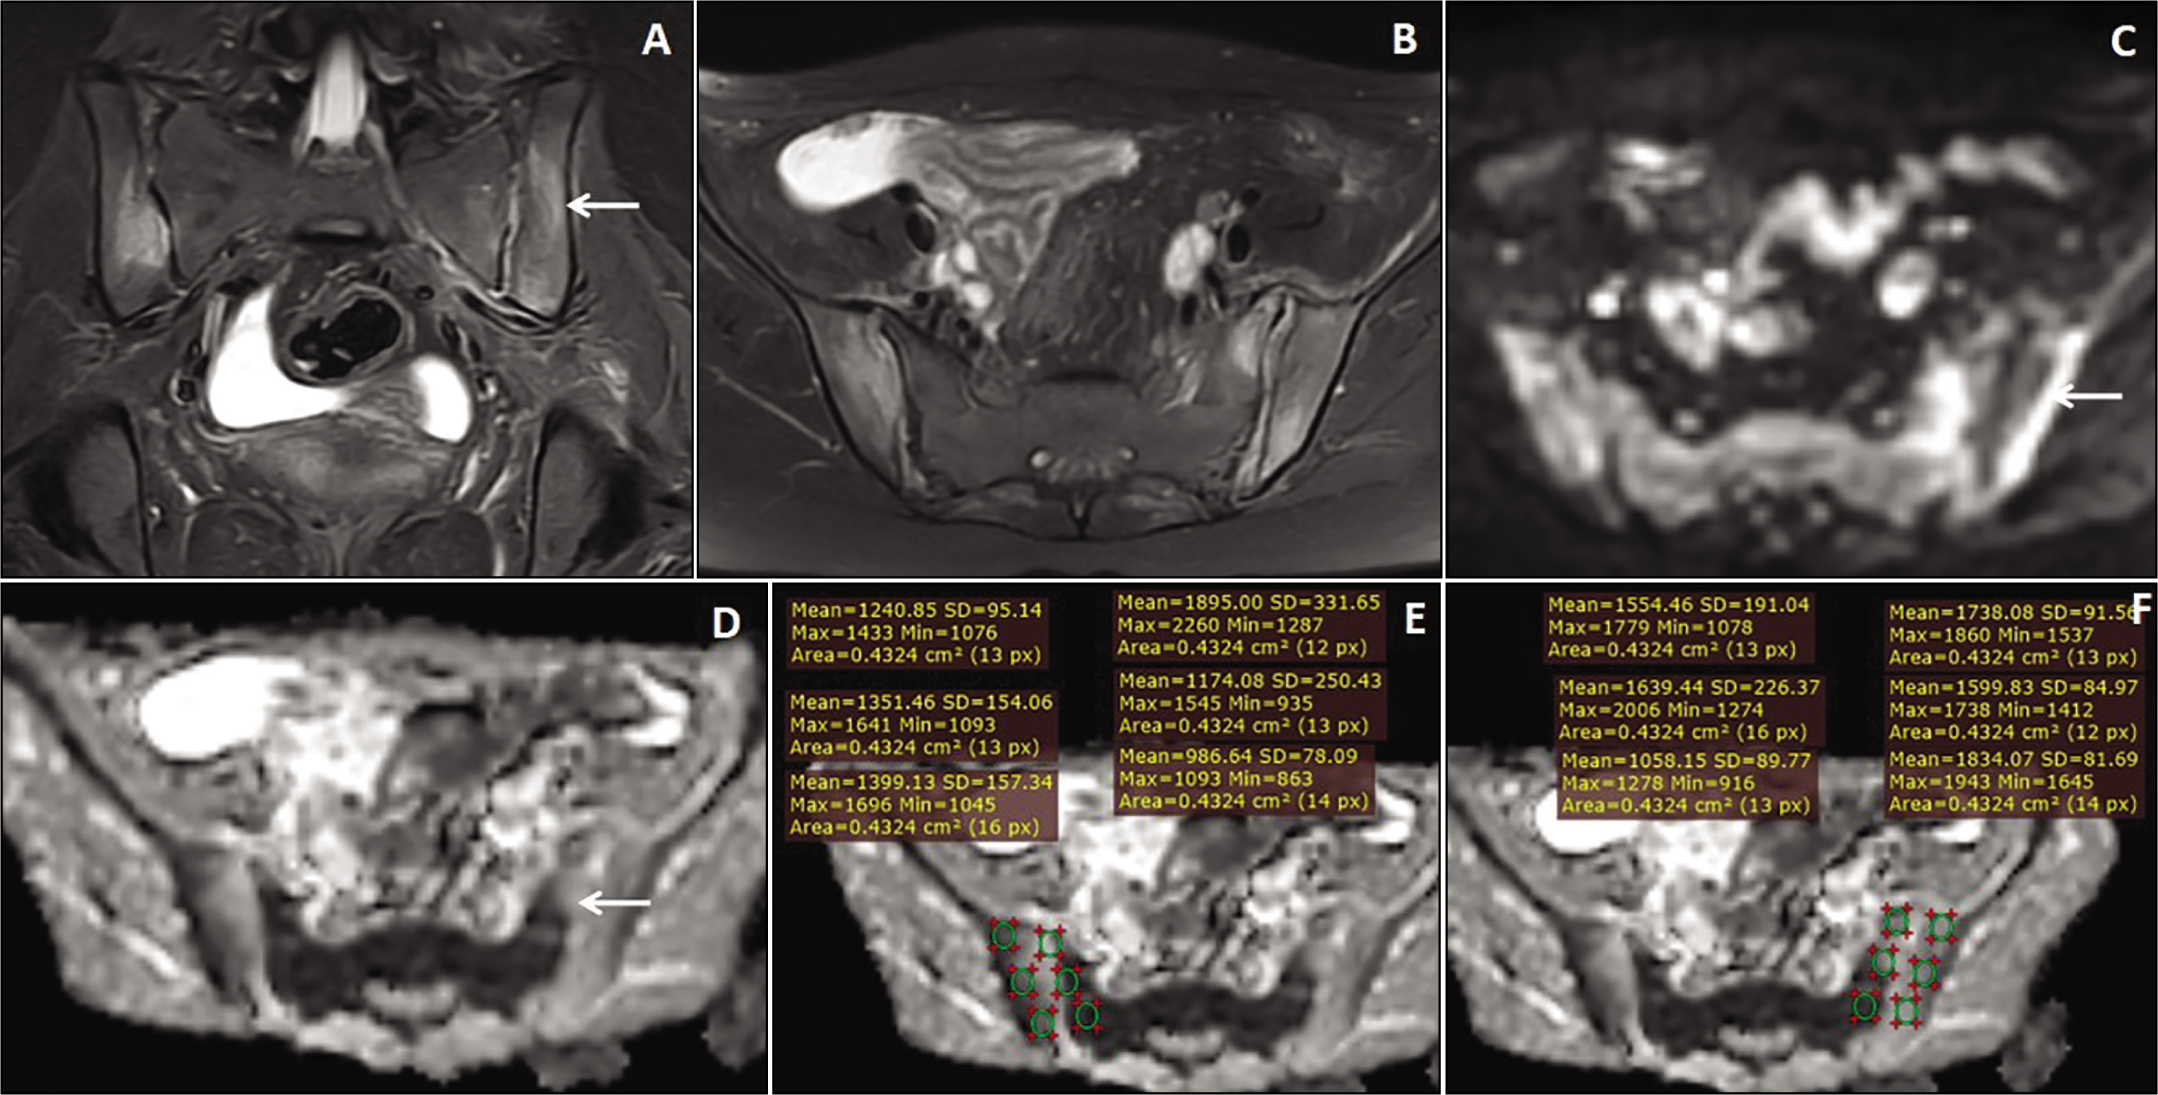
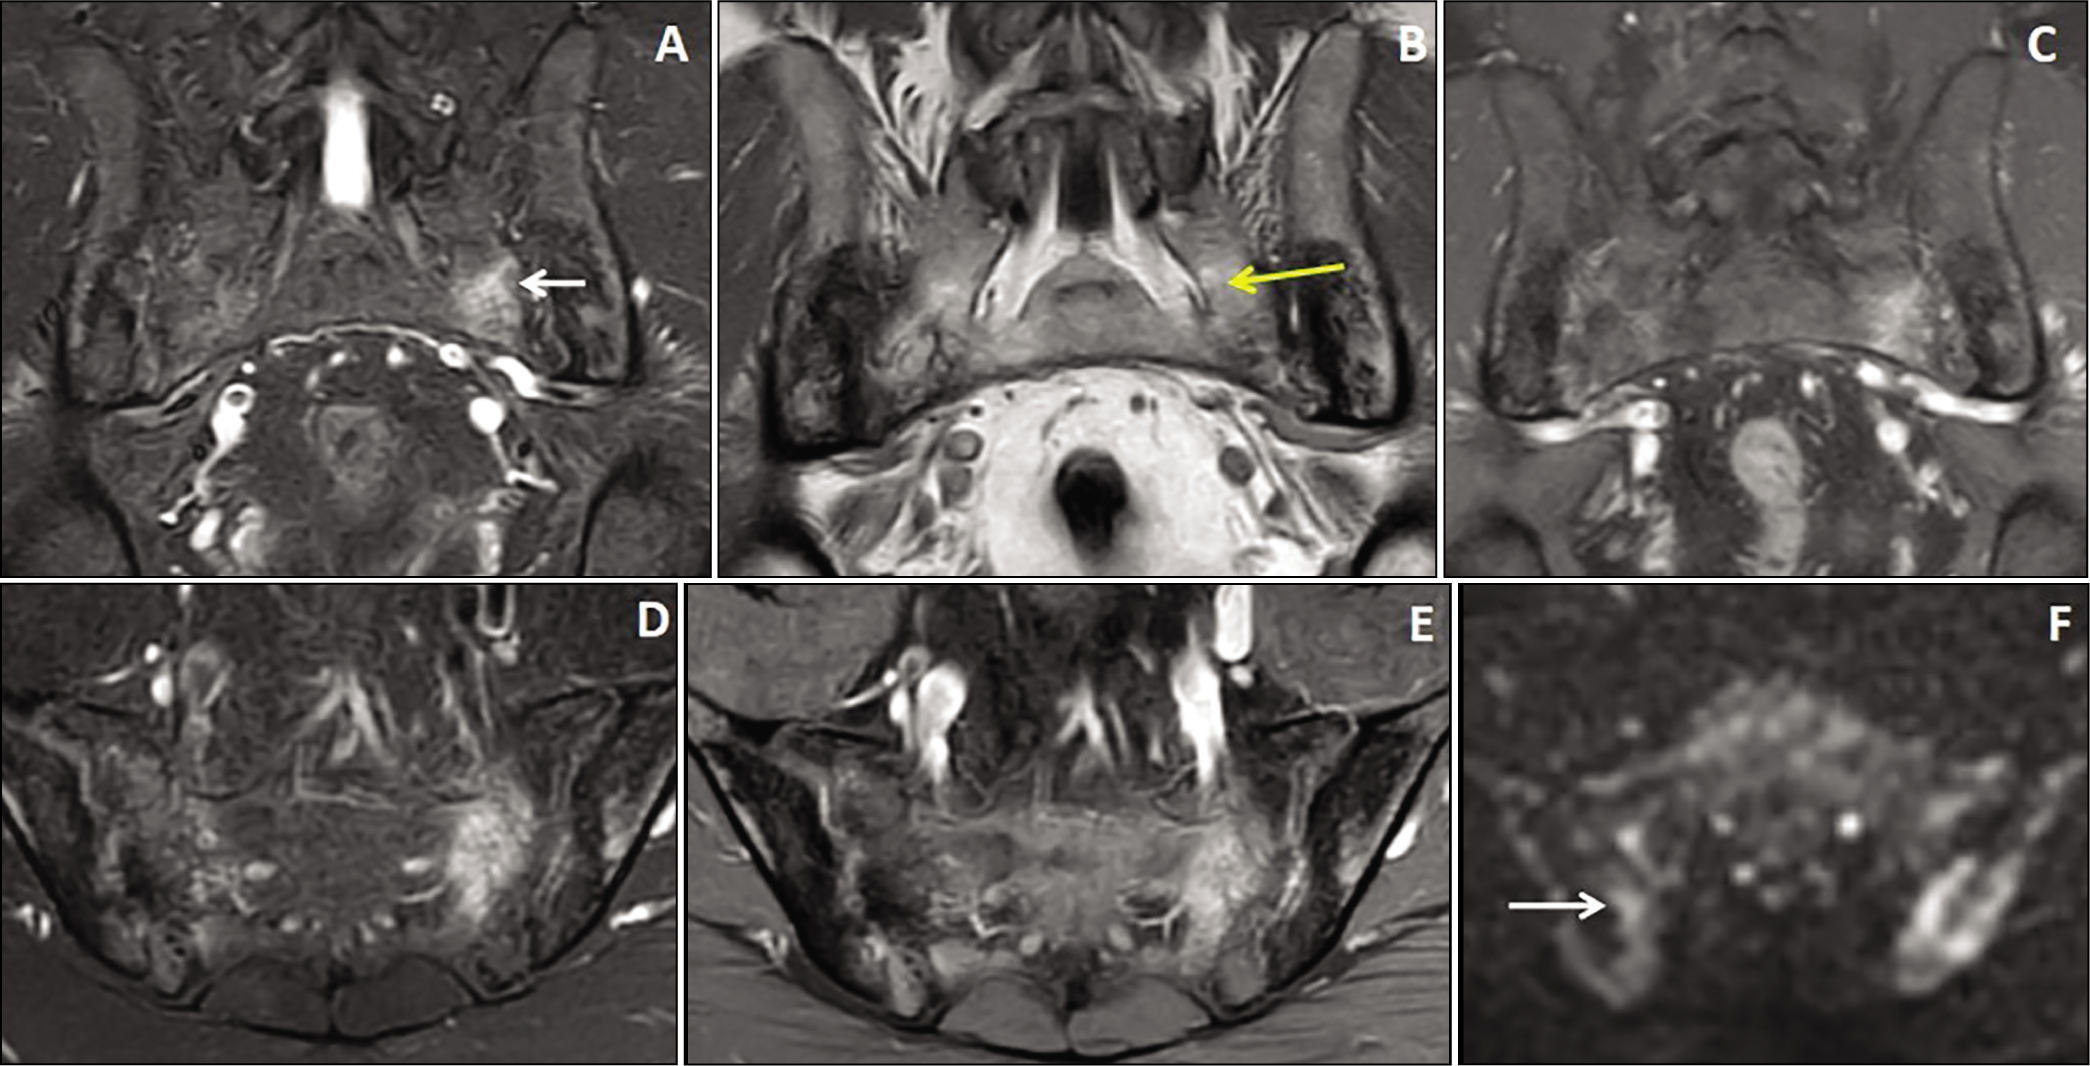
A 35-year-old female patient presented with long-standing low backache with acute exacerbation, along with bilateral asymmetrical acute-on-chronic sacroiliitis. Coronal T1W and STIR images (A & B) showed bilateral asymmetrical T1 hyperintense fat depositions in both the iliac and sacral sides of the bilateral S.I. joints, which were suppressed on STIR images. Axial STIR and fat-suppressed T1 images (C & D) showed bilateral asymmetrical patchy marginal STIR hyperintensities predominantly in the sacral sides of the S.I. joints, more on the right side (arrow). Axial DWI and ADC map images (E & F) showed bright signals in the affected areas, more in the sacral side of the right S.I. joint (arrow).
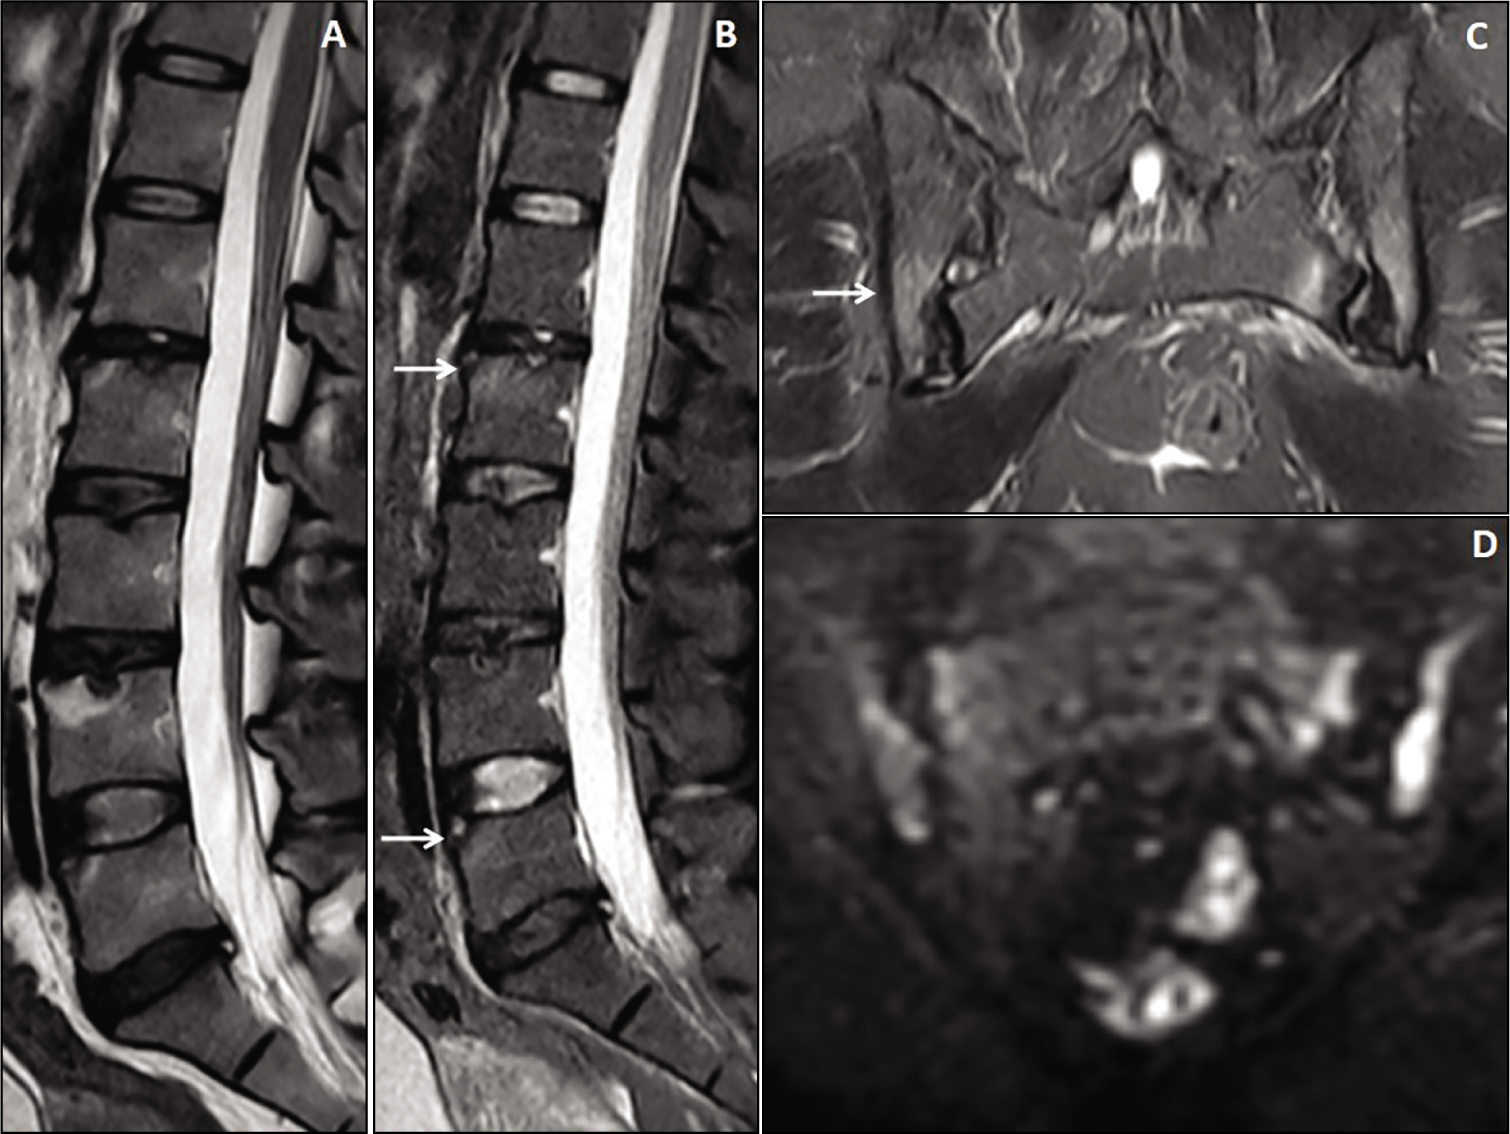
A 35-year-old female patient presented with active sacroiliitis and lumbar vertebral involvement. Sagittal T2W and STIR images (A & B) of the lumbrosacral spine show multi-level Schmorl’s nodes formation in the lumbar vertebrae with STIR hyperintense Romanus lesions in the vertebrae (arrows). Mild loss of anterior vertebral body concavity was observed. Coronal STIR image (C) showed bilateral asymmetrical hyperintensities in both the iliac and sacral sides of the S.I. joints. Coronal DWI image (D) showed bright signals in the affected bones of the S.I. joints.
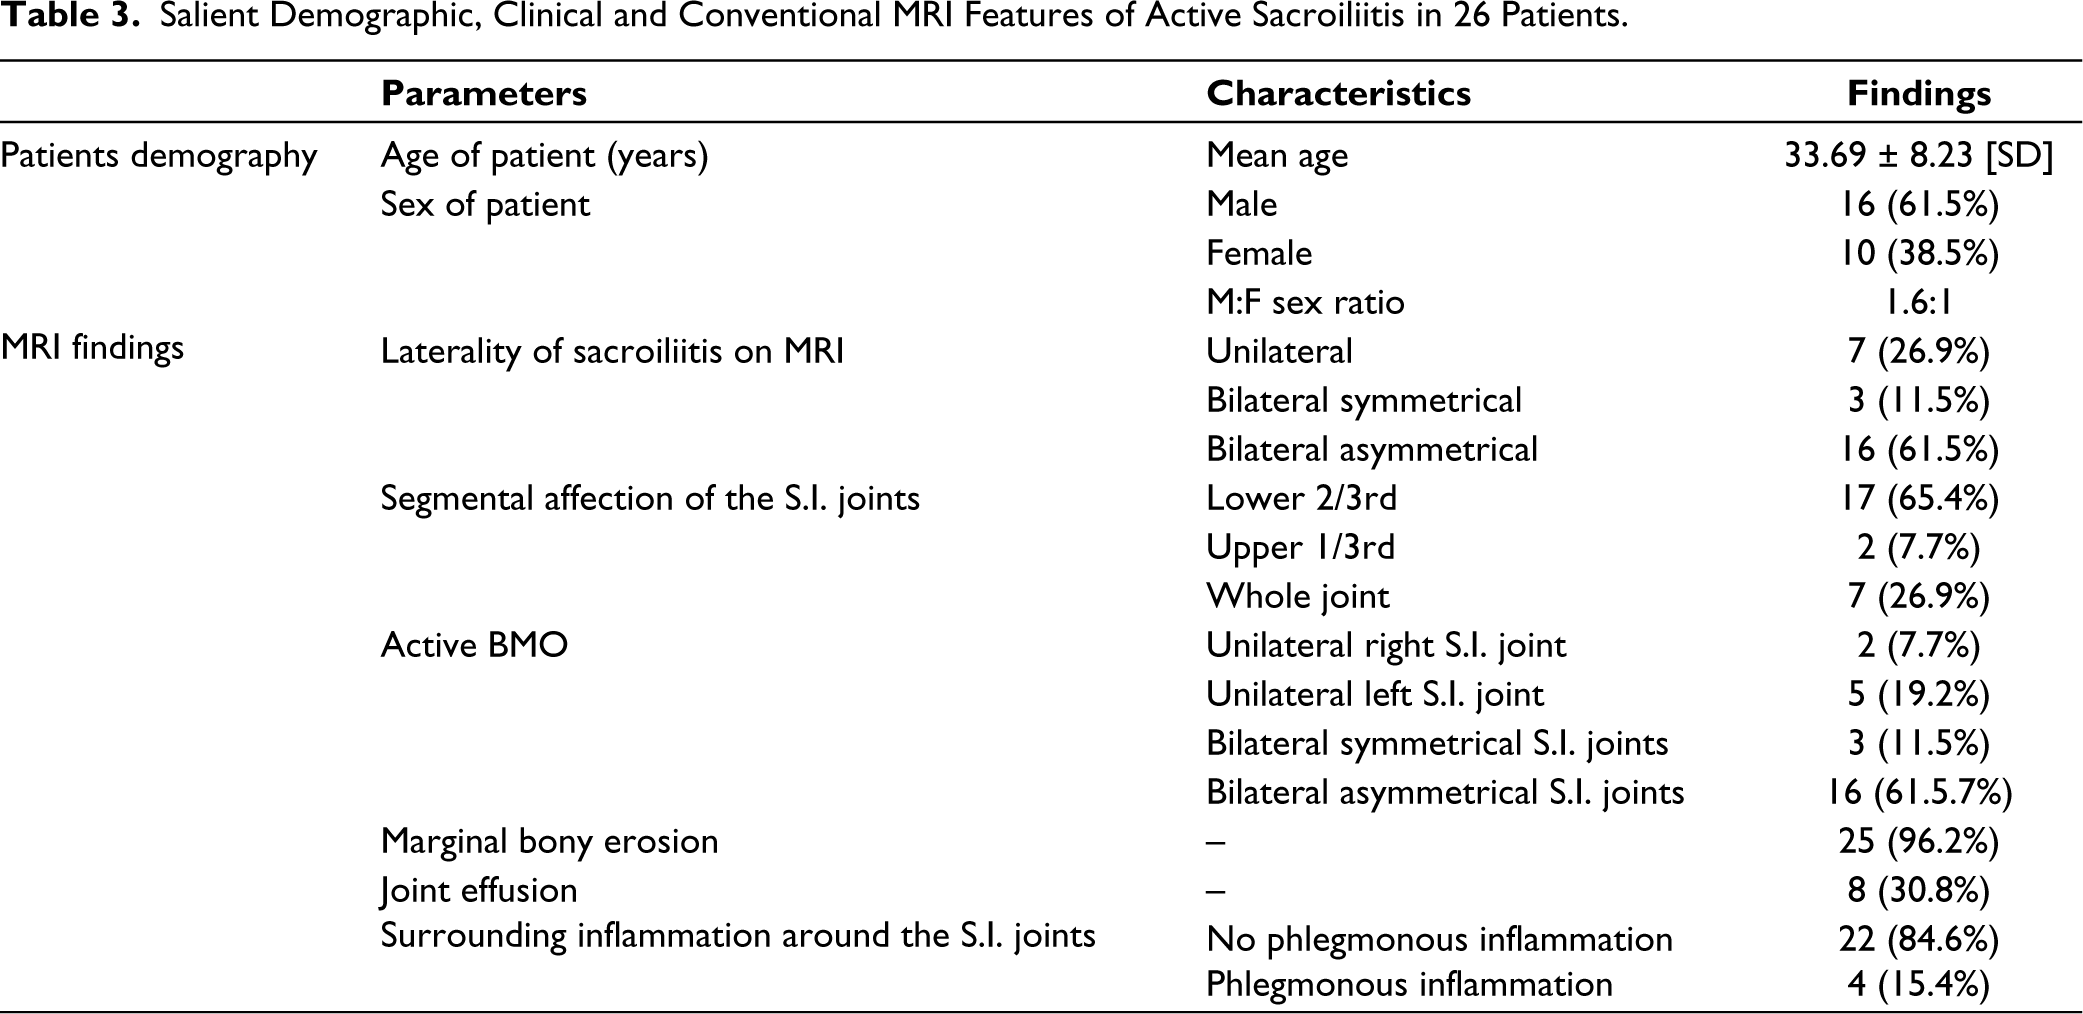
Salient Demographic, Clinical and Conventional MRI Features of Active Sacroiliitis in 26 Patients.
A 45-year-old male patient presented with chronic backache with acute exacerbation and bilateral asymmetrical acute-on-chronic sacroiliitis. Coronal STIR, T1W, and post-contrast images (A, B & C) showed bilateral asymmetrical sacroiliitis (arrow) with T1 hyperintense excessive fat depositions (yellow arrow) and intervening hypointense sclerosis in both the iliac and sacral sides of the bilateral S.I. joints. Axial STIR, fat-suppressed post-contrast, and DWI images (D, E & F) showed bilateral asymmetrical patchy STIR hyperintensities predominantly in the sacral sides of the left S.I. joint and bright signals in the affected areas on the DWI image.
Out of 26 patients, two patients (7.7%) showed unilateral active BMO in the right S.I. joint and five patients (19.2%) in the left S.I. joint (Figure 2). Marginal bony erosion was observed in 25 patients (96.2%) and joint effusion in eight patients (30.8%). Sacroiliitis without associated phlegmonous inflammation was observed in 22 patients (84.6%), with a phlegmonous inflammatory component in four patients (15.4%). Subsequent lumbar vertebrae involvement was observed in eight patients (30.7%) of seronegative SpA (Figures 5 and 7). Bony ankylosis was observed in five patients (19.2%) of seronegative SpA (Figure 7).
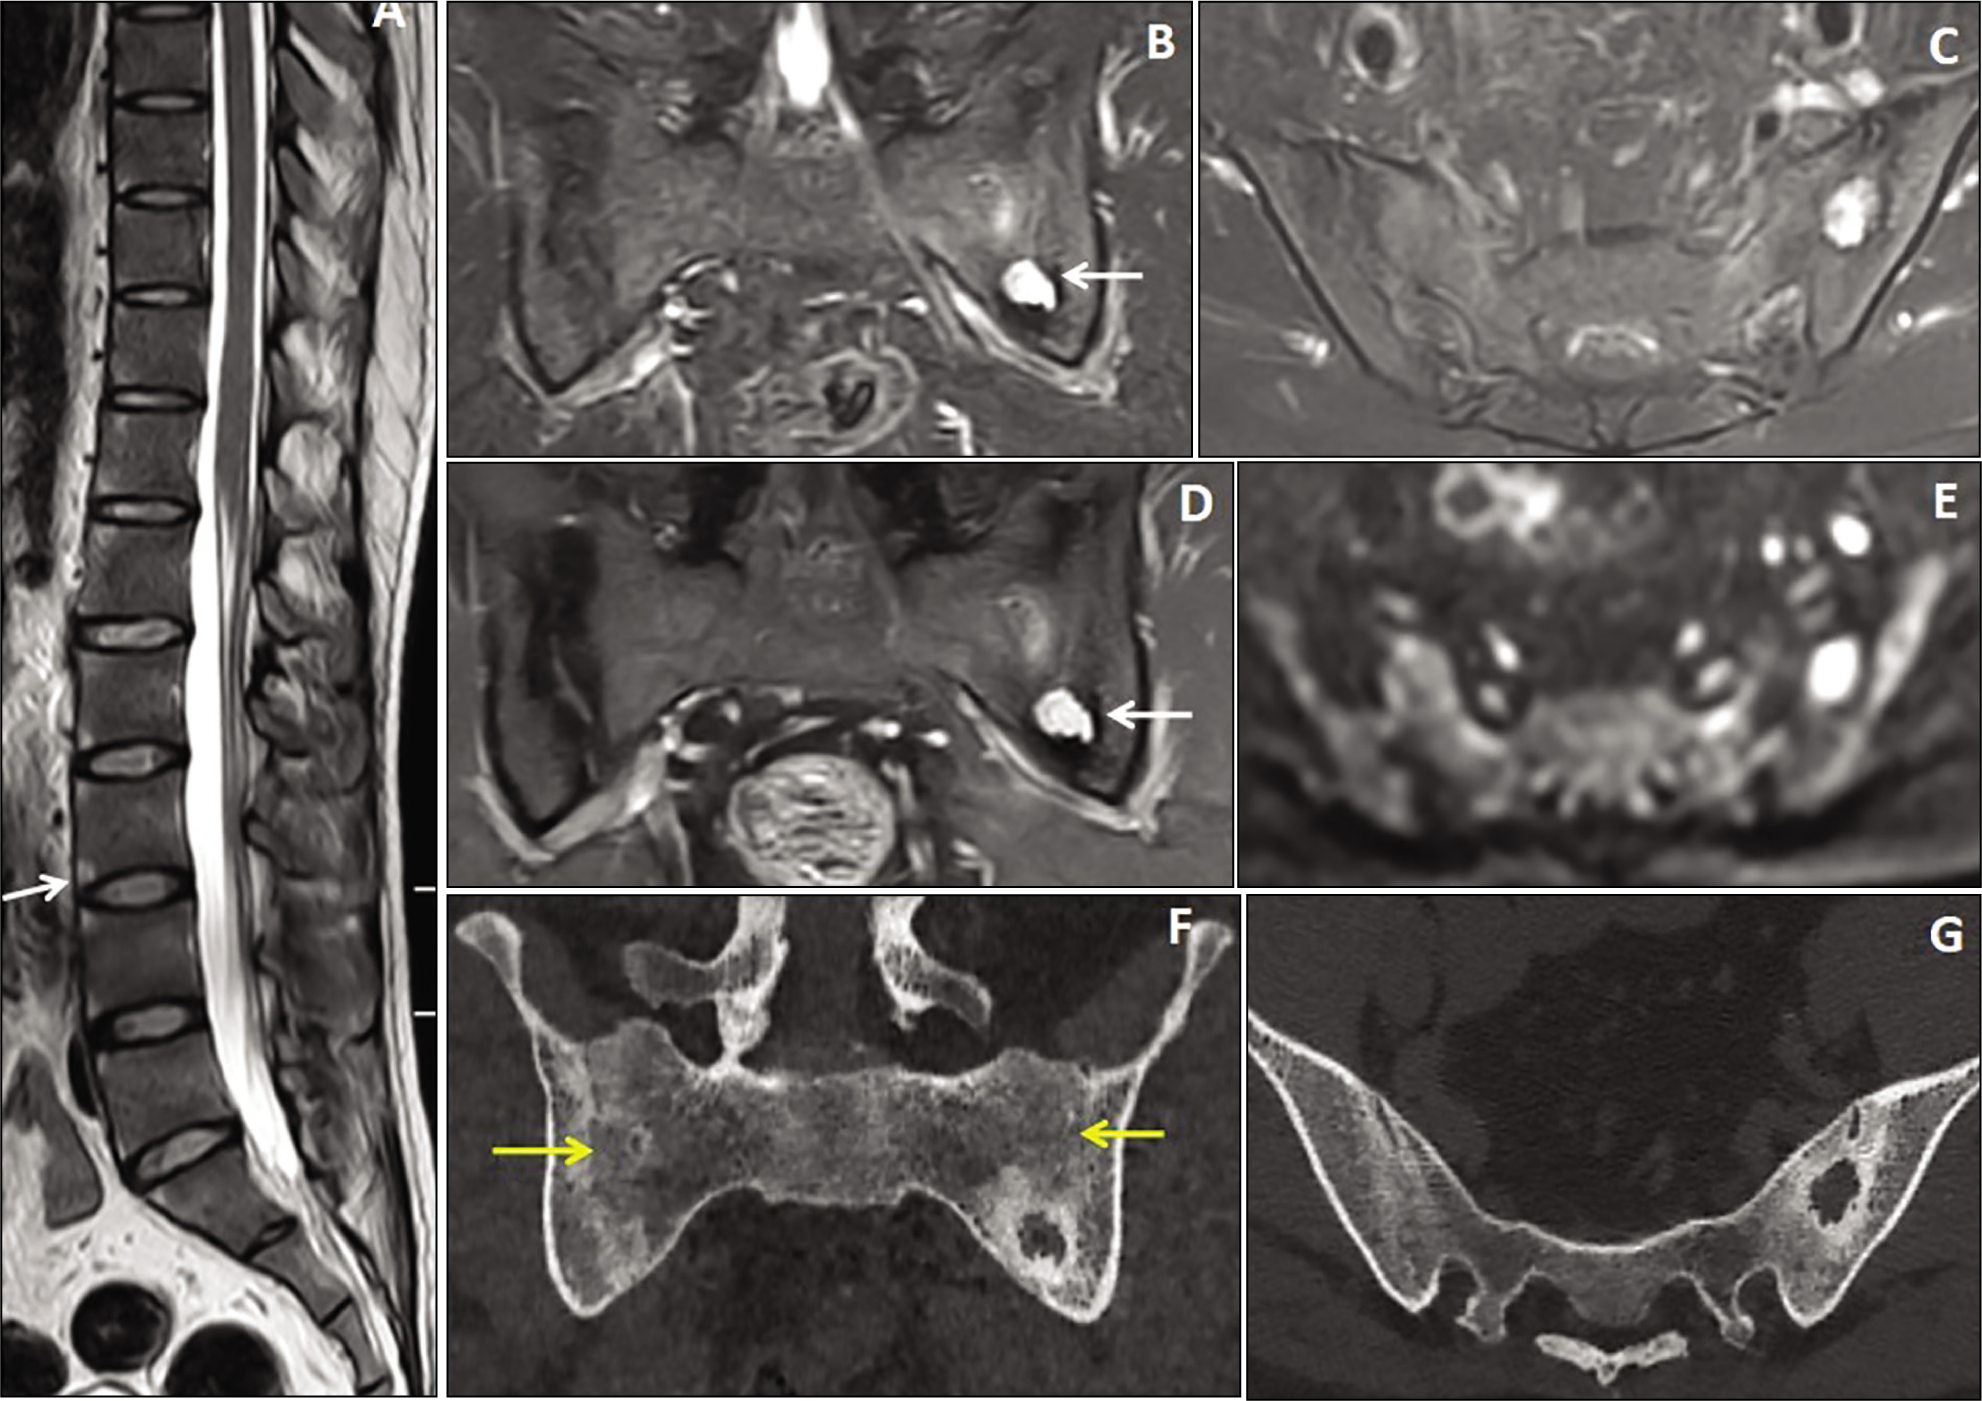
A 34-year-old male patient presented with chronic backache and bony ankylosis of the bilateral S.I. joints with focal sacroiliitis. Sagittal T2W image (A) of the dorsolumbar spine shows multiple T2 hyperintense Romanus lesions in the vertebrae (arrow) with squaring of the vertebral bodies. Coronal and axial STIR images (B & C) show ankylosis of the bilateral S.I. joints with a focal STIR hyperintense lesion in the lower two-thirds of the left S.I. joint. Fat-suppressed coronal T1 post-contrast image (D) shows nodular enhancement of the lesion (arrow). Axial DWI image (E) shows nodular restriction within the lesion. Coronal and axial CT scan bone window images (F & G) show the bony ankylosis of the bilateral S.I. joints (yellow arrows) with a lytic lesion and surrounding sclerosis in the left S.I. joint.
Post-contrast MRI in 45 S.I. Joints of Active Sacroiliitis
Patchy irregular marginal enhancement was observed in 21S.I. joints (46.7%) (Figure 2), patchy post-contrast enhancement within the abnormal STIR hyperintense areas of the iliac or sacral side of S.I. joints in 15 S.I. joints (33.3%) and diffuse heterogenous enhancement within the altered STIR hyperintense signal intensity bony lesions in 9 S.I. joints (20%) (Figure 6).
ADC Values of Case and Control Groups
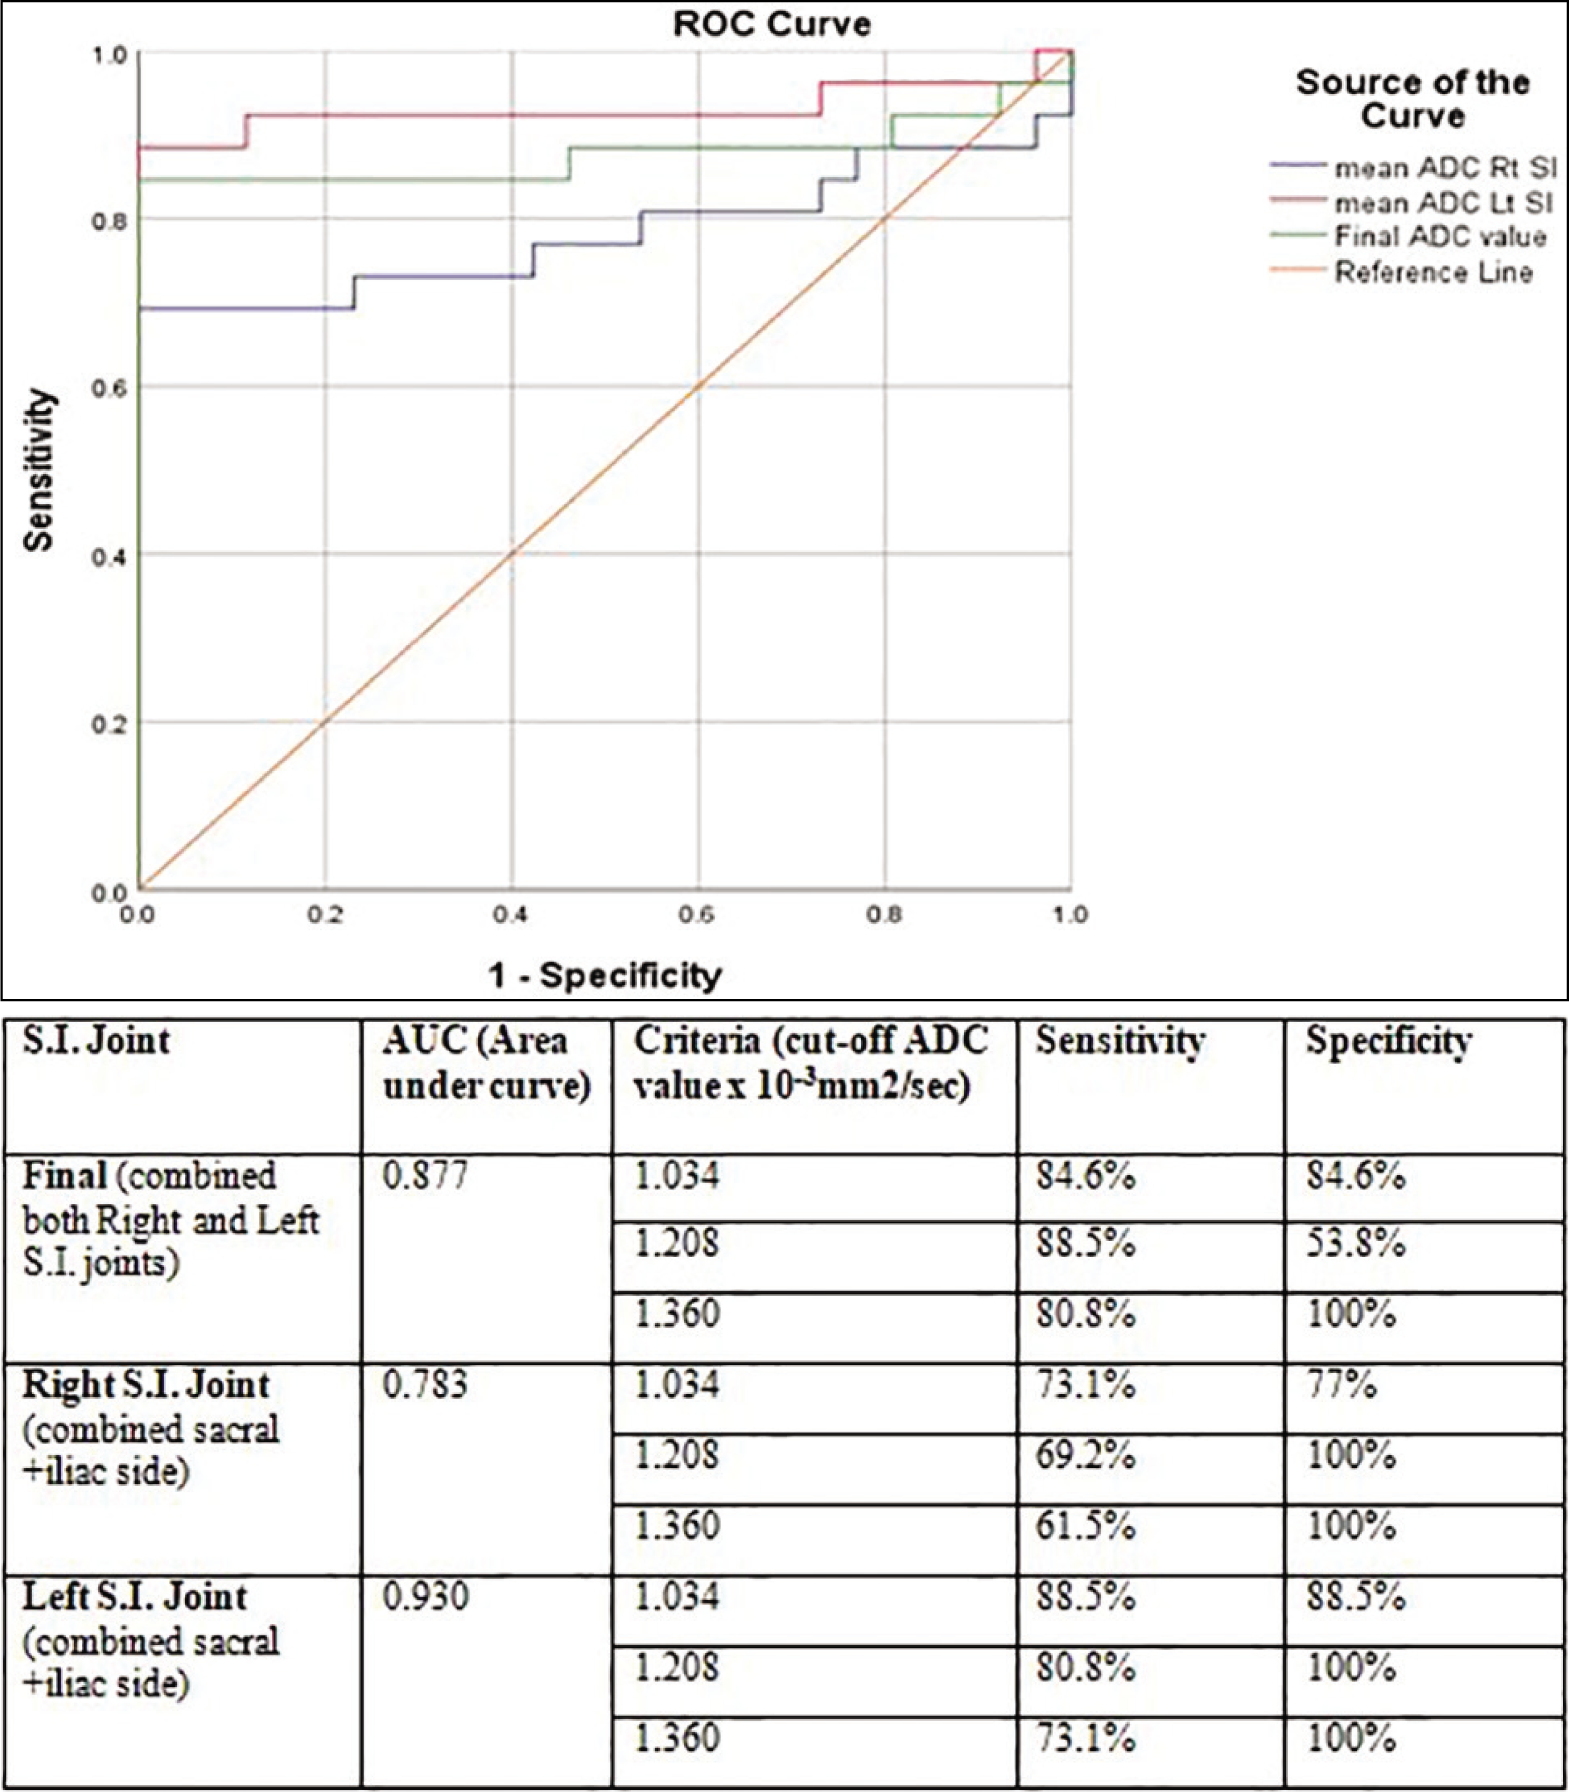
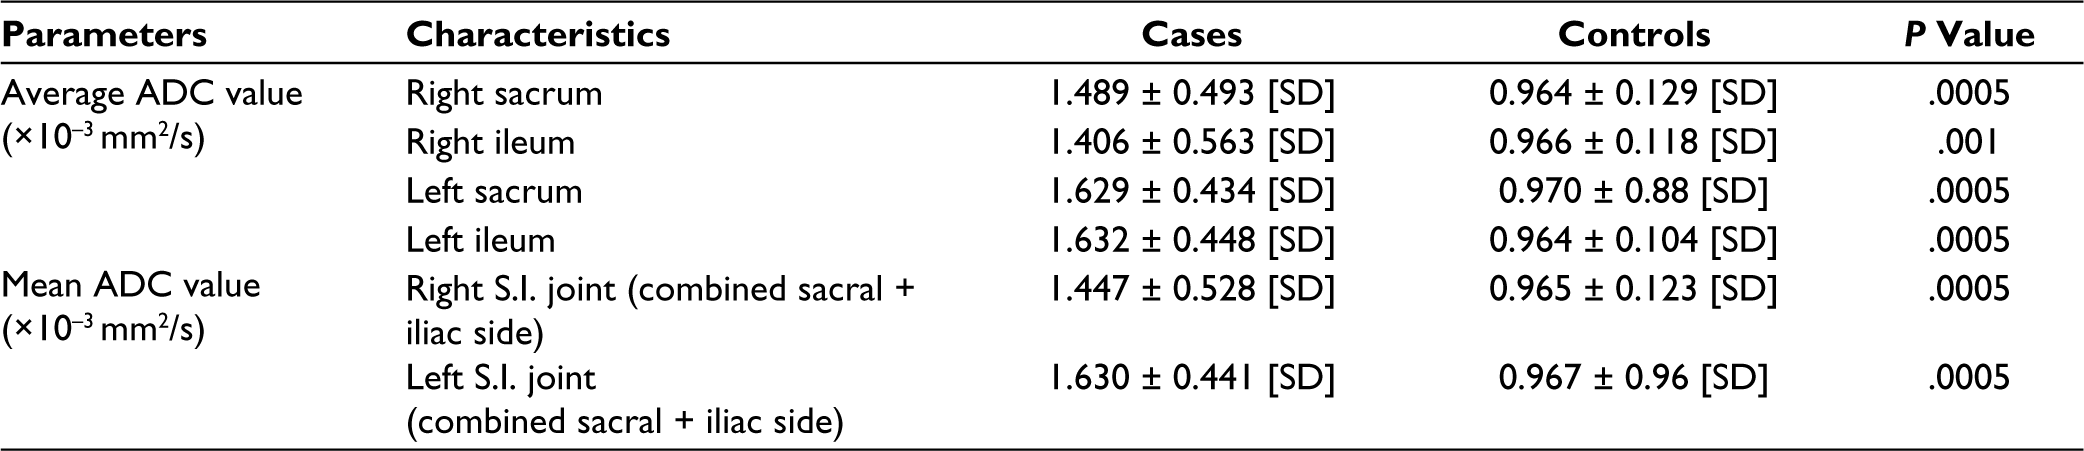
ROI placement within the sacral and iliac sides of S.I. joints is shown in Figure 3 in cases of active sacroiliitis. In 26 patients of active sacroiliitis (case group), the mean ADC value in the right S.I. joint measures 1.447 ± 0.528 [SD] × 10–3 mm 2 /s, while the left S.I. joint measures 1.630 ± 0.441 [SD] × 10–3 mm 2 /s. In the inactive sacroiliitis (control group), the mean ADC value of the right S.I. joint measures 0.965 ± 0.123 [SD] × 10–3 mm 2 /s while the left S.I. joint measures and 0.967 ± 0.96 [SD] × 10–3 mm 2 /s. The cut-off mean ADC value of 1.034 × 10⁻³ mm 2 /s was used for differentiating active sacroiliitis from inactive sacroiliitis based on ROC curve analysis with a sensitivity of 84.6% and specificity of 84.6% while combining the mean ADC values of both right and left sacroiliac joints (Figure 8).
Receiver operating characteristic (ROC) curve of mean ADC values of active sacroiliitis (case group) versus inactive sacroiliitis (control group).
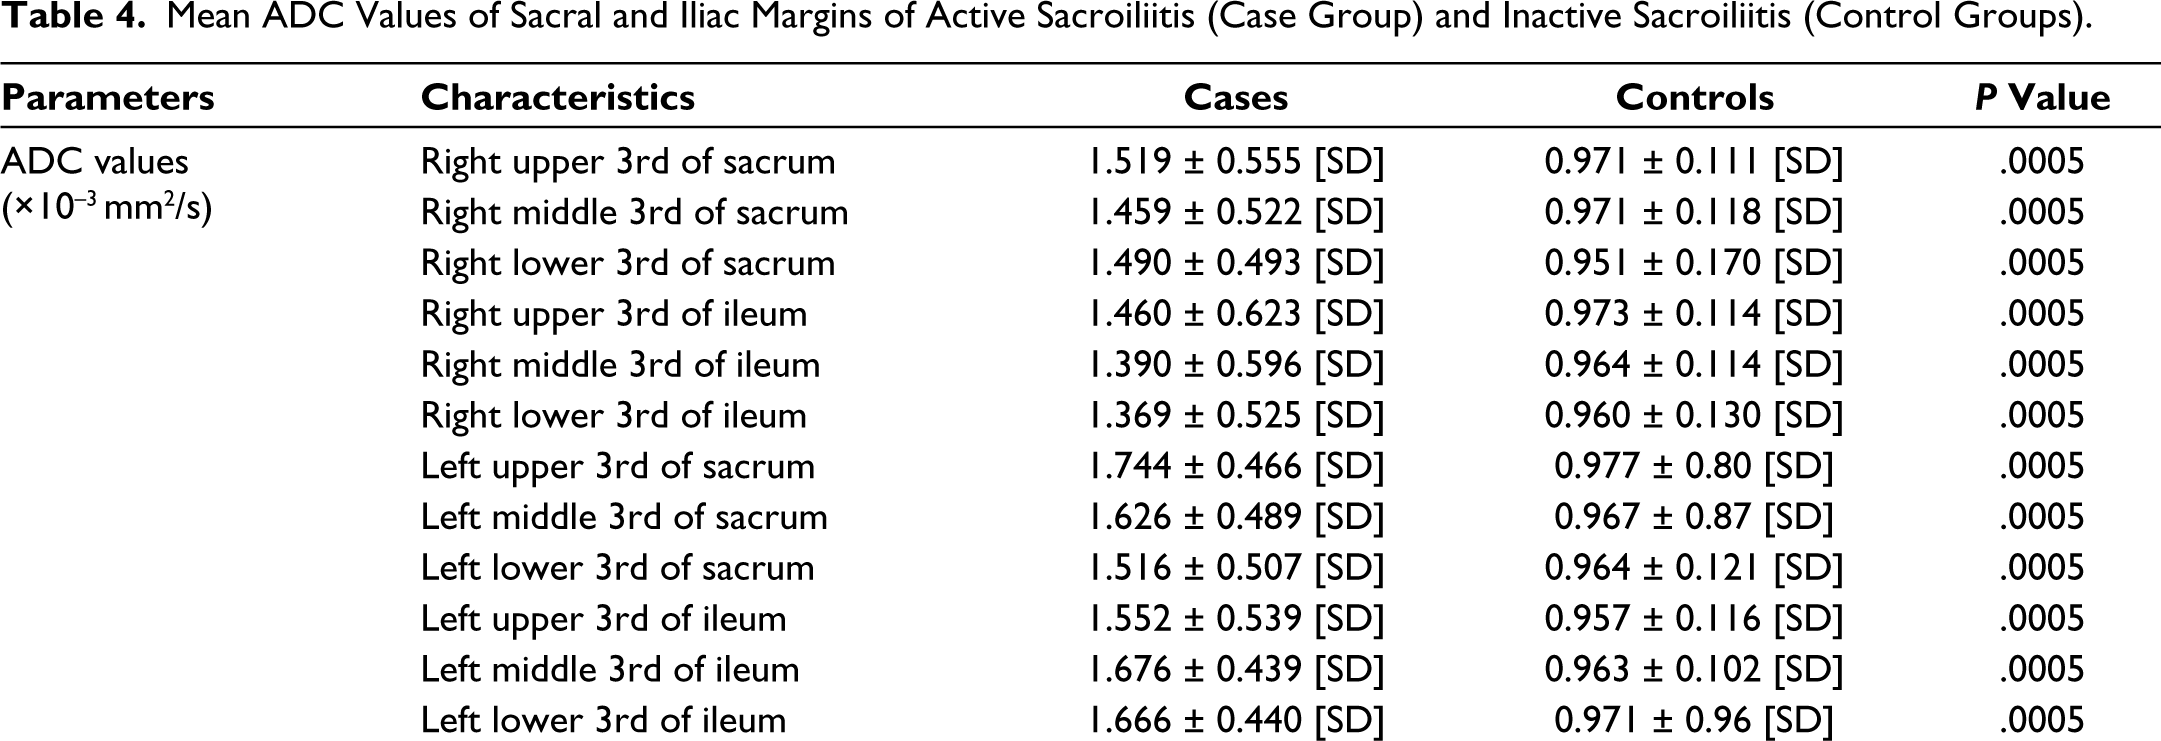
Unpaired student t-test showed a statistically significant difference between the active sacroiliitis (case group) and inactive sacroiliitis (control group) with a P < .0005 as shown in Table 4.
Mean ADC Values of Sacral and Iliac Margins of Active Sacroiliitis (Case Group) and Inactive Sacroiliitis (Control Groups).
Discussion
In 2009, an MRI scan was added to the ASAS diagnostic criteria for SpA. 15 The axial seronegative SpA is a multi-system involving autoimmune disease that starts affecting the patient’s quality of life; therefore, early diagnosis and therapy are crucial in the management of axial SpA. 16 On plain radiographs, it takes several years for sacroiliitis to appear after symptom onset.17,18 MRI helps in better interpretation of active BMO, erosive lesions, sclerotic changes in the bone and status of joint space. 19 MRI is the investigation of choice for diagnosing active sacroiliitis and early detection of complications of seronegative axial SpA, especially in AS, such as bony ankylosis, pathological spinal/ pelvic fracture, cauda equina syndrome, dural ectasia, etc.20–22
With advancements in multi-modality MRI with DWI and ADC mapping help in the reduction of false positive results in the diagnosis and detection of treatment response for active sacroiliitis. 23
The MRI sacroiliitis criteria of ASAS 2009 includes:
Active inflammatory lesions of the sacroiliac joints: BMO (on STIR) must be located in the anatomical areas (subchondral or periarticular bone marrow). Solitary BMO lesion, if seen, should be visible on at least two consecutive slices. Documentation of inflammation using a single slice is sufficient if more than one BMO lesion is seen on one slice. The presence of enthesitis, synovitis, or capsulitis in the absence of BMO or osteitis cannot be considered sufficient for classification.
MRI depiction of active BMO in sacroiliitis of seronegative spondyloarthropathies corresponds to inflammation that reflects the significant positivity of HLA-B27 positivity. 24
A previous study showed a 90% probability of having SpA in patients with HLA-B27 positivity and BMO detected on MRI scan. 25 ADC mapping plays a vital role in assessing the disease activity of the sacroiliitis and even early identification of treatment response to drug therapy.
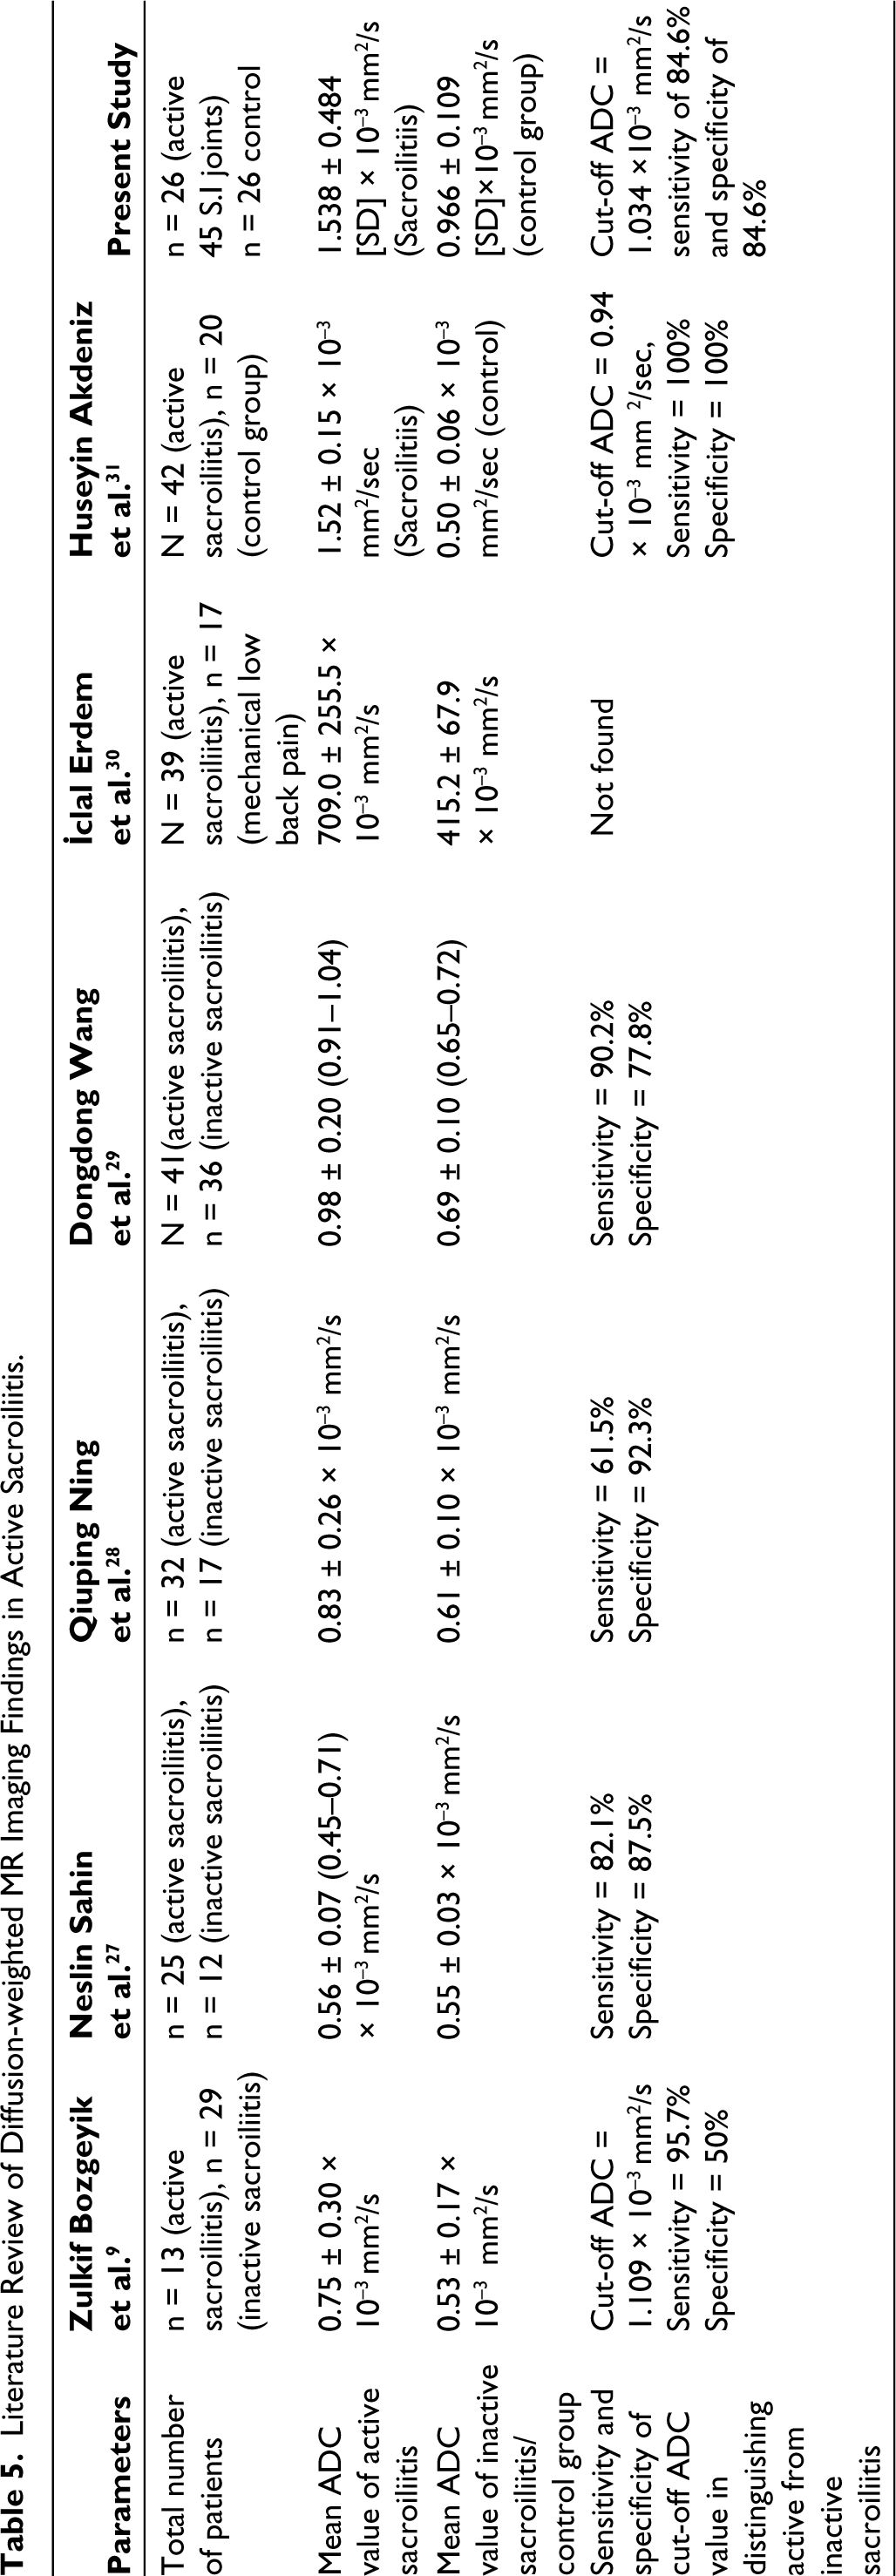
Table 5 shows the review literature with various ADC values in the early detection of active sacroiliitis and differentiation of active from inactive disease. In our study sample, sacroiliitis manifested as unilateral and bilateral asymmetrical and bilateral symmetrical forms. The lower two-thirds of the sacroiliac joints were predominantly affected, with active BMO and marginal bony erosions observed in the majority of cases. These findings underscore the heterogeneous nature of active sacroiliitis and emphasise the importance of comprehensive imaging evaluation in its assessment.
Literature Review of Diffusion-weighted MR Imaging Findings in Active Sacroiliitis.
Our study evaluated the utility of ADC mapping in active sacroiliitis. We observed significantly higher ADC values in active sacroiliitis patients compared to the controls, indicative of altered tissue diffusion characteristics in affected sacroiliac joints. This suggests that DWI holds promise as a sensitive imaging modality for detecting early inflammatory changes in active sacroiliitis, potentially facilitating earlier diagnosis and the institution of the treatment regimen.
Additionally, post-contrast MRI revealed distinct enhancement patterns, further delineating the extent and nature of active sacroiliitis lesions. Patchy irregular marginal enhancement, patchy enhancement within abnormal STIR hyperintense areas, and diffuse heterogeneous enhancement within bony lesions were among the observed patterns, highlighting the multifaceted radiological manifestations of active sacroiliitis. Appearance of intervening areas of T1 hyperintense fatty depositions in treated active sacroiliitis patients along with decreased ADC and nADC values represents the treatment response to the drug therapy.11,12 Appearance of T1 and T2 hypointensities without intervening STIR hyperintense active BMO representing bony sclerosis of chronic healed sacroiliitis. 26
Elevated levels of CRP and a high prevalence of HLA B27 antigen positivity further corroborated with the inflammatory nature of active sacroiliitis in our patient cohort. These findings underscore the importance of integrating clinical, radiological, and serological parameters in the diagnostic workup of axial SpA.
In conclusion, our study provides insights into the clinical and radiological characteristics of active sacroiliitis associated with axial seronegative SpA. The observed alterations in ADC mapping in conjunction with conventional MRI findings and serological markers, underscore the potential utility of a multi-dimensional approach in the early diagnosis and management of sacroiliitis. Further research is warranted to validate our findings and to optimise the role of ADC mapping in seronegative SpA on MRI using different magnetic field strengths in clinical practice.
Footnotes
Declaration of Conflicting Interests
The authors declared no potential conflicts of interest with respect to the research, authorship and/or publication of this article.
Ethical Approval
Institutional ethics review committee permission was obtained.
Funding
The authors received no financial support for the research, authorship and/or publication of this article.
Informed Consent
Informed consent was obtained from all case and control groups.