
Abstract
Literature has shown increasing research on resilience that can help young people deal with mental health problems and improve life satisfaction, well-being, and happiness. However, empirical evidence about the role of resilience has not been proved across cultures, especially in low- and middle-income countries. One of the reasons is the lack of valid measures for assessing resilience. Due to the sensitivity in the number of items and factors of the simple-to-use CD-RISC-10 in many studies, this study aims to achieve the following goals: (a) re-investigate the psychometric properties of CD-RISC-10 and compare those with other models to suggest a better fit structure among Vietnamese youth; (b) to explore the correlation between sociodemographic variables and resilience; (c) to examine the association between emotional intelligence and resilience; and (d) to examine the association between resilience and satisfaction of life. A cross-sectional school-based survey was conducted on 484 students. Findings revealed a valid and reliable scale of the Vietnamese version of the CD-RISC-10 with two subscales: Coping and Optimism. Resilience and its factors did not relate to sex and residence location. Findings showed a strong correlation between resilience, emotional intelligence, and life satisfaction. Emotional intelligence positively predicts resilience, which in turn positively predicts life satisfaction. Limitations and suggestions for future investigation are discussed in this paper.
Introduction
Dealing with mental illness, resilience is a concept that has attracted many researchers recently. Resilience is the process of adapting well when facing adversity, trauma, tragedy, threats, or stress.1, 2 Accordingly, resilience is linked with coping, which means that a person can do well despite how challenging the at-risk situations are. 3 Literature has shown that resilience negatively correlates with negative well-being indicators, such as depression, anxiety, perceived stress, and suicide.4–10 Resilience is also positively correlated with positive well-being indicators, such as life satisfaction, perceived happiness, and positive emotions.11–16 Some evidence reported that resilience intervention programs could improve well-being, hope, university retention, and academic performance among university students.17–21
In another aspect, resilience positively correlates with emotional intelligence (EI). 22 According to Salovey et al, 23 high EI increases the ability to cope with emotional challenges as they can “accurately perceive and appraise their emotions, know how and when to express their feelings, and can effectively regulate their mood states” (p. 161). People with suitable EI use humor, relaxation, and optimistic thinking to purposefully trigger pleasant feelings against aversive events.24, 25 Therefore, EI can positively predict resilience. 26
One of the global trends is developing prevention and intervention programs towards developing resilience to enhance mental health for young people. However, scientific evidence regarding resilience is limited and incomplete across cultures, especially in low- and middle-income countries. One of the first reasons was the lack of validated measurement of resilience. The 10-item Connor-Davidson Resilience Scale (CD-RISC-10) recommended by Campbell-Skills and Stein 27 is the most popularly used tool worldwide (Windle et al. 2011). 28 This scale yields one resilience factor that fits the author’s data well. This version was translated into many languages and showed a unidimensional structure.29–31 However, some other studies reported misfit items 32 or even yielded a two-factor model. 32
Vietnam is a lower-middle-income country, 33 with 20% of the national population being youth. It is estimated that at least 3 million Vietnamese youth have mental disorders. Nonetheless, only 20% received the necessary medical assistance and treatment. 34 There is hardly any prevention program or mental health support service for university students in this country. On such a practical level, research on resilience is essential in Vietnam to promote efficient programs to improve the well-being of the young generation. Perhaps, the first step is to validate measurement on resilience.
The CD-RISC-10 has been validated among 414 Vietnamese undergraduates using confirmatory analyses (CFA) and item response theory approaches. The finding confirmed the fitness of the unifactorial structure. 35 However, this study used a convenient recruitment sample based on the authors’ network and colleagues, which might lead to bias in response and unrepresentative university students. Given the limitation of the CD-RISC-10 validation in Vietnam, the reminder from the author when applying these results to different samples of university students, 35 the sensitivity in the number of items and factors of this simple-to-use instrument across cultures, we decided to re-investigate the psychometric properties of the CD-RISC-10 in this study and compare those with other models to find the better fit structure for Vietnamese university students. Besides, the following hypotheses will be empirically tested: (a) sociodemographic characteristics are significantly correlated with resilience; (b) resilience is positively correlated with EI and life satisfaction; (c) the potential factors of resilience are significant in predicting life satisfaction; (d) EI is significant in predicting resilience and its factors.
Materials and Methods
Participants and Procedure
This study randomly invited four member universities in Central Vietnam, year 1 and year 2 (ages of 18 and 19), including social and scientific students, with active, informed consent for participation obtained from the university’s director. After choosing randomly 3 to 4 classes of years 1 and 2 from each university, all students in selected classes were invited to participate. All participants were in their late adolescence.
The questionnaire was delivered to students by the research team. Opt-out consent was applied. If the student completed the questionnaire and voluntarily returned it to the research assistants, they agreed to participate in this study. The purposes of the study, the process and requirements of filling out the questionnaire, and the participants’ rights, consent, and confidentiality were explained clearly before the data collection. All raised questions were answered. Teachers of the class and the research team remained in class with appropriate private space for students to answer the questionnaire.
Measurements
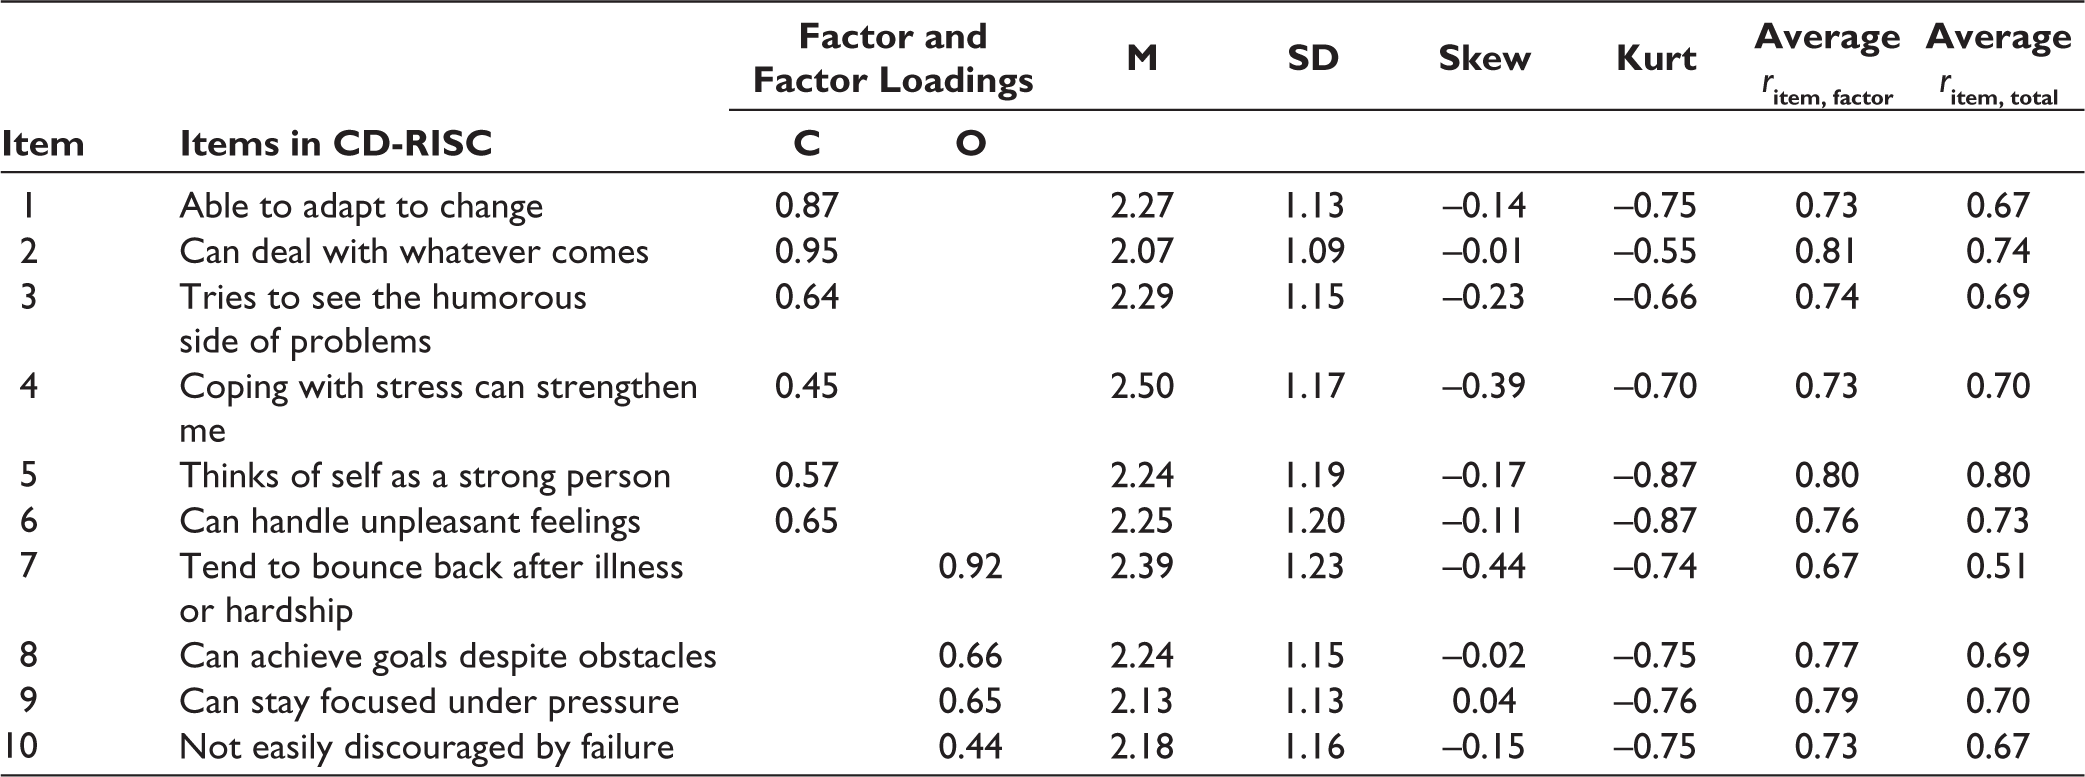
An anonymous self-completed questionnaire was used with the following instruments to collect data for the study. The CD-RISC-10 27 is the abbreviated version of the full Connor-Davidson 25-item scale. 36 The content of 10 items is presented in Table 1. The respondents self-rated from 0 (Not true at all) to 54 (True nearly all the time) for each statement.
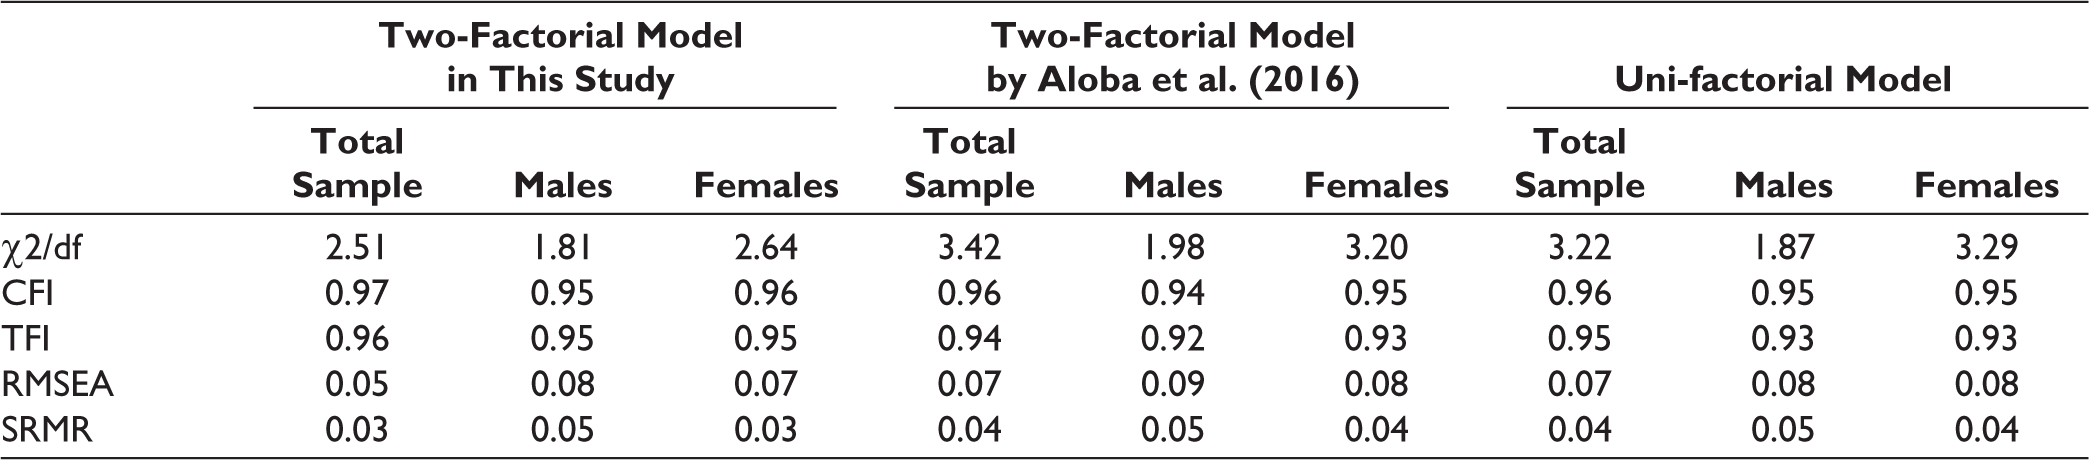
Comparison of the Goodness of Fit Indices of the CD-RISC-10-VN.
EI was measured using the 30-item Trait EI Questionnaire—Short Form (TEIQue-SF) developed by Petrides. 37 Participants were asked to select answers from the 7-point Likert structure that ranges from 1 “Strongly disagree” to 7 “Strongly agree.” The global EI score is obtained by the arithmetic average of the 30 items after reserving scores of the negative items. The higher the global score, the higher trait EI a person has. The TEIQue-SF has been translated and validated on youth in many countries (Cronbach’s Alpha ranged from 0.81 to 0.87) (Mikolajczak et al. 2007; Petrides 2006; Stamatopoulou et al. 2018).39–41 Cronbach’s Alpha of the global EI in this study was 0.74.
Satisfaction with Life Scale (SWLS) 42 was used to investigate participants’ life satisfaction. A 7-point Likert rating ranging from 1 (strongly disagree) to 7 (strongly agree) applied for 5 items. The overall life satisfaction score was calculated by summing all items. The higher the score, the higher the life satisfaction. This scale has been used widely in Vietnam with the accepted validation among university students (Cronbach’s Alpha = 0.75). 39 Cronbach’s Alpha of the SWLS in this sample was 0.76.
Cultural Adaptation and Face Validity of the CD-RISC
Due to the CD-RISC Vietnamese version’s unavailability and failure to contact the authors of the previous validation study, we decided to translate the scale again. This process was performed following Borsa’s guidelines. 40 First, two bilingual psychologists translated the CD-RISC from English to Vietnamese independently. The first author of this manuscript reviewed the two translations and discussed with the translators for agreement. Next, the scale was conducted on 5 first-year students to check the language of the questionnaire. The questionnaire was then back-translated into English independently by 2 other independent translators. All translated and back-translated versions were considered semantic, idiomatic, experiential, and conceptual equivalence by public health and psychology experts.
Data Analysis and Management
Eleven responses with more than 50% missing information or strange pattern answers were excluded from the data analysis. The percentage of missing data was 1.8% for this sample which was less than 0.3% by variable. Therefore, further analysis followed the maximum likelihood suggestion.41, 42 The final sample size contained 484 completed questionnaires. All analyses were conducted in Stata version 14.0. 43
First, CFA was conducted to check the fitness of previously suggested models for this data, including the unifactorial model recommended by the author of the CD-RISC-10 27 and the 2-factorial model recommended by Aloba et al. 32
To explore the potential number of factors of the shortened CD-RISC on this sample, an (EFA) was conducted. The adequacy of the data retrieved from EFA was tested using Barlett and Kaiser-Meyer-Olkin (KMO > 0.8) and Barlett’s Test of Sphericity (P value < .05). 44 Principal components extraction and oblique Promax rotation were used to assume that factors within the 10-item CD-RISC might be correlated. 45 The item with a rotated factor loading of under |0.4| (meaning ≤ +0.4 or ≥ –0.4) onto one of the factors was eliminated.46–48
CFA using robust maximum likelihood estimation were then performed to test the appropriateness of the hypothesized model retrieved from the EFA. The decision was made based on the following indices: Comparative fit index (CFI), Tucker-Lewis Index (TLI), Root Mean Square Error of Approximation (RMSEA), Standardized Root-Mean-square Residual (SRMR), and normed chi-square value (χ2/df). 49 The good model fit was applied according to the suggestion of the conventional guidelines: χ2/df ≤ 3, TLI ≥ 0.95, CFI ≥ 0.95, RMSEA ≤ 0.06, and SRMR < 0.05.50, 51 However, in some cases of less stringent standards, χ2/df ≤ 5,52, 53 CFI ≥ 0.80, RMSEA, and SRMR < 0.08 are also acceptable.54–56 Sensitivity analysis, in which factor structure of the CD-RISC-10-VN was performed separately for males and females, was also conducted. A comparison between the model retrieved from this study and the models suggested from previous studies will be shown to identify the better fit structure of the scale.
The cut-off points for each subscale representing factors found from the EFA were calculated. The reference range was determined using the Mean ±2SD method. The reference range was determined using the 2.5th and 97.5th percentiles of the score if the distribution was asymmetric. 57
The internal reliability of the scale scores was evaluated by calculating the internal consistency coefficient alpha. 58 The coefficients ranging from 0.7 to 1.0 indicate high internal reliability.59, 60 Correlations and multiple linear regression were then applied to determine the relationship between resilience, EI, and life satisfaction.
Results
Cultural Adaptation and Face Validity
A few concerns were raised related to the translation and instruction of the questionnaire. Significantly, the translation of the word “humorous” as “tiếu lâm” (Vietnamese) confused young adults as this is an unpopular word. “Hài hước” and “khôi hài” were recommended for substitution. Finally, the term “hài hước” has been chosen. The CD-RISC-10-VN instruction was shortened and simplified for clarity. The rest of the scale was reported to be comprehensive, appropriate, and easy to complete based on the feedback of 5 random first-year students.
Survey Sample
The number of returned questionnaires was 612, of which 484 answers were valid and used for analysis (response rate 82.2%). Participants included first-year and second-year students aged from 19 to 28 (mean = 20.44, SD = 1.26). More than half of the participants were female (73.3%), and half were from rural areas (50.2%). Most of them had parents living together (86.3%).
Factor Structure and Construct Validity
In the first step, CFA was conducted to examine the fitness of the factorial structure from previous studies to this data. The unifactorial model showed the results of χ2/df = 5.9, CFI = 0.91, TLI = 0.88, RMSEA = 0.10, and SRMR = 0.5, while those for the 2-factorial model were χ2/df = 4.59, CFI = 0.94, TLI = 0.91, RMSEA = 0.09, and SRMR = 0.5. Both suggested models did not reach the expectation with insufficient indices. However, after adjusting potential inter-item correlations, the 2 models revealed an acceptable fit to this data (Table 1). Due to the inconsistency of the psychometric properties of the CD-RISC-10, we decided to perform EFA in the second step to identify whether there were any latent factors of the CD-RISC-10-VN that better fit this data set.
In this sample, the KMO and Barlett’s test was adequate and analyzable for the factor analysis (KMO = 0.90; df = 45; χ2 = 1909.35, P < .001). EFA revealed a 2-factor solution with the interpretability of the factors. Six items, including items 1, 2, 3, 4, 9, and 10 of the CD-RISC-10-VN, loaded strongly on factor 1 (factor loadings > 0.45). The rest 4 items (items 5, 6, 7, and 8) loaded strongly on factor 2 (factor loading > .40). Factor loadings ranged between 0.44 and 0.95 (Table 2). The 2 factors accounted for 43.5% and 35.6% of the variance in the CD-RISC-10-VN (Table 3).
Factor Loadings of the CD-RISC-10-VN.
In the third step, the 2-factor model retrieved from EFA was tested using CFA with maximum likelihood estimation. Males’ and females’ data were also analyzed separately. All requested indices showed an acceptable fit to this sample. The comparison of indices from the 3 models is illustrated in Table 3. CFA analyses revealed that this study’s model provided a superior fit to the data for the overall sample as well as males and females (Table 1).
Internal Consistencies and Descriptive of the CD-RISC-10-VN.
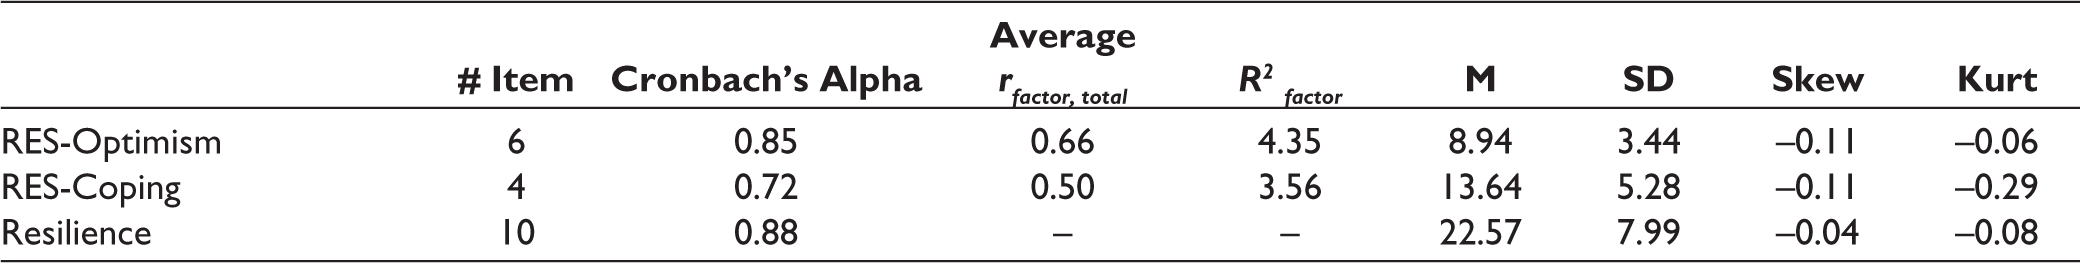
The internal reliability was considered good, with Cronbach’s Alpha of 0.88, 0.87, and 0.72 for the total resilience and 2 factors. Other indicators and the correlations between the 2 factors are presented in Table 4 with acceptable values.
Descriptive Statistics
The mean average score of 10 items ranged from 2.07 to 2.50, in which item 4 (Coping with stress can strengthen me) had the highest mean score and item 2 (Can deal with whatever comes) had the lowest mean score. Identified in the EFA, factor 1 included 6 items focusing on information about a person’s optimism and self-confidence in solving challenging situations (failure, hardship, obstacles, or under pressure). Factor 1 is named as RES-Optimism. Higher scores in RISC-Optimism indicate a higher level of optimism and self-confidence than a person has. Factor 2 is named as RES-Coping with 4 items, focusing on the reaction or coping of a person according to different events in their life. Higher scores in coping subscale indicate a higher coping ability that a person has in dealing with difficult situations. The means and standard deviations of the 2 subscales are illustrated in Table 4.
Correlations and Standardized Regression Coefficients among Resilience, Life Satisfaction and EI.
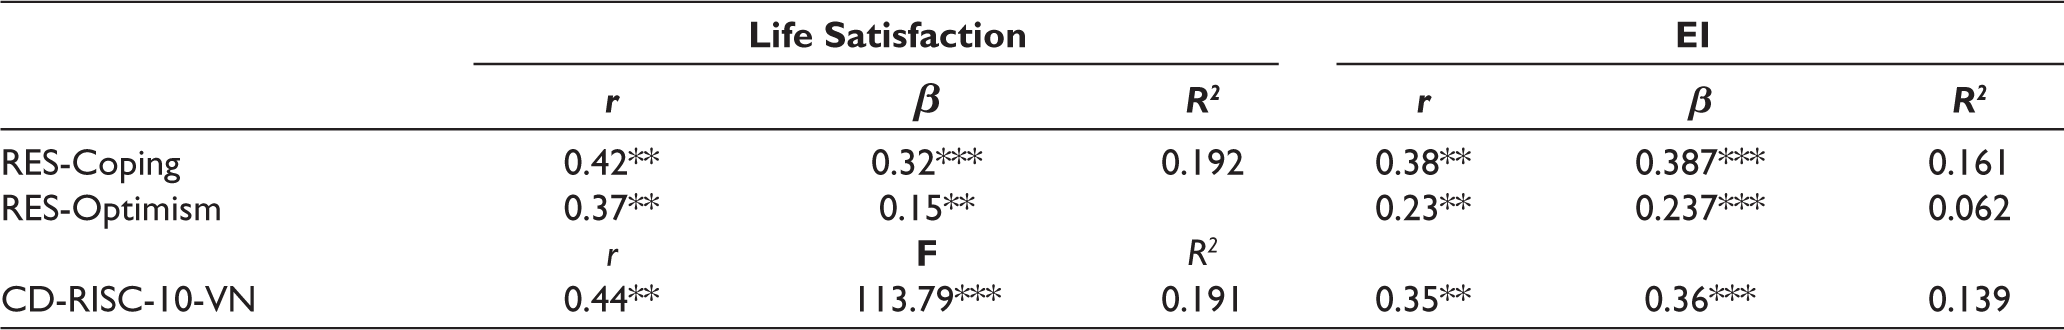
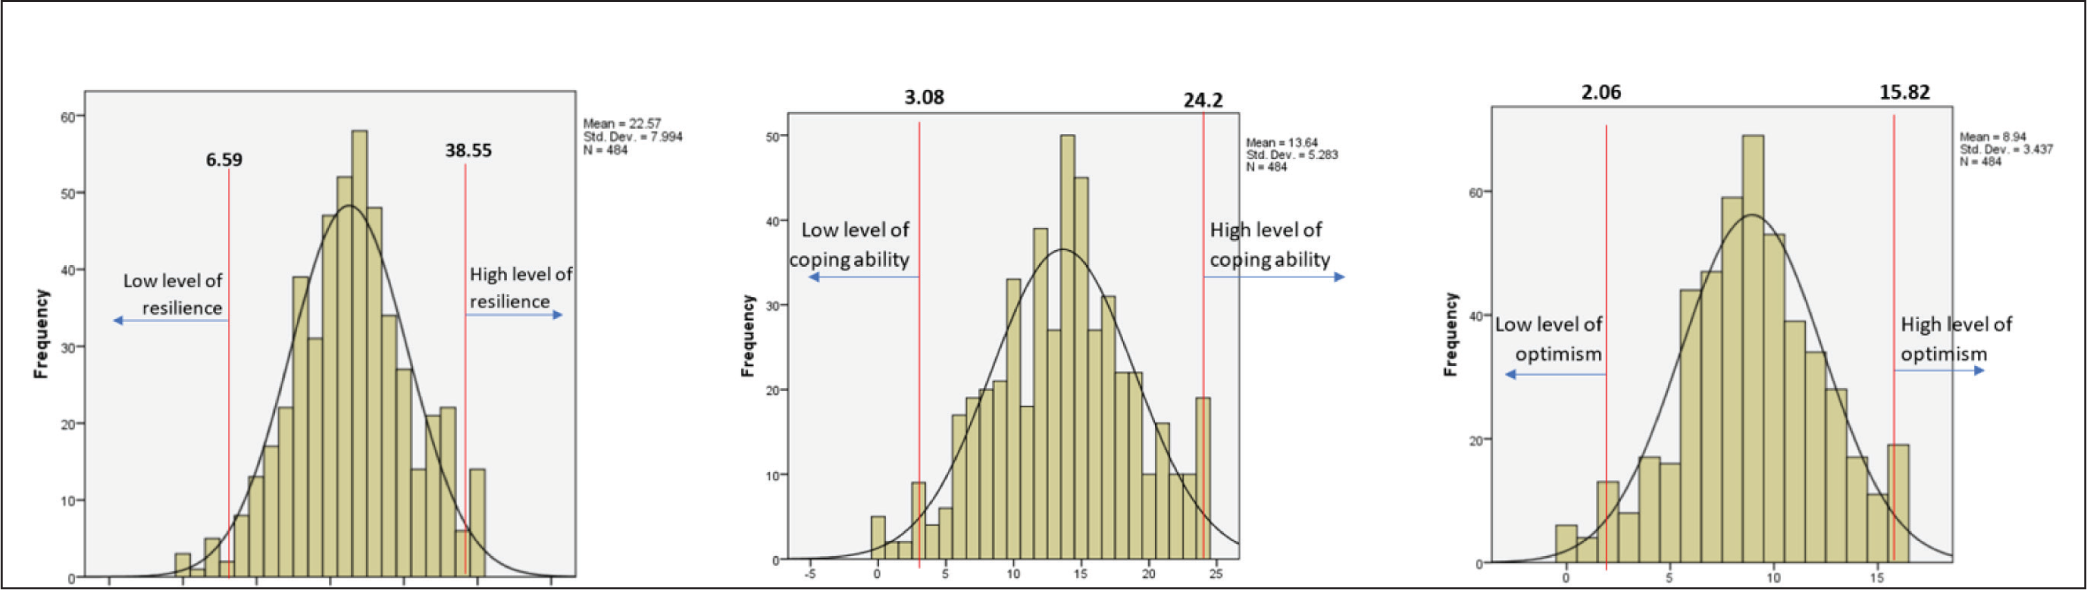
Figure 1 shows that scores of the total resilience and 2 recommended subscales followed normal distributions (skewness and kurtosis values are in the range of –1.0 to 1.0). The mean ± 2SD was thus used to identify the cut-off score. Accordingly, for RES-Optimism, a score > 15.82 indicates a high level. A score < 2.06 indicates a low level of correspondents’ optimism and self-confidence in solving problematic situations. For RES-Coping, a score > 24.2 indicates a high level, and a score < 3.08 indicates a low level of correspondents’ coping ability. For the overall resilience, a score > 38.55 indicates a high level, and a score < 6.59 indicates participants’ low level of resilience.
Distribution and Cut-off Points of CD-RISC-10-VN and Its Two Factors Scores among University Students in Vietnam (n = 484).
Resilience, Satisfaction with Life, and Emotional Intelligence
The prediction of resilience total score, the 2 factors on the satisfaction with life, and the prediction of EI on resilience were tested by linear regression. To decide whether any sociodemographic variables should be included in the correlation and regression analysis, 2 MANCOVA was conducted. The first one had sociodemographic variables as independent variables and satisfaction with life as dependent variables. The second one had sociodemographics as independent variables and resilience as dependent variables. The two analyses did not find any significant multivariate effects based on Wilk’s lambda. Therefore, none of the sociodemographic variables was included in the analysis for correlation and linear regression. As expected, findings revealed that resilience and its 2 factors were positively related to life satisfaction among young adults. RES-Coping, RES-Toughness, and overall resilience correlated well with life satisfaction. They also predicted and explained more than 19% variance in participants’ life satisfaction (Table 4). Regarding EI, resilience and its 2 subscales strongly correlated with EI. EI positively predicts resilience, RES-Coping, and RES-Optimism. EI can explain 5.6% variance of RES-Optimism (F = 10.53, P < .001); 14.9% variance of RES-Coping (F = 30.80, P < .001); and 12.7% variance of the overall resilience (F = 25.74, P < .001).
Discussion
The benefits of school-based resilience and EI prevention and intervention programs are encouraged globally to increase the mental health of the young generation and the promising cost-saving for integrating training resilience and EI for budget-constrained countries. However, conducting these programs in Vietnam is challenging due to the lack of validated instruments and the unstable latent dimension of the CD-RISC-10 across cultures. Therefore, we adapted the CD-RISC-10 to provide further evidence about the psychometric properties of this well-known measurement on a sample of Vietnamese university students. The findings suggest that the 2-factorial model in this study is reliable, valid, and a better fit for use among youth studying at universities in Central Vietnam. Reference scores for the overall resilience and 2 subscales have also been recommended for this sample.
Construct Validity and Cut-off Points
The number of factors retrieving in this study was similar to a previous study in Nigeria 32 with no eliminated items. However, the item loading on each factor was a little bit different. In the current study, the 2-factorial structure model represented RES-Coping (item 5, 6, 7, and 8) and RES-Optimism (item 1, 2, 3, 4, 9, and 10) while that from the study among nursing students in Nigeria were “toughness” (item 4, 6, 7, 8, 9, and 10) and “motivation” (item 1, 2, 3, and 5). Our structure better fits this data than most previous studies’ unifactorial structure, including the one on Vietnamese university students.28–30,35 The difference might be due to the translation process that led to the varied understanding of the item among university students as there was a warning about the nonunique construct of the resilience concept. The difference in the sampling method might be another reason. Further research was required among other populations in Vietnam to confirm the latent structure of the CD- RISC-10-VN.
The internal consistency of the scale in our data was 0.88, which was higher than that of the original version (Cronbach’s α = 0.85) 27 and other studies conducted among university students (Cronbach’s α ranged from 0.81 to 0.87).32, 61 Cronbach’s α of each subscale was also > 0.70, which is considered satisfactory (Table 4). 62
Resilience, Life Satisfaction and Emotional Intelligence
Our findings showed optimistic prediction of resilience to life satisfaction—the positive aspect of mental health, among university students. The duplication was found in previous studies among university students in Saudi Arabia, 63 Iran, 64 Romania, 65 Turkey,66, 67 Latinx, 68 Malaysia, 69 and China. 70 This study added to the literature on the positive association between stability of resilience and life satisfaction across cultures.
In terms of EI, as expected, findings in this study showed a robust predictive role of EI in resilience and its two factors. This result was in line with a previous study conducted on undergraduate students 71 (Bano & Pervaiz, 2020; Shukla et al, 2020).75, 76 It is explained that people with higher EI can use positive emotions to deal with problems.77, 78 In other words, high EI people can understand, express, and manage their feelings well to develop self-regulatory processes that support them in coping better with hazardous situations related to emotions. 23 Those people also have good social and relational skills that encourage them to seek help much more quickly when they handle challenging circumstances. Later on, the characteristics of EI can be applied to the recovery process. 74 The finding in this study refused the argument that EI encompassed resilience 75 and confirmed EI as the precursor of resilience. 76 Results from Trigueros et al 26 among 1,347 students at the University of Elmira (Spain) and from Schneider et al. 77 among 129 psychology students at a university in the United States shared the same conclusion.
There are a few limitations of this study that suggest cautious in considering the conclusion. First, the crosssectional design of the current study allowed the conclusion of correlation but not the cause-effect associations. A longitudinal study is another suggestion for further research. Second, data in this study was gained from self-reports by participants who might increase the risk of bias, such as students might self-evaluated their ability to cope with challenging situations higher than reality. Other research methods, such as observations and structured interviews, should be included. Third, this study focused on university students; therefore, it cannot be generalized to young adults in Vietnam. Future lines of research should replicate this investigation in other settings, such as those out of school. Fourth, this study only investigated the correlation between resilience and the positive aspect of mental health. The correlation between resilience and negative emotions such as depression, anxiety, and perceived stress should be considered in the future.
Conclusion
This study provides another psychometric property of the CD-RISC-10 that might fit youth sample in Asia. Cut-off points are also recommended. The results were obtained from university students studying a wide range of majors at 4 different educational institutions with a high response rate. This is the first study in Vietnam to determine the correlation between resilience and EI—another theme in positive psychology, and life satisfaction—a positive aspect of mental health. This study’s validation of the resilience instrument and initial reports about resilience among young adults are essential scientific literature for future investigation.
Footnotes
Declaration of Conflicting Interests
The authors declared no potential conflicts of interest with respect to the research, authorship, and/or publication of this article.
Funding
The authors received no financial support for the research, authorship, and/or publication of this article.
Statement of Informed Consent and Ethical Approval
Necessary ethical clearances and informed consent were received and obtained from all participants before initiating the study.