
Abstract
Background
Osteosarcoma, the predominant primary bone cancer in the pediatric and adolescent population globally, exhibits a relatively low annual incidence but contributes significantly to morbidity and mortality.
Objectives
The current study aims to explore the impact of cisplatin, apigenin, and their combination on human osteosarcoma cell line (MG-63) osteosarcoma cells, given the challenges in clinical treatment such as chemotherapy’s adverse effects, resistance development, and relapses.
Materials and Methods
Cytotoxicity assessment using the 3-(4,5-dimethylthiazol-2-yl)-2,5-diphenyltetrazolium bromide (MTT) assay was conducted for cisplatin, apigenin, and their combination. Apoptotic potential was evaluated through ethidium bromide (EtBr)/acridine orange (AO) dual staining for the combination treatment. Reactive oxygen species (ROS) production and cell cycle arrest were analyzed posttreatment with the cisplatin + apigenin combination using 2′-7′-dichlorodihydrofluorescein diacetate (DCF-DA) staining and fluorescence-activated cell sorting (FACS) analysis, respectively. Proapoptotic and antiapoptotic gene expression was assessed via quantitative polymerase chain reaction (qPCR) analysis. Additionally, messenger ribonucleic acid (mRNA) and protein expression of B-cell-specific Moloney murine leukemia virus integration site 1 (BMIL1) were analyzed in both untreated and cisplatin + apigenin treated cells. Enzyme-linked immunosorbent assay (ELISA) analysis was performed for p16INK4a, E-cadherin, and Notch1.
Results
Results indicated that the combination treatment significantly inhibited MG-63 cell proliferation compared to individual treatments. Enhanced apoptosis and ROS production were observed in the combination treatment, along with cell cycle arrest at the subG0-G1 phase. Furthermore, the combination downregulated BMIL1 and Bcl-2 expression while upregulating mRNA expression of Bax, Caspase-3, Caspase-9, Apaf-1, and p53. Gene expression results corroborated BMIL1 downregulation in the combination treatment. Additionally, protein levels of p16INK4a and E-cadherin were significantly decreased in the combination treatment compared to individual treatments and untreated control.
Conclusions
In conclusion, cisplatin and apigenin combination exhibited superior efficacy against osteosarcoma.
Introduction
Osteosarcoma, a prevalent malignant bone tumor associated with significant mortality primarily due to pulmonary metastases, often leads to bone defects and subsequent functional impairment and disfigurement as a result of cancer cell erosion and surgical resection (Xu et al., 2021). This specific cancer stands as the most common nonhematological bone tumor observed in individuals aged 10–14, constituting approximately 3–5% of childhood cancer cases (Mirabello et al., 2009). While osteosarcoma primarily affects the younger population, individuals aged 50 and above constitute the second most vulnerable demographic to this type of bone cancer (Kansara et al., 2014). Osteosarcoma predominantly arises from mesenchymal cells and commonly manifests in the extremities and upper sections of bones, leading to notable limitations in mobility (Kumar et al., 2023). The prevailing method for managing osteosarcoma involves multimodal therapy, typically employing a combination of chemotherapeutic agents, namely, doxorubicin, methotrexate, and cisplatin, alongside either surgery or radiation therapy (Kazantseva et al., 2022). However, this therapeutic intervention has resulted in a 70% 5-year survival rate among individuals diagnosed with localized disease due to chemotherapy ineffectiveness attributed to chemo-resistance phenomena. Additionally, chemotherapeutic agents commonly induce various side effects, including cardiotoxicity, hepatotoxicity, and renal toxicity, thereby exacerbating the likelihood of tumor recurrence and progression (Marchandet et al., 2021). Despite advancements in treatments such as chemotherapy, immunotherapy, and radiotherapy, the prognosis remains bleak, particularly for cases with lung metastases, highlighting an urgent need for more effective therapeutic approaches to combat osteosarcoma (Xu et al., 2021).
One of the forefront approaches in cancer treatment involves the development of targeted therapies characterized by reduced toxicity levels, aimed at overcoming chemotherapy resistance and enhancing survival rates among cancer patients (Mahbub et al., 2022a). Research indicates that when chemotherapeutic agents like cisplatin are paired with a phytochemical compound, it significantly boosts the effectiveness in destroying osteosarcoma cells while minimizing adverse effects in comparison to its combination with other chemotherapy drugs (Kasiram et al., 2021). Montané et al. (2020) proposed the potential combination of chemotherapy agents with polyphenols, positing that polyphenols may augment the effectiveness of chemotherapy while mitigating the emergence of drug resistance, minimizing toxicity, and alleviating adverse effects on human health. Apigenin, a polyphenol compound, is abundantly present in various botanical sources including fruits, herbs, vegetables, and chamomile tea. Owing to its potent antitumor properties, apigenin has been used as a dietary adjunct. Studies have demonstrated the significant anticancer effect of apigenin against various types of cancer, including liver, lung, prostate, cervical, breast, lymphoma, and leukemia (Mahbub et al., 2022b). Apigenin has exhibited significant potential in inhibiting the proliferation of cancer cells, inducing cell cycle arrest, and promoting apoptosis in in vitro studies. Notably, it has demonstrated negligible impact on the proliferation of normal cells, indicating its promise as an anticancer agent without harming normal cellular functions (Mahbub et al., 2013). Research by Hussain et al. (2010) suggests that compared to similar flavonoids, apigenin shows minimal intrinsic toxicity and limited mutagenic properties. Furthermore, it has been observed to increase the accumulation of reactive oxygen species (ROS) within cells and enhance the expression of antioxidant enzymes, while decreasing the activity of superoxide dismutase (SOD) in cancerous cells (Crespo et al., 2008). Encouraging outcomes have emerged from both in vitro and in vivo investigations exploring combined therapies involving apigenin alongside conventional chemotherapeutic agents, marking a promising avenue in cancer drug development. Despite studies showcasing the effectiveness of combining apigenin with various chemotherapeutic agents such as paclitaxel and 5-fluorouracil, research on its efficacy against bone cancer, particularly osteosarcoma, is scarce. Additionally, the precise molecular mechanisms underlying the synergistic effects of apigenin and cisplatin against cancer remain unclear. Hence, this study aims to explore the impact of combining apigenin with cisplatin on osteosarcoma cells, utilizing human osteosarcoma cell line (MG-63) cell lines.
Materials and Methods
Cell Culture Media and Chemicals
Cisplatin, apigenin, (3-[4,5-dimethylthiazol-2-yl]-2,5 diphenyl tetrazolium bromide), cell culture grade dimethyl sulfoxide (DMSO), ethidium bromide (EtBr), acridine orange (AO), 2′-7′-dichlorodihydrofluorescein diacetate (DCF-DA) were purchased from Sigma, USA. Dulbecco’s modified Eagle’s medium (DMEM), fetal bovine serum (FBS), phosphate buffered saline (PBS), trypsin ethylenediaminetetraacetic acid (EDTA), and penicillin–streptomycin were purchased from Lonza, Switzerland. All the other fine chemicals, reagents, and solvents were purchased from Sigma and Merck, USA, respectively.
Characteristics of Apigenin
Apigenin, sourced from Sigma-Aldrich, a prominent research chemical supplier, is known for its high quality and consistency, making it ideal for pharmacological and biochemical studies. This compound, chemically recognized as 4′,5,7-trihydroxyflavone (C15H10O5), is provided with a purity of ≥95%, ensuring its reliability for precise research applications. Apigenin is typically a yellow to orange crystalline powder, soluble in organic solvents like DMSO, ethanol, and methanol, though it has limited water solubility. It exhibits a melting point of 335–340°C, indicating stability, and should be stored at −20°C in a dry, light-protected environment to prevent degradation. Accompanying certifications, including a Certificate of Analysis (CoA) and Safety Data Sheets (SDS), further guarantee its suitability for rigorous scientific investigations (Sigma-Aldrich, 2024).
Characteristics of Cisplatin
Cisplatin, supplied by Sigma-Aldrich, is a high-purity chemotherapeutic agent (≥98%) with the chemical name cis-diamminedichloroplatinum(II) and formula C6H6Cl2N2Pt. It appears as a white to off-white powder and is hygroscopic. Cisplatin is soluble in water and should be prepared fresh in sterile water or saline. It does not have a defined melting point due to decomposition upon heating. For optimal stability, it should be stored in a cool, dry place at −20°C to −80°C, protected from light and moisture. Sigma-Aldrich provides a CoA and a SDS for proper handling and safety precautions (Sigma-Aldrich, 2024).
Cell Line and Maintenance
MG-63 cells, derived from a 14-year-old Caucasian male with osteosarcoma, are fibroblast-like human osteosarcoma cells that are valuable for a variety of biomedical research applications. These cells are instrumental in investigating bone-related phenomena, including bone formation and differentiation. They are also employed as an in vitro model to assess aspects such as bone cell viability, proliferation, and adhesion. Characteristically, MG-63 cells exhibit a fibroblast-like morphology and demonstrate hypotriploidy with a modal chromosome number of 66, found in about 44% of the cell population. Additionally, nearly 2% of the cells show higher ploidy levels, and all cells contain a notable number of 18–19 marker chromosomes. The MG-63 cell line was first introduced by A. Billiau and colleagues in 1977 (Gómez-Benito et al., 2020).
The MG-63 was procured from ATCC, USA, and cultured in DMEM supplemented with 10% FBS and 1% penicillin–streptomycin. The cell lines were maintained at 37°C in a humidified atmosphere with 5% CO2 and were passaged on attaining a confluency rate of 80% for experimental investigations.
Cytotoxicity Assay
3-(4,5-Dimethylthiazol-2-yl)-2,5-diphenyltetrazolium bromide (MTT) assay was carried out to evaluate the cytotoxicity of apigenin and cisplatin and further to fix the concentration for combination treatments. Briefly, 5 × 10⁴ cells were plated in a 96-well flat surface plate and maintained for 24 h at 37°C in a humidified atmosphere with 5% CO2. After 24 h, the cells were treated with 50 µM of apigenin, 1.28 nM of cisplatin, and a combination of apigenin (50 µM) and cisplatin (1.28 nM) for 24 h. After treatment with the respective compounds for 24 h, the media containing apigenin, cisplatin, and its combination were aspired. The selection of the most effective concentrations of apigenin and cisplatin, known to induce apoptosis, was determined by referring to previous research findings (Mahbub, 2022a, 2022b, 2013). 50 µL of MTT solution was added to the wells and incubated for a further 4 h at 37°C. After 4 h, 150 µL of DMSO was added to dissolve the MTT formazan. Absorbance was read at 450 nm using a multimode reader (Synergy Biotek H4 Hybrid, USA). The % inhibition of cell proliferation was calculated for both apigenin and cisplatin. IC50 was calculated by linear regression analysis (Liu et al., 2017a, Liu et al., 2017b).
EtBr/AO Dual Staining Assay
EtBr/AO is a fluorescent dye that emits green light and is recognized for its minimal toxicity. It is sensitive to variations in chromatin structure within cells, making it useful for studying nuclear changes during apoptosis. In this study, MG-63 cells were pretreated with 50 µM of apigenin, 1.28 nM of cisplatin, and a combination of apigenin and cisplatin for 24 h. Following preincubation, the cells were washed twice with PBS for 3 min each. Subsequently, the treated cells were stained with 0.5 mL of AO/EtBr for 5 min and then washed thrice with PBS. Finally, the cells were observed under a fluorescence microscope. Untreated MG-63 cells were used as the control group for comparison (Zhang et al., 2021).
ROS Measurement by DCF-DA Staining
ROS levels were assessed using the DCF-DA probe. Initially, MG-63 cells were seeded at a density of 1 × 10⁴ cells per well in a 96-well culture plate with a black bottom and allowed to incubate for 24 h. Following this, they were exposed to apigenin, cisplatin, and a combination of apigenin and cisplatin for another 24 h. After exposure, the cells were treated with 20 µM of the DCF-DA dye for 1 h. The fluorescence emitted by DCF was measured using a microplate fluorometer with excitation/emission wavelengths of 485/528. Additionally, intracellular ROS production was assessed simultaneously in a separate experiment under a fluorescence microscope using a 20× objective lens, corresponding to a magnification power of 200× (Zhang et al., 2021).
Cell-Cycle Analysis
MG-63 osteosarcoma cells were initially seeded in 60 mm culture plates at a density of 6 × 10⁵ cells per plate. Following a 24-h incubation period, the cells were treated with apigenin, cisplatin, and a combination of apigenin and cisplatin for an additional 24 h. Subsequently, the cells were harvested, fixed, and permeabilized by incubating them in 70% cold ethanol overnight at −20°C. Afterward, the samples underwent two washes with cold PBS and were then stained with a PI/RNase staining reagent (BD Pharmingen, San Jose, CA) at room temperature for 15 min in preparation for cell-cycle analysis. Flow cytometric analysis was conducted using a BD fluorescence-activated cell sorting (FACS) via flow cytometer (BD, San Jose, CA), and the resulting data were analyzed using ModFit LT 5.0 flow cytometry modeling software (Verity Software House, ME).
Estimation of Lipid Peroxides (LPO)
The method involved heating 0.2 mL of cell lysate supernatant treated with apigenin, cisplatin, and a combination of apigenin and cisplatin, along with 0.8 mL saline, 0.5 mL butylated hydroxytoluene, and 3.5 mL thiobarbituric acid reagent for 90 s in a boiling water bath. After cooling, the solution underwent centrifugation at 2,000 rpm for 10 min to remove the precipitate. The absorbance of the resulting supernatant was measured at 532 nm using a spectrophotometer against a blank containing all reagents except the biological sample (Ohkawa et al., 1979).
Estimation of Glutathione (GSH) and SOD
Briefly, cells were plated in 6-well plates and treated with or without apigenin, cisplatin, and the combination of apigenin and cisplatin for 24 h. After treatment, cells were harvested, washed with cold PBS, and lysed using radioimmunoprecipitation assay (RIPA) buffer. The lysates were then centrifuged at 1,500 rpm for 5 min, and the resulting supernatants were immediately utilized for assessing SOD and GSH levels. Total protein content was determined using Lowry’s method. SOD activity was measured by assessing the inhibition of (NADH-PMS-NBT) complex formation, following the method described by Kakkar et al. (1984). Reduced GSH levels were determined by the development of a yellow color upon the addition of 5,5-dithiobis (2-nitrobenzoic acid) to compounds containing sulfhydryl groups, as described by Moren et al. (1979).
Gene Expression Studies by Quantitative Real-Time Polymerase Chain Reaction (qRT-PCR)
qRT-PCR was utilized to evaluate the expression of proapoptotic and antiapoptotic genes in untreated (negative control) MCF-7 cells and those treated with apigenin, cisplatin, and apigenin + cisplatin combination. RNA extraction was performed using the RNeasy Mini kit from Qiagen, USA, following the manufacturer’s instructions. The extracted RNAs were then converted to complementary deoxyribonucleic acid (cDNA) using a cDNA synthesis kit according to the manufacturer’s protocol (Qiagen). The Corbett Rotor-Gene 6000 instrument from Qiagen was employed for qRT-PCR analysis. Subsequently, a 25 µL reaction mixture was prepared, consisting of 12.5 µL of SYBR Green ROX FAST master mix (Qiagen), 1 µL of primers obtained from Eurofins, 1 µL of cDNA, and 10.5 µL of RNase-free water (Sun et al., 2019).
ELISA Analysis
Cells were plated in 6-well plates and treated with or without apigenin, cisplatin, and a combination of apigenin and cisplatin for 24 h. After treatment, cells were harvested, washed with chilled PBS, and lysed using RIPA buffer. The lysates were then centrifuged at 1,500 rpm for 5 min, and the resulting supernatants were utilized for enzyme-linked immunosorbent assay (ELISA) analysis of p16INK4a and E-cadherin markers following the manufacturer’s instructions (Ray Biotech, GA, USA).
Statistical Analysis
Statistical analyses were performed using one-way analysis of variance (ANOVA). Data are presented as mean ± standard error mean (SEM) of three independent experiments. *p < 0.05, **p < 0.01, and ***p < 0.001 were considered as significant differences.
Results
Cytotoxicity Evaluation
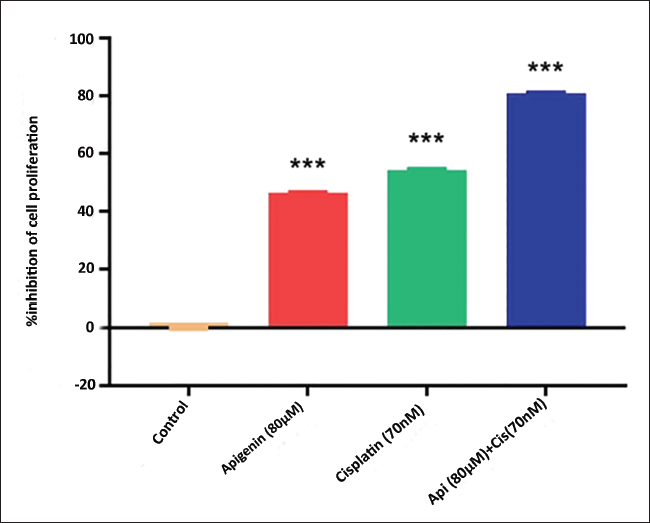
The MTT assay was carried out to evaluate the effect of apigenin and cisplatin at different concentrations of 5, 10, 20, 40, 80, 160, 320, and 640 µM and 5–640 nM, respectively. Results showed dose-dependent inhibition of cell proliferation after 24 h of apigenin and cisplatin treatment. The IC50 was calculated by linear regression analysis and was found to be 80 µM for apigenin and 70 nM for cisplatin, respectively. Hence further functional assays were carried out for apigenin (80 µM), cisplatin (70 nM), and combination treatment (apigenin 80 µM + cisplatin 70 nM). MG-63 cells were treated again with apigenin (80 µM), cisplatin (70 nM), and apigenin (80 µM) + cisplatin (70 nM) for 24 h. After 24 h of incubation, the viability of the cells was found to be reduced in all the three groups when compared to untreated control. Nevertheless, significant inhibition was found in apigenin + cisplatin combination than apigenin or cisplatin alone. The % inhibition of cell proliferation for apigenin (80 µM) and cisplatin (70 nM) was found to be 46.51% and 54.20% respectively whereas the combination exhibited an inhibition rate of 80.92% (Figure 1).
Cytotoxicity Evaluation of Apigenin, Cisplatin, and Apigenin + Cisplatin Combination in MG-63 Cells by 3-(4,5-Dimethylthiazol-2-yl)-2,5-Diphenyltetrazolium Bromide (MTT) Assay. Values are Expressed as Mean ± Standard Error Mean (SEM) (n = 3). Statistical Analysis was Performed using GraphPad Prism 7.0 Software. Significance of *p < 0.05, **p < 0.01, ***p < 0.001 vs. Untreated Control were Determined by One-way Analysis of Variance (ANOVA) followed by Tukey’s post hoc Test.
Morphology Assessment
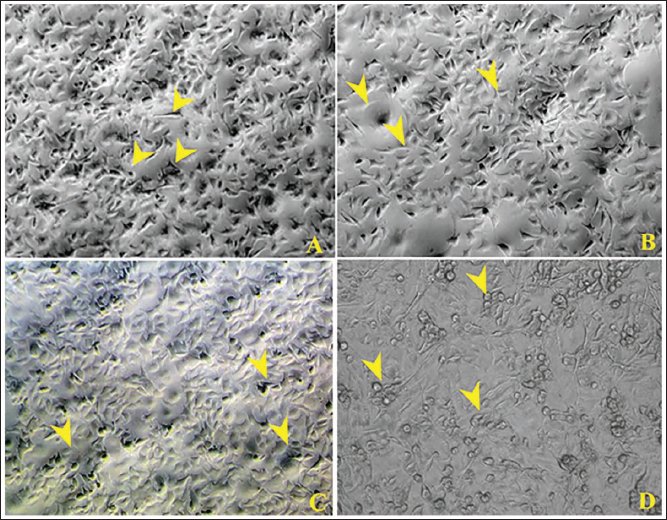
Osteosarcoma cells were exposed to apigenin (50 µM) and cisplatin (1.28 nM), both individually and in combination. Following a 24-h incubation period, the cells were examined for any alterations in morphology. Treatment with the combination of apigenin and cisplatin revealed characteristic signs of apoptosis, with cells appearing rounded and reduced in size, suggesting the potential of this combination to induce apoptosis effectively (Figure 2).
Effect of Apigenin, Cisplatin, and Apigenin + Cisplatin Combination on Morphological Alterations in MG-63 Osteosarcoma Cells (10× Magnifications). Morphological Changes Observed following 24 h of Treatment with Apigenin, Cisplatin, and Apigenin + Cisplatin Combination. (A) Untreated Control, (B) Apigenin (80 µM), (C) Cisplatin (70 nM), and (D) Apigenin (80 µM) + Cisplatin (70 nM).
EtBr/AO Dual Staining Assay
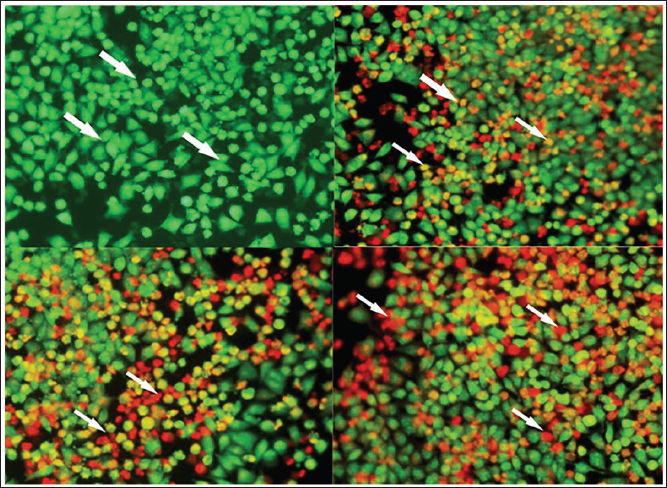
The cytotoxic effects of apigenin (80 µM), cisplatin (70 nM), and their combination were evaluated using the AO/EtBr dual staining assay. Following a 24-h treatment period, cells were stained with AO/EtBr and examined under an inverted fluorescent microscope. In the untreated control group, cells exhibited consistent green fluorescence, indicating their viability. Conversely, cells treated with apigenin, cisplatin, and the combination displayed characteristics associated with apoptotic cell death, presenting a range of colors from yellowish-green to reddish-orange fluorescence. The extent of apoptosis was quantified by counting the number of green, red, and orange cells, with 200 cells evaluated in each field. The control group showed 8.67% apoptotic cells, while cells treated with apigenin + cisplatin demonstrated a significant increase to 77.17% apoptotic cells (as depicted in Figure 3A). The individual treatment with apigenin and cisplatin showed apoptotic cells percentage of 47.17% and 49.50%, respectively (Figure 3).
Dual Staining Assay—Ethidium Bromide and Acridine Orange Staining (10× Magnification). Morphological Changes Observed by Ethidium Bromide/Acridine Orange Dual Staining. (A) Untreated Control, White Arrowheads indicate Green Fluorescent Emitting Viable Cells. (B) Apigenin (80 µM), White Arrowheads indicate Early Apoptotic (Yellow or Yellowish Green). (C) Cisplatin (70 nM), White Arrowheads indicate Early Apoptotic (Yellow or Yellowish Green). (D) Apigenin (80 µM) + Cisplatin (70 nM), White Arrowheads indicate Late Apoptotic (Reddish Orange) Cells.
ROS Production Assays using DCF-DA Staining
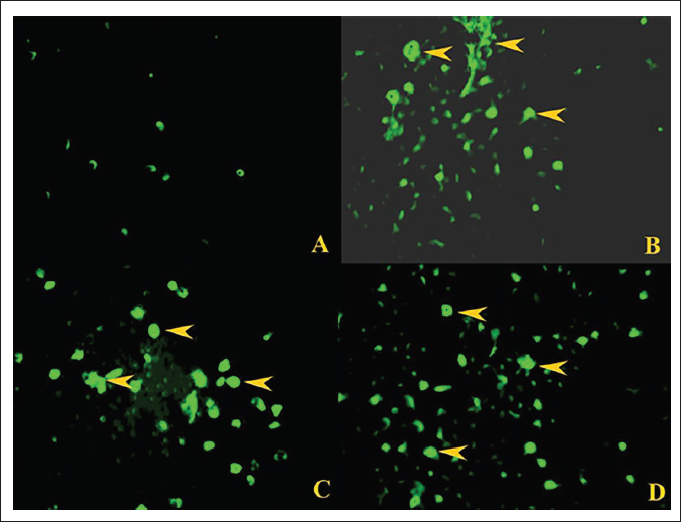
Induction of apoptosis by apigenin + cisplatin has led us to evaluate if oxidative stress is involved in the process. ROS production in the osteosarcoma cells treated with apigenin, cisplatin, and apigenin + cisplatin was measured by DCF-DA staining assay. The untreated control cells showed negligible emission of green fluorescence whereas the cells treated with apigenin, cisplatin, and its combination exhibited green fluorescence emission. The individually treated groups of apigenin and cisplatin showed moderate emission of fluorescence while the combination-treated group exhibited significantly increased fluorescence indicating increased ROS production in MG-63 cells (Figure 4).
Effect of Apigenin, Cisplatin, and Apigenin + Cisplatin Combination on Reactive Oxygen Species (ROS) Inhibition in MG-63 Osteosarcoma Cells by Dichlorofluorescein Staining (10× Magnification). Microscopic Images showing Enhanced Fluorescence Indicated by Red Arrowheads in Apignein, Cisplatin, and Apigenin + Cisplatin Combination-treated Groups Compared to Untreated Control. (A) Untreated Control, (B) Apigenin (80 µM), (C) Cisplatin (70 nM), and (D) Apigenin (80 µM) + Cisplatin (70 nM).
Cell Cycle Arrest—FACS Analysis
Additional investigation into the impact of combining apigenin and cisplatin on cell cycle progression was conducted using flow cytometry analysis. The findings revealed that treatment with either apigenin or cisplatin led to an accumulation of cells in the G0/G1 phase of the cell cycle. In apigenin alone (80 µM) treatment, approximately 10% of cells were accumulated in G0/G1 phase and cisplatin (70 nM) showed 23% cell accumulation in G0/G1 phase. However, when apigenin and cisplatin were used in combination, there was a notable shift in cell cycle distribution, resulting in an accumulation of cells in the G0/G1 phase with overall percentage of 37.3%. This suggests that the combination treatment induces cell cycle progression more rapidly compared to when the drugs are administered individually.
Oxidative Stress Evaluation—Estimation of LPO, GSH, and SOD
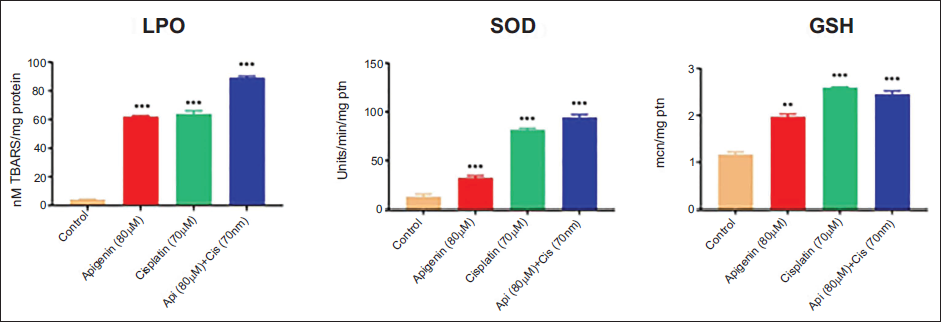
To assess if oxidative stress is involved in the anticancer effect of apigenin + cisplatin, LPO, an indicator of oxidative stress, and the levels of antioxidants such as reduced GSH, SOD was evaluated in MG-63 osteosarcoma cells. Results showed a 2-fold increase in the levels of LPO with concomitant elevation in the levels of GSH (2.4-fold) and SOD (2.2-fold) in apigenin + cisplatin combination-treated group. The individual drug treated groups also showed increased concentration of LPO, GSH, and SOD; however, significant (p < 0.001) elevation was observed in combination treatment group (Figure 5).
Effect of Apigenin, Cisplatin, and Apigenin + Cisplatin Combination on Oxidative Stress Marker, Lipid Peroxides (LPO) and Antioxidants, Superoxide Dismutase (SOD) and Reduced Glutathione (GSH). Values are Expressed as Mean ± Standard Error Mean (SEM) (n = 3). Statistical Analysis was Performed using GraphPad Prism 7.0 Software. Significance of *p < 0.05, **p < 0.01, ***p < 0.001 vs. Untreated Control was Determined by One-Way Analysis of Variance (ANOVA) followed by Tukey’s post hoc Test.
Gene Expression Analysis
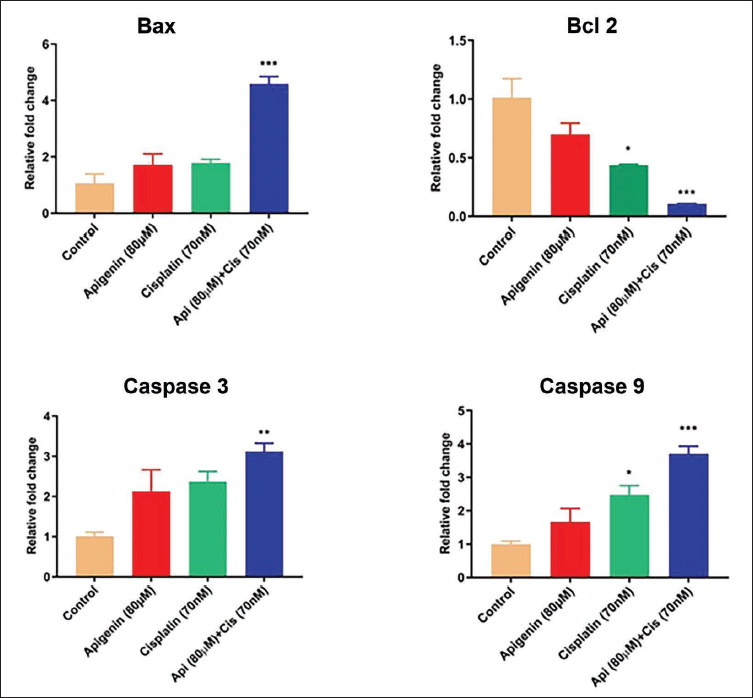
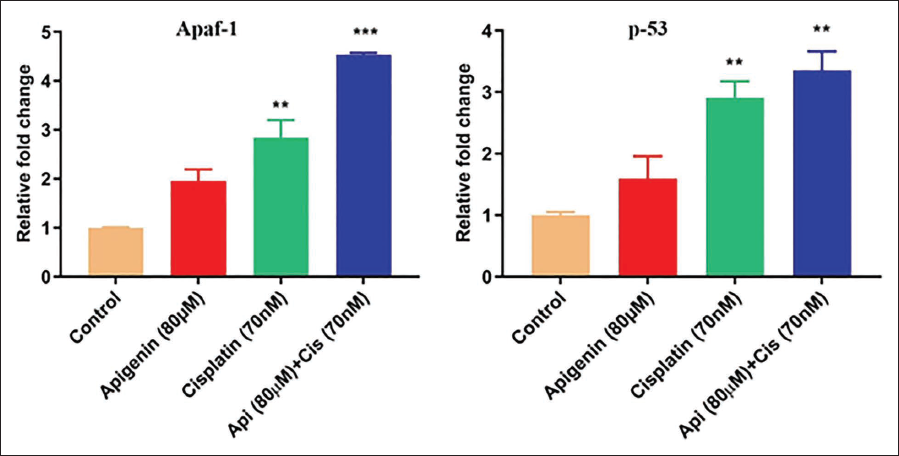
In order to unravel the anticancer mechanism by which apigenin + cisplatin combination works, gene expression analyses of antiapoptotic marker Bcl-2 and proapoptotic markers Bax, Caspase-3, Caspase-9, Apaf-1, and p53 were carried out. The results showed that treatment with apigenin + cisplatin has significantly (p < 0.001) downregulated the messenger ribonucleic acid (mRNA) expression of antiapoptotic Bcl-2 when compared to apigenin and cisplatin individual treatment groups. Similarly, the combination treatment of apigenin + cisplatin showed marked upregulation in mRNA expression of Bax (p < 0.001), Caspase-3 (p < 0.01), Caspase-9 (p < 0.001), Apaf-1 (p < 0.001), and p53 (p < 0.01) in comparison to that of apigenin and cisplatin individually treated groups as well as untreated control. The individual treatment groups demonstrated a moderate change in the gene expression profile of proapoptotic and antiapoptotic markers (Figures 6 and 7).
Effect of Apigenin, Cisplatin, and Apigenin + Cisplatin Combination on Apoptotic and Caspase Markers—Gene Expression Analysis by Real-Time Polymerase Chain Reaction (PCR). Values are Expressed as Mean ± Standard Error Mean (SEM) (n = 3). Statistical Analysis was Performed using GraphPad Prism 7.0 Software. Significance of *p < 0.05, **p < 0.01, ***p < 0.001 vs. Untreated Control was Determined by One-Way Analysis of Variance (ANOVA) followed by Tukey’s post hoc Test.
Effect of Apigenin, Cisplatin, and Apigenin + Cisplatin Combination on Mitochondrial Intrinsic Pathway Markers—Gene Expression Analysis by Real-Time PCR. Values are Expressed as Mean ± Standard Error Mean (SEM) (n = 3). Statistical Analysis was Performed using GraphPad Prism 7.0 Software. Significance of *p < 0.05, **p < 0.01, ***p < 0.001 vs. Untreated Control was Determined by One-Way Analysis of Variance (ANOVA) followed by Tukey’s post hoc Test.
Gene Expression of BMIL1
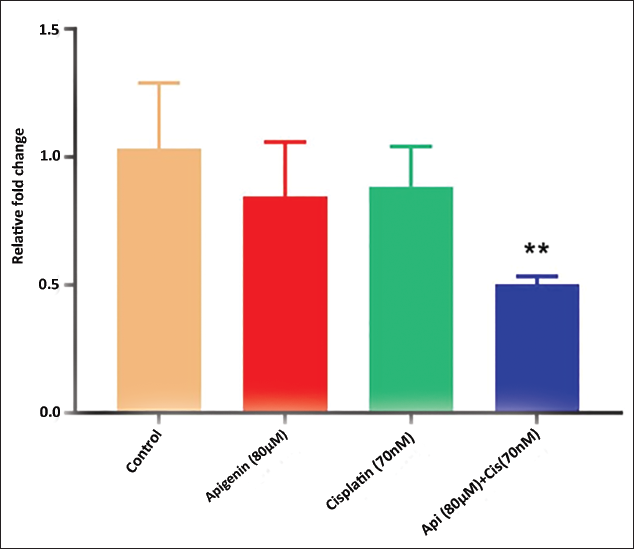
B-cell-specific Moloney murine leukemia virus integration site 1 (BMIL1) plays a crucial role as an oncogene, controlling the progression and spread of cancerous tumors. Since BMIL1 has been considered to be a therapeutic target marker in various cancer types, the mRNA expression of BMIL1 was assessed. The mRNA expression of BMIL1 was found to be upregulated in untreated control, whereas the combination treatment group of apigenin+cisplatin demonstrated marked (p < 0.01) downregulation of BMIL1. The individual treatment groups of apigenin and cisplatin exhibited moderate downregulation of BMIL1 (Figure 8).
Effect of Apigenin, Cisplatin, and Apigenin + Cisplatin Combination on B-cell-Specific Moloney Murine Leukemia Virus Integration Site 1 (BMIL1) Gene Expression. Values are Expressed as Mean ± Standard Error Mean (SEM) (n = 3). Statistical Analysis was Performed using GraphPad Prism 7.0 Software. Significance of *p < 0.05, **p < 0.01, ***p < 0.001 vs. Untreated Control was Determined by One-Way Analysis of Variance (ANOVA) followed by Tukey’s post hoc Test.
ELISA Analysis
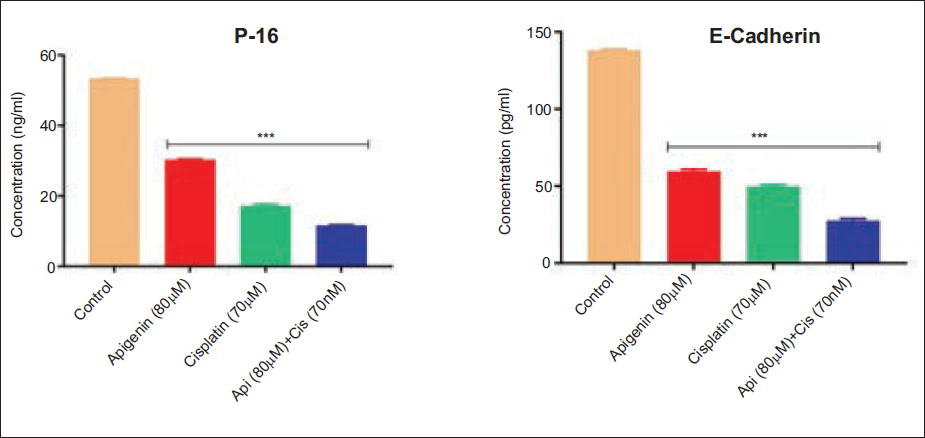
Further analysis of BMIL1 downstream proteins p16 and E-cadherin was carried out by ELISA analysis. ELISA results showed increased levels of p16 and E-cadherin in untreated control group while the individual apigenin and cisplatin treatment groups revealed considerable (p < 0.001) decrease in the p16 and E-cadherin levels. The combination of apigenin + cisplatin showed a significant (p < 0.001) decrease in the levels of p16 and E-cadherin when compared to an untreated control group (Figure 9).
Effect of Apigenin, Cisplatin, and Apigenin + Cisplatin Combination on p-16 and E-Cadherin Levels by ELISA Analysis. Values are Expressed as Mean ± Standard Error Mean (SEM) (n = 3). Statistical Analysis was Performed using GraphPad Prism 7.0 Software. Significance of *p < 0.05, **p < 0.01, ***p < 0.001 vs. Untreated Control was Determined by One-Way Analysis of Variance (ANOVA) followed by Tukey’s post hoc Test.
Discussion
Previous studies have indicated that apigenin, when combined with chemotherapy agents, exhibits significant anticancer activity across various cancer types. This is achieved through mechanisms such as reducing adenosine triphosphate (ATP) and GSH levels, causing DNA damage, and promoting apoptosis via caspase activity (Chan et al., 2012; Hanahan & Weinberg, 2011; Liu et al. 2017a, 2017b; Mahbub et al., 2022b; Xu et al., 2011). The current study has shown that the combined treatment of apigenin and cisplatin notably suppressed the proliferation of MG-63 cells more effectively than radiation or cisplatin alone. Furthermore, all three treatment groups induced cell-cycle arrest in the subG0-G1 phase, inhibiting the migratory potential of osteosarcoma cells. The combined treatment group demonstrated a stronger induction of apoptosis compared to groups treated with apigenin or cisplatin alone. Moreover, the production of ROS was increased in the combination group along with elevated oxidative stress and antioxidants compared to the individual treatments of apigenin or cisplatin. These findings suggest that combining apigenin and cisplatin treatment may offer a more potent therapeutic approach for MG-63 osteosarcoma than using apigenin or cisplatin alone.
Cancer arises from uncontrolled cell growth. The series of events from the completion of one cell division to the beginning of the next is termed the cell cycle, consisting of interphase and mitosis. Interphase encompasses G1, S, and G2 stages, with transitions between G1/S and G2/M phases being crucial (Schwartz & Shah, 2005). The periods between DNA synthesis (S phase) and mitosis (M phase) are known as G1 and G2 phases, respectively, with varying durations (Zhao et al., 2017). Results from this study indicate that the combination of apigenin and cisplatin has led to cell cycle arrest, specifically at the G2/M phase. This finding aligns with research demonstrating G2/M phase arrest induced by apigenin and cisplatin (Lee et al., 2014; Mueller et al., 2006; Zhu et al., 2013). The regulation of the G2/M checkpoint involves complexes such as Cdc2/cyclin B and their inhibitors like p21Cip1 and p27 (Hengartner, 2006). Hence, it is plausible to suggest that the apigenin + cisplatin combination might inhibit cyclin B activity and consequently Cdc2 function.
In cancer treatment, apoptosis is a favorable outcome marked by DNA fragmentation within the nucleus, the formation of membrane blebs, and reduction in cell size. Further, apoptosis has been considered an imperative cellular event in chemotherapeutics (Galluzzi et al., 2018). Consistent with this notion, the observed morphological and staining patterns indicate typical apoptotic cell death features such as nuclear fragmentation and chromatin condensation following treatment with a combination of apigenin and cisplatin. Apoptosis can be initiated through two main pathways: the intrinsic (mitochondrial-mediated) pathway and the extrinsic (death receptor-mediated) pathway. Activation of either pathway triggers a cascade involving caspase activation, ultimately leading to cell death (Jan & Chaudhry, 2019; Nakamura & Takada, 2021). A previous study reported that combinations of apigenin with etoposide or cyclophosphamide did not affect the expression of the antiapoptotic gene Bcl-2 (Mahbub et al., 2022b). However, our current findings demonstrate that the combination of apigenin and cisplatin significantly downregulates Bcl-2 expression. Earlier research has shown that apigenin induces apoptosis either independently through the extrinsic pathway or synergistically with chemotherapeutic agents through the intrinsic pathway (Mahbub et al., 2013, 2022b). Consistent with these findings, our study reveals increased apoptosis with the apigenin–cisplatin combination, which notably upregulates proapoptotic markers associated with the intrinsic pathway such as Bax, Caspase-3, Caspase-9, Apaf-1, and the tumor suppressor gene p53.
ROS, the highly reactive molecules that have been widely studied in various cancer types possess a dual role in cellular metabolism. At low to moderate concentrations, ROS serve as signaling molecules, promoting cellular processes, including proliferation, invasion, and redox balance. However, elevated ROS levels have detrimental effects on cancer cells, causing damage to macromolecules, membranes, organelles and ultimately leading to apoptosis (Arihara et al., 2017). The observed increase in LPO levels alongside a rise in antioxidants such as GSH and SOD suggests that the combination of apigenin and cisplatin may have activated the antioxidant pathway, enhancing ROS clearance. This result is in agreement with prior studies that have demonstrated the suppression of cancer cell growth and induction of apoptosis through heightened intracellular ROS levels in multiple myeloma and colorectal cancer cells (Nakamura et al., 2019).
Epithelial to mesenchymal transition (EMT) is a critical process implicated in the metastasis of cancer and serves as a potential indicator of cancer progression or a target for cancer treatment (Meng et al., 2012). BMIL1 is a significant oncogene involved in cancer invasion and metastasis, regulating proteins such as p16 and E-cadherin, which play crucial roles in epithelial–mesenchymal transition and tumor invasion (Yang et al., 2010). A study conducted by Jiang and Huang (2020) demonstrated a notable decrease in BMIL1 and its downstream proteins p16 and E-Cadherin in MG-63 osteosarcoma cells when treated with a combination of Curcumin derivative, C086, and cisplatin. Consistent with these findings, our study reveals that the combination of apigenin and cisplatin significantly reduces the levels of BMIL1, p16, and E-cadherin, indicating the effectiveness of the combination in inhibiting cancer cell invasion and migration.
The limitations of this in vitro study include the lack of in vivo validation, which means the observed effects of apigenin and cisplatin on MG-63 osteosarcoma cells may not directly translate to clinical outcomes. Additionally, the study focuses on a single cell line, limiting the generalizability of the results across different osteosarcoma subtypes. The study also does not account for the tumor microenvironment’s complexity, which plays a significant role in drug response. Furthermore, long-term effects and potential toxicity of the combination therapy were not assessed, which are crucial for developing safe and effective treatments.
The study highlights the potent combination of apigenin and cisplatin in treating MG-63 osteosarcoma cells by inducing apoptosis through the mitochondrial pathway and effectively downregulating oncogenes like BMIL1. Future research should focus on validating these findings in animal models to assess the combination’s therapeutic potential and safety in vivo. Additionally, exploring the combination’s efficacy across various osteosarcoma cell lines and identifying the specific molecular targets of apigenin could lead to the development of targeted therapies that minimize resistance and enhance treatment outcomes. Investigating potential biomarkers for treatment response could also optimize patient selection, paving the way for personalized treatment strategies in osteosarcoma.
Conclusion
The findings of our study revealed significant effectiveness in combating osteosarcoma cancer cells through the combined administration of apigenin and cisplatin. This combination induced apoptosis via the intrinsic mitochondrial pathway. Additionally, the combination treatment led to a substantial decrease in BMIL1 gene expression, accompanied by the downregulation of signaling pathways linked to p16 and E-cadherin. These effects collectively triggered apoptosis in osteosarcoma cells while also inhibiting tumor cell proliferation.
Abbreviations
ANOVA: Analysis of variance; AO: Acridine orange; Apaf-1: Apoptotic protease activating factor-1; Bax: Bcl-2-associated X protein; Bcl-2: B-cell lymphoma 2; BMIL1: B-cell-specific Moloney murine leukemia virus integration site 1; cDNA: Complementary deoxyribonucleic acid; CoA: Coenzyme A; DCF-DA: 2′,7′-Dichlorofluorescin diacetate; DMSO: Dimethyl sulfoxide; EDTA: Ethylenediaminetetraacetic acid; ELISA: Enzyme-linked immunosorbent assay; EtBr: Ethidium bromide; FACS: Fluorescence-activated cell sorting; FBS: Fetal bovine serum; GSH: Glutathione; LPO: Lipid peroxidation; MCF-7: Michigan cancer foundation-7 (human breast cancer cell line); MG-63: Human osteosarcoma cell line; MTT: 3-(4,5-Dimethylthiazol-2-yl)-2,5-diphenyltetrazolium bromide; NADH-PMS-NBT: Nicotinamide adenine dinucleotide–phenazine methosulfate–nitro blue tetrazolium; p16INK4a: Cyclin-dependent kinase inhibitor 2A; p53: Tumor protein P53; PBS: Phosphate buffered saline; qRT-PCR: Quantitative real-time polymerase chain reaction; RIPA: Radioimmunoprecipitation assay; ROS: Reactive oxygen species; SDS: Sodium dodecyl sulfate; SEM: Scanning electron microscopy; SOD: Superoxide dismutase; SYBR: SYBR green.
Author Contributions
Jagadish Hosmani and Abdullah Alqarni designed experiments. Jagadish Hosmani, Khalil Assiri, Saeed Alassiri, and Ali Mosfer Alqahtani carried out experiments and analyzed experimental results. Jagadish Hosmani wrote the manuscript. Abdullah Alqarni revised the manuscript. All authors approved the final manuscript. All authors contributed to editorial changes in the manuscript. All authors have participated sufficiently in the work and agreed to be accountable for all aspects of the work.
Availability of Data and Materials
The data that support the findings of this study are available from the corresponding author upon reasonable request.
Footnotes
Declaration of Conflicting Interests
The authors declared no potential conflicts of interest with respect to the research, authorship, and/or publication of this article.
Ethical Approval and Informed Consent
NA.
Funding
The authors disclosed receipt of the following financial support for the research, authorship, and/or publication of this article: The authors are thankful to the Deanship of Scientific Research, King Khalid University, Abha, Saudi Arabia, for financially supporting this work through the Large Research Group Project under Grant No. R.G.P.2/598/45.