
Abstract
Background and Purpose
Chronic diseases, such as cardiovascular disease as well as type 2 diabetes, are associated with hyperlipidemia, characterized by high blood lipid levels. HepG2 cells, a human liver cancer cell line, have become a popular model for evaluating the effectiveness of drugs in treating hyperlipidemia. These cells are preferred due to their ability to mimic liver cell physiology and easy maintenance in culture.
Materials and Methods
In this study, HEP, HEC, HEA, and HEE extracts of Rivea hypocrateriformis were tested on HepG2 cells for cytotoxicity using the MTT assay. The IC50 values of the extracts were determined and compared to analyze their toxicity. Microscopic images of the cell lines were also examined to observe any structural changes induced by the extracts.
Results and Conclusion
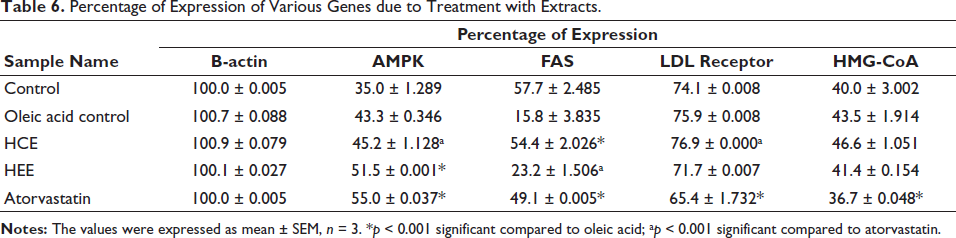
The results showed that both HEC and HEE extracts exhibited significant toxicity on HepG2 cells at the highest concentration of 500 µg/ml. Gradual decreases in concentration led to a gradual rise in % cell viability. The IC50 values of HEC and HEE were calculated to be 61.49 µg/ml and 87.08 µg/ml, respectively, indicating that HEC was slightly more toxic than HEE. According to the results obtained using the vanilla method, HEC and HEE extracts markedly reduced lipid content compared to the oleic acid-induced group. The gene expression regulation of AMPK, FAS, LDL receptor, and HMG-CoA was investigated using the RT-PCR method. The results showed that the extract-treated groups exhibited higher AMPK and LDL receptor gene expression. In contrast, the HEE extract showed higher activity than HEC in suppressing the FAS gene. Overall, the findings suggest that HEC and HEE extracts have potential as anticancer and lipid-lowering agents. Detailed research is needed to understand how the active constituents work.
Introduction
Elevated blood lipids increase the risk of cardiovascular disease and type 2 diabetes. Pharmacological intervention through the use of antihyperlipidemic drugs has been established as an effective strategy for the prevention and management of hyperlipidemia. Rivea hypocrateriformis, also known as ginseng vine or elephant creeper, is a flowering plant species that belongs to the family Convolvulaceae. This plant species is native to various regions worldwide, including India, Australia, and parts of Southeast Asia, and has been used traditionally for medicinal purposes by different cultures to treat respiratory and gastrointestinal disorders (Mukim et al., 2022).
They reported that the plant has been used since ancient times to treat fever, urogenital problems, rheumatic pain, snake bites, cough, malaria, piles, and skin diseases. Numerous valuable secondary metabolites have been identified in the plant, such as flavonoids, alkaloids, glycosides, coumarins, stilbenes, xanthones, and various other constituents. Numerous benefits have been reported for extracts and compounds from the plant, including antifertility, antiarthritic, antimicrobial, anovulatory, anticancer, antioxidant, antilithiatic, hepatoprotective, and antimitotic effects (Mukim et al., 2022). Research on R. hypocrateriformis has demonstrated its pharmacological potential for various applications.
Researchers have discovered that plant extracts have significant antioxidant, antimicrobial, and anti-inflammatory properties (Borkar et al., 2015). Various bioactive compounds in the plant, such as flavonoids and alkaloids, were known to possess immunomodulatory and anticancer properties (Godipurge et al., 2018). Extracts of R. hypocrateriformis also exhibit in vitro antiurolithiasis/anticalcification activity equivalent to cystone (Patel et al., 2010). A promising medicinal herb for treating hyperlipidemia, R. hypocrateriformis, possesses many health-promoting properties.
Researchers have evaluated the ability of drugs to lower lipid levels in hepatocytes, the primary site of lipid metabolism in the body, using in vitro cell culture models. Since HepG2 cells resemble the physiological characteristics of liver cells and are relatively easy to maintain in culture, they have become a popular choice among these models. HepG2 cells have been used in several studies to test drug antihyperlipidemic activity. An alkaloid derived from plants, berberine, was examined for its ability to lower cholesterol in a study by Lee et al. (2006).
According to the study, berberine inhibited lipid accumulation in HepG2 cells by inhibiting the expression of lipid metabolism genes. In another study, Li et al. (2022) analyzed how celastrol (derived from Tripterygium wilfordii roots) could reduce hyperlipidemia in HepG2 cells. Celastrol inhibited the expression of genes involved in lipid synthesis in HepG2 cells, thereby reducing lipid accumulation.
The effects of green tea catechins on lipid levels were evaluated by Way et al. (2009) using HepG2 cells. Researchers reported that catechins from green tea significantly reduced lipid accumulation in HepG2 cells by activating AMP-activated protein kinase (AMPK), an essential lipid metabolism regulator. As a result of evaluating the drug’s antihyperlipidemic activity using HepG2 cells, valuable insights have been gained into the molecular mechanisms underlying lipid metabolism, and novel therapeutic approaches have been developed to prevent and manage hyperlipidemia. HepG2 cells were tested for their antihyperlipidemic activity with R. hypocrateriformis extracts.
Materials and Methods
In vitro Antihyperlipidemic Activity
Material Required
Procurement details: DMEM medium, fetal bovine serum (FBS), and antibiotic solutions were obtained from Gibco (USA). DMSO and MTT were sourced from Sigma (USA). PBS (1X) was obtained from HiMedia (India). Tarson (India) provided the 96-well tissue culture plate and wash beaker. Reagents such as chloroform, methanol, cholesterol, H2SO4, and sulfophosphoric-vanillin acid agent were also procured from Tarson. Oil red O stain was sourced from Sigma (USA). The forward and reverse primers were purchased from Eurofins Pvt. Ltd. (India). The first strand cDNA synthesis kit was obtained from Roche (Switzerland). Sodium acetate and Taq Mix (2X) were purchased from SRL (India).
Cell Cultures
HepG2 cells (human liver tumor cells) were procured from the National Centre for Cell Science (NCCS), Pune. The cells were cultured in DMEM liquid medium supplemented with 10% FBS, 100 µg/ml penicillin, and 100 µg/ml streptomycin. They were maintained at 37°C under a 5% carbon dioxide atmosphere.
Extract Preparation
Leaf samples of R. hypocrateriformis were collected and dried over approximately seven days in the shade. A Soxhlet apparatus was employed to extract a colorless solution from the powdered dried leaves, followed by ether, chloroform, ethyl acetate, and ethanol extraction. A thick paste was formed after filtering and evaporating the resulting solutions under vacuum suction. In these pastes, pet ether extracts (HPE), chloroform extracts (HCE), ethanol extracts (HEE), and ethyl acetate extracts (HAE) were used. In addition to the yields (10.14%, 15.34%, 8.05%, and 23.46% w/w), percentage yields were also recorded. Once the extracts were prepared, they were stored at room temperature in airtight containers.
Cytotoxicity of Extracts of R. hypocrateriformis by MTT Assay
MTT assay was used to determine the in vitro cytotoxicity of Hypocrateriformis extracts, pet. ether extracts (HPE), chloroform extracts (HCE), ethyl acetate extracts (HAE), and ethanol extracts (HEE) (Mosmann, 1983). After trypsinization, a 15 ml tube was used to collect the harvested HepG2 cells. To provide a suitable medium for growth, the cells were plated into 96-well tissue culture plates containing 10% FBS and 1% antibiotic solution and incubated for 24–48 hours at 37°C in a DMEM medium containing 10% FBS. A serum-free DMEM medium was used to treat the wells after washing them with sterile PBS. Incubation of the cells at 37°C in a humidified 5% CO2 incubator for 24 hours was performed three times for each sample. The cells were then incubated for another 2–4 hours with MTT (20 µl at 5 mg/ml), and inverted microscope images were obtained to show the purple precipitated products. In the final step, the medium and MTT (220 µl) were aspirated from the wells and washed with 1X PBS (200 µl), as described by Marshall et al. (1995). To dissolve formazan crystals, DMSO (100 l) was added and shaken for a further 5 minutes. Microplate readers (Thermo Fisher Scientific, USA) were used for measuring absorbance at 570 nm, and the rate of cell viability and the IC50 value were calculated as follows:

Estimation of Lipid Droplet Accumulation by Staining Red O Oil
Preparation of Staining Oil Red O Solution (Working and Stock)
A powdered oil red O was obtained from Sigma-Aldrich (O0625). 0.2 g of the compound was dissolved in 40 ml of 2-propanol (0.5% w/v) to prepare a stock solution. Room temperature was used to store this stock solution. A solution containing 0.2% oil red O in 40% 2-propanol was prepared by diluting the stock solution 2:3 with distilled water. Each experiment was conducted using the freshly prepared working solution, filtered once before use.
Trypsinization was used to harvest cultured HepG2 cells and pool them into a 15 ml tube. DMEM medium containing 10% FBS and 1% antibiotic solution was added to the 24-well tissue culture plate, resulting in a density of 1 × 10⁵ cells/ml cells/well (200 µl). Cells were incubated for 24–48 hours at 37°C in DMEM medium containing 10% FBS and 1% antibiotic solution. Pretreatment with 0.5 mM oleic acid for 48 hours was followed by treatment with various concentrations of HCE and HEE, such as 5,000–10 µg/ml and 10 µM of atorvastatin in serum-free DMEM medium. Incubation was conducted at 37°C in a humidified 5% CO2 incubator for 24 hours with three replications for each sample. Oil red O staining was performed on the cells after incubation (Markusson et al., 2016).
After removing the supernatant from the culture plates, the cells were washed once with phosphate-buffered saline (PBS, pH 7.4). Subsequently, the cells were fixed with a 4% formalin solution in PBS (0.05M) for 20 minutes. After fixation, the cells were washed with sterile double-distilled water and 60% isopropanol for 2 minutes. A 0.35% oil red O solution in 60% isopropanol was filtered and used to stain the cells for 10 minutes at room temperature. Following the staining, the cells were washed with sterile double-distilled water. Slides were treated with Dako paramount aqueous mounting medium and covered with a coverslip. Images were captured using an Olympus light microscope.
Oil red O was extracted from the cells using isopropanol containing 4% Nonidet P-40 to quantify the staining. The optical density of the extracted solution was measured at 520 nm.
Estimation of Lipids by Vanillin Method
Calibration Curve of Cholesterol
The solvent was prepared using 2:1 chloroform and methanol. Cholesterol was mixed in the solvent at specific concentrations to get 10, 5, 2.5, 1.25, 0.625, 0.312, 0.156, and 0.078 mg/ml standard solutions. The absorbance was measured at 540 nm and plotted against concentration to get a calibration curve of cholesterol.
Methodology
In DMEM medium with 10% FBS and 1% antibiotic solution, HepG2 cells were harvested, pooled, and plated in 24-well tissue culture plates. Incubation was completed for 24–48 hours, followed by washing with PBS and pretreatment with 0.5 mM oleic acid for 48 hours. A serum-free DMEM medium containing HEC (61.49 µg/ml), HEE (87.08 µg/ml), and atorvastatin were added to the cells. An incubator filled with CO2 incubated the cells for 24 hours at 37°C. Incubation was completed by centrifuging the cells afterward. Vanillin was used to analyze the total lipid content of the resulting pellet after it had been lysed with 0.05% triton X 100. During incubation at 90°C for 10 minutes, each tube was filled with concentrated sulfuric acid (100 µl). 540 nm was used to measure background absorbance after cooling. After 5 minutes of color development, the absorbance at 540 nm was measured after adding a sulfophosphoric-vanillin acid agent (0.2 mg vanillin per ml 17% phosphoric acid).
Gene Expression Analysis by RT-PCR
RNA Isolation
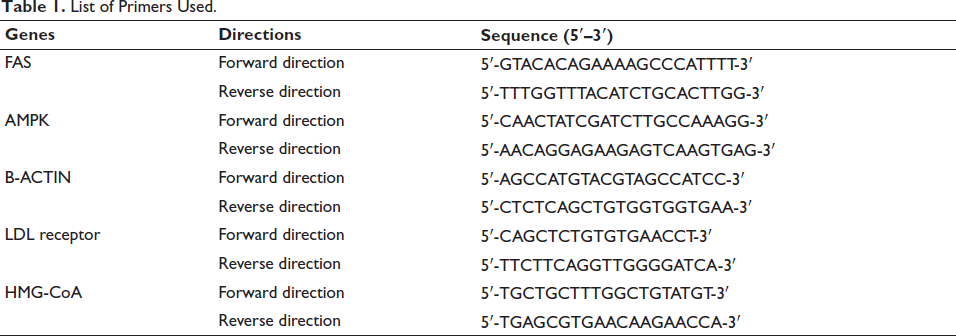
Isolation of total RNA was conducted using the TRIZOL method in accordance with the manufacturer’s instructions. Samples were centrifuged for 10 minutes at 5,000 rpm in DEPC-treated centrifuge tubes to obtain cell pellets. To the cell pellet (1 × 10⁷ cells), 700 µl of TRIZOL was added for cell lysis. A vigorous pipette was then used to transfer the lysate to 1.5 ml tubes. In the next step, 300 l of chloroform were added and vigorously mixed for 5 minutes at room temperature. An aqueous layer was collected in a fresh 1.5 ml tube after centrifugation for 20 minutes at 12,000 rpm at 4°C. A 700-µl mixture of isopropanol and 12,000 rpm centrifugation at 4°C for 20 minutes precipitated RNA. A 70% ethanol wash, air-drying, and autoclaving of 30 µl of double-distilled water were used to dissolve the resulting RNA pellet. After storing at –80°C, the RNA was used. A Labman UV–Vis spectrometer was used to determine the quality and quantity of the isolated RNA. The list of primers used in this study were described in Table 1.
List Primers Used.
DNAase Treatment
In the experiment, RNA preparations were subjected to DNase treatment to remove DNA contamination. A reaction volume of 20 µl was used, and 1 U of DNase enzyme was added. The mixture was then incubated for 30–45 minutes and subsequently cooled to room temperature. To stop the DNase activity, 2 µl of 20 mM EGTA were added, and the reaction was incubated at 66°C for 10 minutes. After the incubation, RNA precipitation was performed by adding sodium acetate (1/10 of the volume) and absolute ethanol (2 times the volume) to the reaction mixture. The mixture was then incubated at –20°C for 60 minutes. Following this, centrifugation was carried out at 4°C and 12,000 rpm for 20 minutes to separate the RNA pellet from the supernatant. The pellet was then washed with 500 µl of 75% ethanol, and the supernatant was discarded. To prepare the RNA pellet for further processing, it was resuspended in 20 µl of double autoclaved Milli-Q grade water. This resuspended RNA can be used for subsequent steps in the experimental procedure.
cDNA synthesis
A reaction mixture containing reverse transcriptase (MMLV) was used to convert 1.5 µg of total RNA into cDNA. cDNA was synthesized at 25°C for 10 minutes, followed by 42°C for 59 minutes. We denatured cDNA and RNA hybrids at 99°C for 5 seconds, then inactivated reverse transcriptase at 4°C for 10 seconds.
Gene-level Expression Detection
A template cDNA was synthesized for RT-PCR amplification of target genes. The PCR reaction was conducted using Taq Mix (2X) from BioLit. An endogenous control (beta-actin) was used to calibrate RT-PCR results for the target genes.
PCR Condition
Amplification of FAS involved melting at 94°C for 3 minutes, annealing at 56°C for 30 seconds, extending at 72°C for 1 minute, and denaturing at 94°C for 30 seconds. The final extension step involved holding 72°C for 10 minutes, followed by 4°C. AMPK gene was melted for 3 minutes, denatured at 94°C for 30 seconds, annealed at 58°C for 30 seconds, and extended at 72°C for 1 minute in this protocol. The temperature was then raised to 72°C for 10 minutes, then lowered to 4°C for a second time. As part of the amplification process for B_ACTIN, the gene was initially melted at 94°C for 3 minutes before being annealed for 30 seconds at 56°C and extended for 1 minute at 72°C. Ultimately, 72°C was applied for 10 minutes, followed by a 4°C hold. HMG-CoA and LDL receptor genes were amplified at melting temperatures of 94°C for 3 minutes, followed by 30 cycles of 94°C for 30 seconds of denaturation, 54°C for 30 seconds of annealing, and 72°C for 1 minute of extension. A final maintenance temperature of 72°C was maintained for 10 minutes, followed by a maintenance temperature of 4°C (Rocha et al., 2015).
Agarose Gel Electrophoresis
To prepare the agarose gel, 30 ml of 1X TAE buffer was soaked in 0.3 g of agarose powder and heated until completely dissolved. The solution was clear as a result. A temperature of approximately 50°C was then reached when the solution was cooled. Ethidium bromide was then added in 1.5 µl concentrations and thoroughly mixed. An adjusted gel comb was used to pour the gel mixture into a gel casting plate and allow it to set for approximately 30 minutes at room temperature. A 1X TAE buffer was added to the electrophoresis tank in which the gel, now solidified, was placed. The gel was loaded with 3 l of PCR product and 3 l of gel-loading dye using micropipettes. The electrophoresis took about 15–20 minutes at 70v. UV gel documentation showed orange-colored DNA bands. A further analysis was conducted using ImageJ software (USA) (Gomes et al., 2018).
Statistics
We used GraphPad Prism version 5.0 to analyze our data statistically. We performed Dunnett’s multiple comparison test followed by a one-way analysis of variance. This measure is represented as means ± standard errors of the means (means ± SEM). A p value of 0.001 was considered statistically significant.
Results
Cytotoxicity of Extracts of R. hypocrateriformis in MTT Assay
In vitro cytotoxicity experiments using the MTT assay at different extract concentrations are shown in Table 2. The in vitro cytotoxicity assay results provide valuable insights into the concentration-dependent effects of four extracts (HEC, HEE, HEA, and HEP) on Hep-G2 cell lines. A detailed discussion of these findings, along with the derived IC50 values, reveals essential information about each extract’s potential applications and potency. First, the concentration-dependent nature of the cell viability percentages is evident for all extracts. Cell viability decreases at higher concentrations (500–100 µg/ml), suggesting increased cytotoxicity. Cell viability rises as the concentration decreases (80–10 µg/ml), indicating reduced cytotoxicity. This pattern demonstrates that the tested extracts exhibit varying degrees of cytotoxicity, dependent on their concentrations.
In Vitro Cytotoxicity Assay of Extracts of Rivea Using MTT Assay.
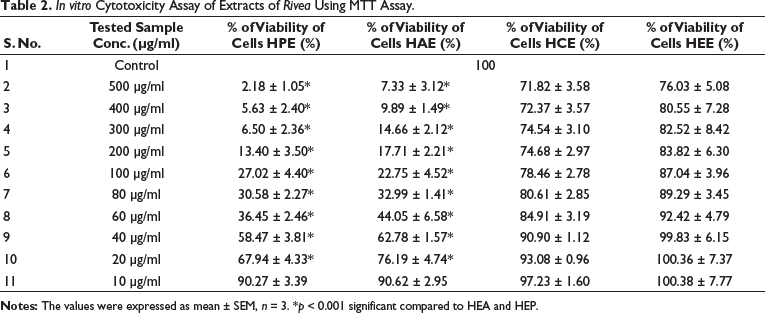
It represents the concentration at which 50% of cells are inhibited by each extract, and serves as a quantitative indicator of the extract’s potency. It is clear from HPE and HAE IC50 values that they are more toxic and require lower concentrations to inhibit 50% of cells (50.64 µg/ml and 53.14 µg/ml, respectively). These findings suggest that HPE and HAE are potential anticancer agents on cell lines and merit further investigation. However, they may still possess therapeutic value in other areas, and additional research is needed to elucidate their potential uses. Conversely, HCE and HEE exhibited higher IC50 values (61.49 µg/ml and 87.08 µg/ml, respectively), indicating higher viability and suggesting that these extracts may have less toxicity than HPE and HAE. The toxicity of the two cell lines differs somewhat at higher doses, but not significantly.
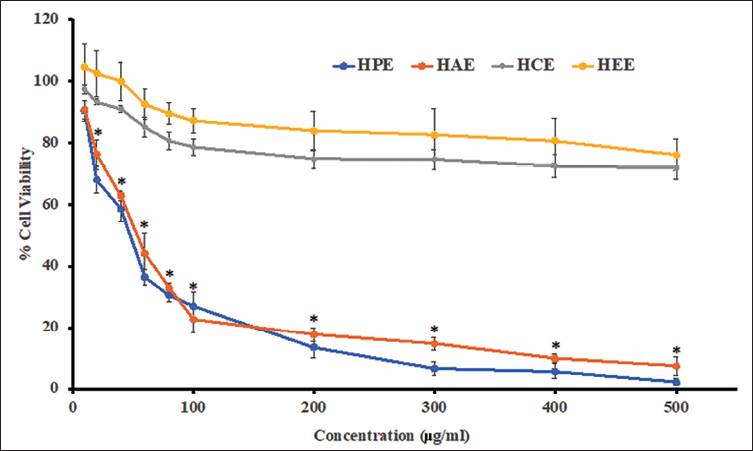
The illustration in Figure 1 compares the plots of the % cell viability at various concentrations of HPE, HCE, HAE, and HEE. Even though there is not much difference in the extracts at higher concentrations, HEE showed slightly more viability at any lower dose below 100 µg/ml. Research on hepatic lipid metabolism is extensively conducted using the HepG2 cell line. The microscopical images of the cell lines showed marked and significant changes in the structure of cells. As there is not much difference in the cytotoxicity demonstrated by the extracts, explanations can be made by comparing various doses. In the control group of cell lines, the cells were flat and extended on the surface of the medium. The cell lines grew well and formed into clusters and aggregates. Microscopic images of cell lines showed the HCE 500 mg/ml cell structure, which showed a marked change where the cell aggregates were broken and cells appeared individual. The cells had no proper growth, and their membranes loosed, deformed, and elongated. The cells are devoid of microvilli, and there was no heterogenicity in the differentiation of the cell lines into hepatocellular carcinoma. However, lower doses of the drugs restored the normal cellular structure of the HepG2 cells.
In vitro Cytotoxicity of Extracts on the HepG2 Cell Lines in MTT Assay.
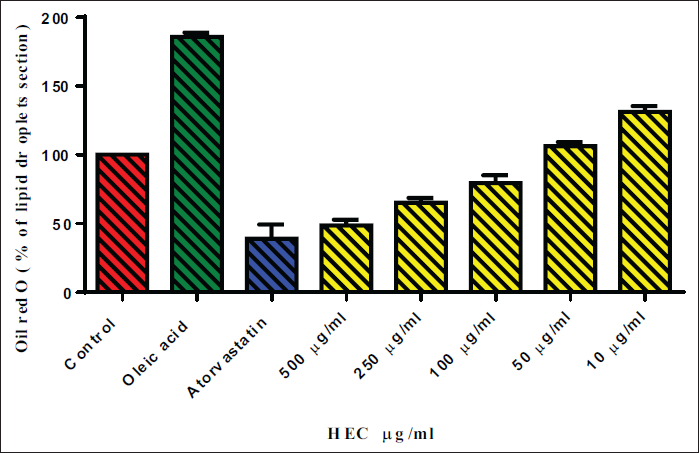
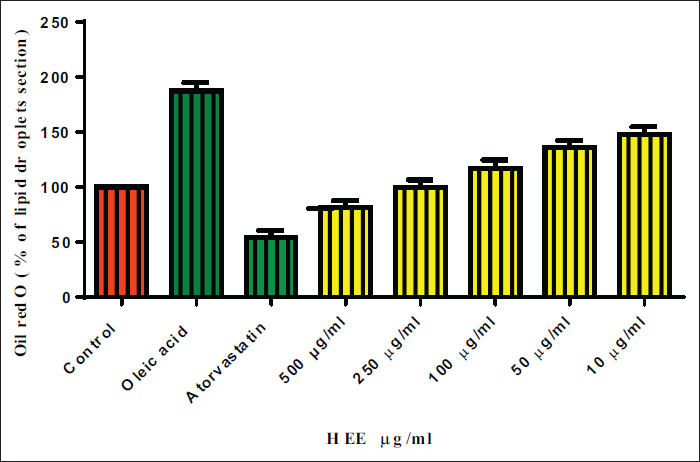
Effect of Extracts on Droplets of Lipid Accumulation by Staining O Red Oil
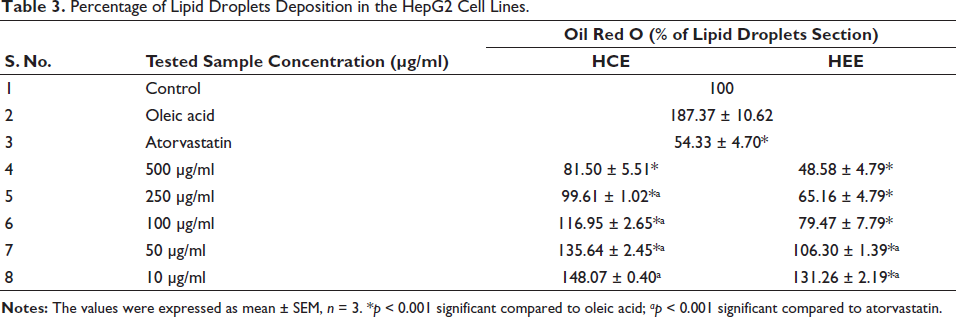
The cytotoxicity of tested extracts, HEE, and HCE in HepG2 cell lines using an MTT assay. The results showed that at higher doses (500 µg/ml), the tested material displayed substantial cytotoxicity, with only 80–90% cell viability detected. However, the cytotoxicity was significantly reduced at lower doses (10–250 µg/ml), with over 100% cell viability being observed in some cases. To determine the effect of different sample concentrations on lipid droplet formation in HCE and HEE-treated cells, oil red O staining was used, and the proportion of lipid droplets was presented in Table 3. The results showed that the tested material significantly reduced lipid droplet production in both HEE and HCE group cells at higher doses (500 and 250 µg/ml) compared to oleic acid and atorvastatin, as shown in Figures 2 and 3. At lower doses (10–100 µg/ml), the tested material showed lower percentages of lipid droplet section than the atorvastatin group, indicating a less severe but substantial influence on lipid droplet formation. These findings suggest that the tested material can be used to reduce lipid droplet accumulation in HEE and HCE group cells, especially at lower doses.
Percentage of Lipid Droplets Deposition in the HepG2 Cell Lines.
Effect of HEC on % Lipid Droplet Deposition.
Effect of HEE on % Lipid Droplet Deposition.
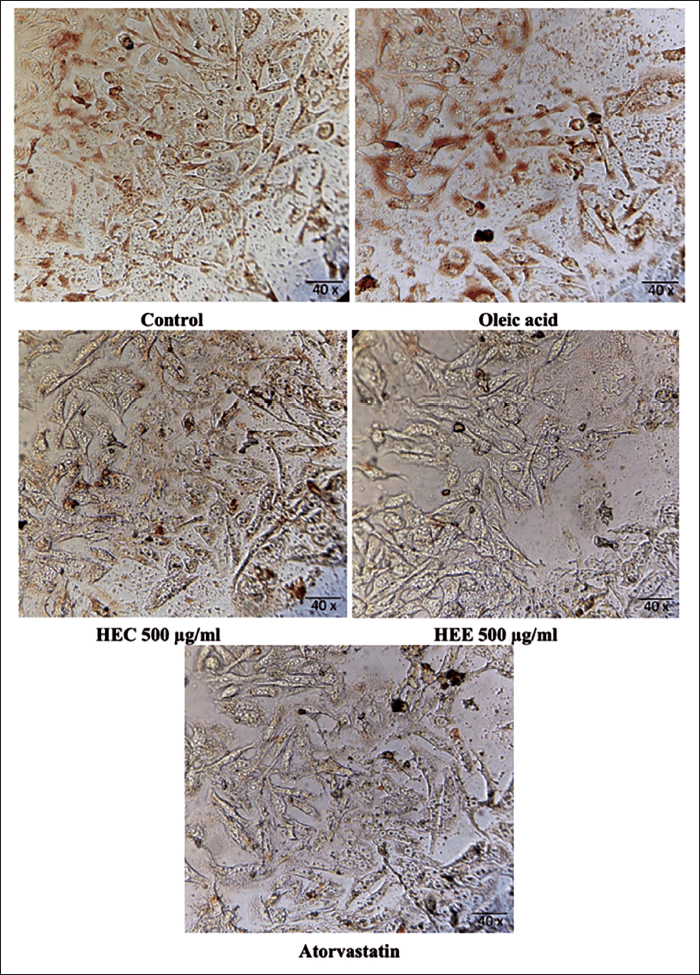
The photomicrographs in Figure 4 showed a demarked difference in the cell structure and lipid deposition inside the cells, which were stained red due to the dye. Therefore, the cells treated with the low-dose extracts showed more red dots in the slides compared to the highest dose and standard drug. The normal control showed well-differentiated cells with elongated trails and lipid deposits. Cells treated with oleic acid accumulated more fat inside them, showing significant red dots, which indicated that the cells were bulged with excessive fat deposits. Interestingly, the lipid droplets in the low-dose extracted cells appeared to be like they are splashed inside the cells. Few cells were ruptured, too, which might be due to excess accumulation.
Picto-micrographs Showing the Lipid Droplet Deposition in HepG2 Cell Lines.
Effect of Extracts on the Lipid Content of Cells
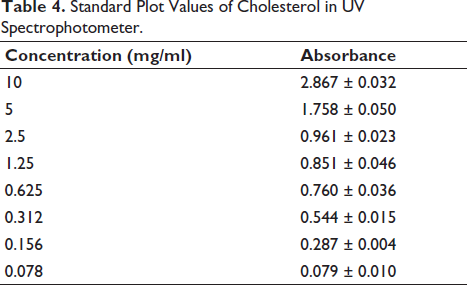
A standard plot of cholesterol was generated by measuring the absorbance at different concentrations (10, 5, 2.5, 1.25, 0.625, 0.312, 0.156, and 0.078 mg/ml) of cholesterol (Table 4) dissolved in a chloroform and methanol solvent system, which acted as the standard solution. Thus, the standard graph of cholesterol in Figure 5 was constructed by plotting the absorbance against the cholesterol concentration with an R2 value of 0.9619, indicating that the values were linear and rational.
Standard Plot Values of Cholesterol in UV Spectrophotometer.
Standard Plot of Cholesterol in UV.
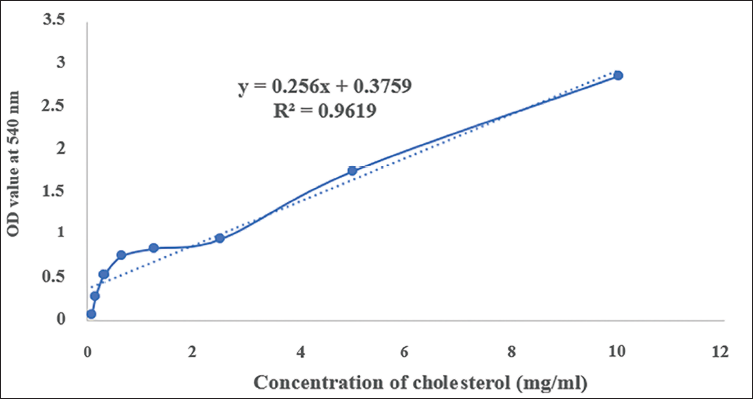
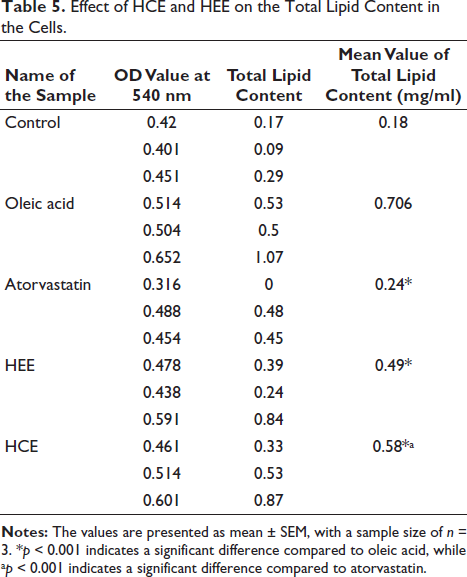
Table 5 and Figure 6 show the results of measuring the total lipid content in various samples, including a control group, oleic acid, atorvastatin, HEE cells, and HEC cells. In addition to the mean total lipid content measured in mg/ml, the OD at 540 nm is also presented.
Effect of HCE and HEE on the Total Lipid Content in the Cells.
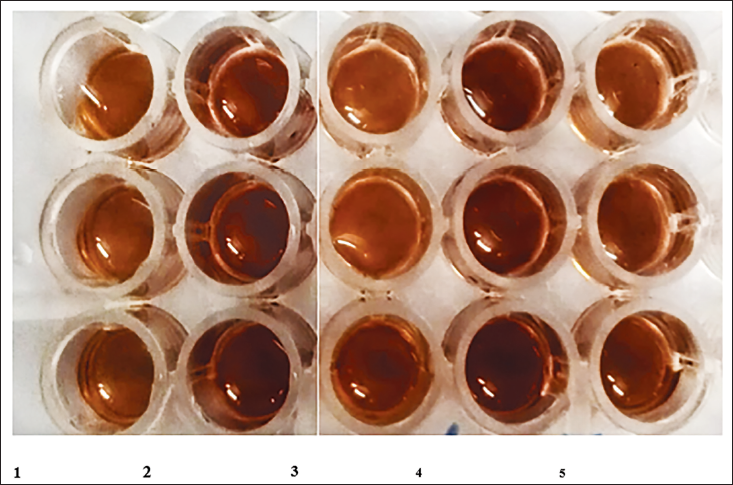
Stained Cell Lines Using Oil Red O Staining. 1. Control; 2. oleic acid; 3. atorvastatin; 4. HEE; 5. HCE.
It was found that the control group contained 0.18 mg/ml of total lipids. Nevertheless, since it is a lipid, oleic acid displayed a significantly higher total lipid content than linoleic acid, indicating that it can increase the amount of lipids in the body. However, atorvastatin significantly reduced total lipid levels to 0.24 mg/ml, suggesting it may be able to lower lipid levels. Cells treated with HEE had a total lipid content of 0.49 mg/ml, compared to cells treated with HCE, which had a total lipid content of 0.58 mg/ml. Compared to HCE, HEE appears more capable of inhibiting lipid accumulation. The statistical analysis results showed that the tested samples affected the total lipid content significantly. As the test sample dose increased, the total lipid content was significantly reduced compared to oleic acid. Even at lower doses, the tested sample significantly affected the total lipid content, albeit less obviously than atorvastatin.
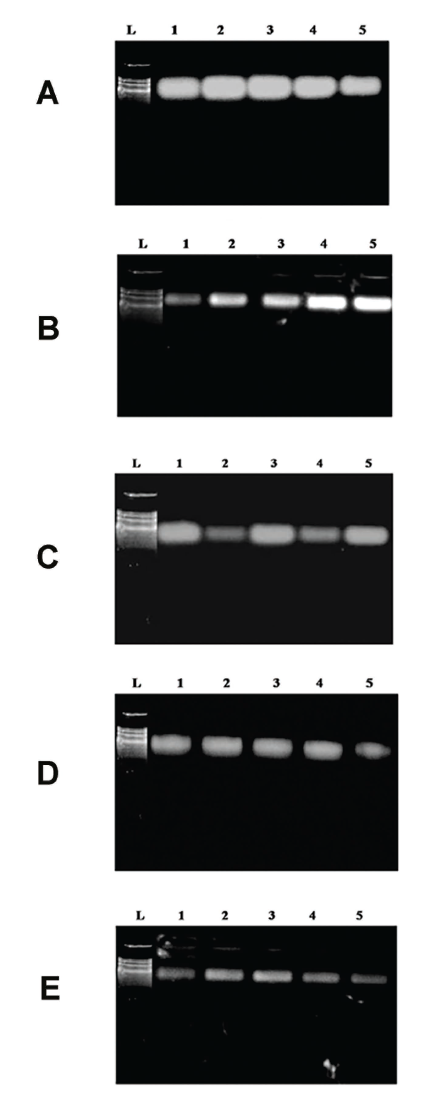
Effect of Extract Over Adipogenic Expression on Gene
The effect of the extracts HCE and HEE on the regulation of the gene expression was investigated using the RT-PCR method (Figure 7). Actin, AMPK, FAS, LDL receptor, and HMG-CoA were genes selected for the study that signifies the accumulation and generation of lipids. All the groups showed similar actin expression of almost 100%, which indicates normal cell division and differentiation. An increase in AMPK expression was observed in all the other groups, including the standard group. The normal group expression of AMPK was about 35%, and the induced group showed 43.3%. The expression was further elevated in the extract-treated groups, with HCE and HEE showing 45.2% and 51.5%. A standard drug of 55% showed the highest expression of the gene.
Percentage of Expression Values of Samples in Various Proteins in RT-PCR Analysis.
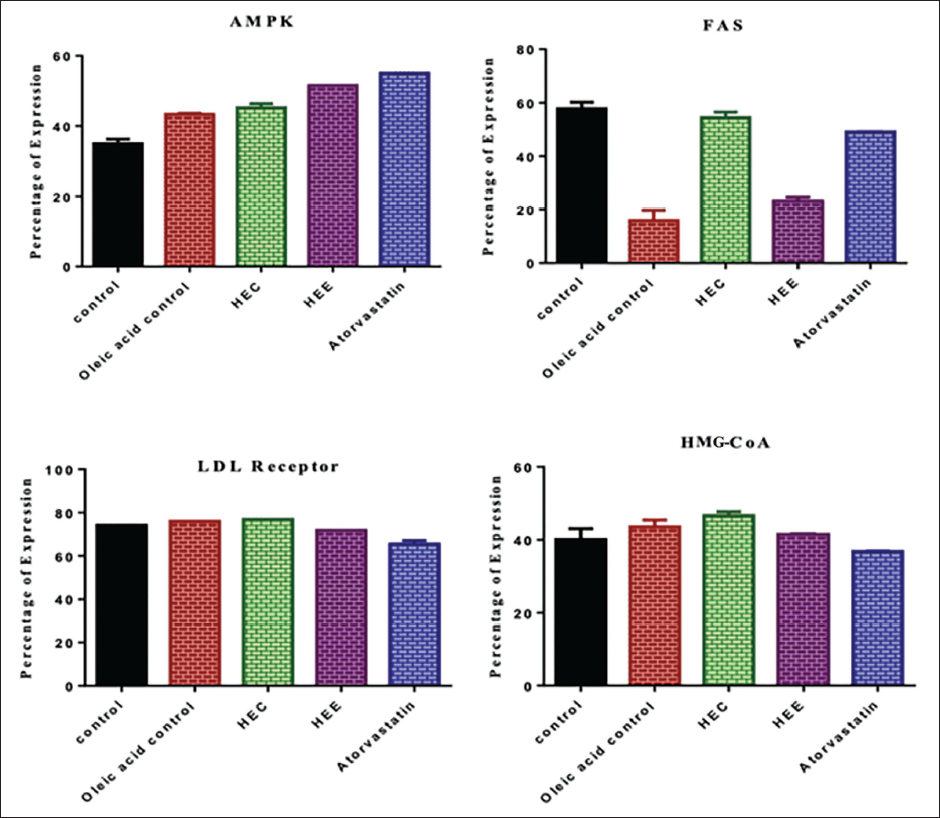
The results of the FAS gene expression showed contrasting readings. The normal groups showed the highest expression of 57.7%, where it was significantly lowered to about 15.8% by treatment with oleic acid. The treatment with the extracts suppressed the FAS gene to about 54.4% and 23.2% with HCE and HEE, indicating higher HEE activity than HCE in expressing the FAS gene. The standard group showed about 49.1% expression, as shown in Table 6. On the other hand, the expression of the LDL receptor gene also showed results similar to those of actin. The cells displayed identical expression of the LDL receptor gene, with around 70% of the cells being in all the groups. However, standard group cells showed a slightly low expression of the LDL gene of 65.4%. The highest expression was found in the HCE group of 76.9%. The indicator of adipogenesis, HMG-CoA, also displayed similar expression results, around 40% expression. The standard group showed the slightest expression at 36.7%, and the highest expression was shown by the HCE group at 46.6%, better than the normal group of 40%. However, overall, no significant expression was noticed in any of the groups in HMG-CoA.
Percentage of Expression of Various Genes due to Treatment with Extracts.
Discussion
Traditional medicinal uses of R. hypocrateriformis have been documented in multiple regions worldwide. R. hypocrateriformis extracts have been studied extensively for their potential to address hyperlipidemia in animal models. Often, in vitro liver function and lipid metabolism studies use HepG2 cells, a human liver cancer cell line. It is easy to handle, growth is stable, and lipoproteins can be synthesized and secreted, thanks to the HepG2 cell line. Due to these characteristics, it makes a good model for assessing lipid metabolism and hyperlipidemia changes caused by drugs (Khan et al., 2019). HepG2 cells have been used for several studies to examine how drugs affect intracellular lipid accumulation, lipid synthesis genes, and key enzymes involved in lipid metabolism, including HMG-CoA reductase and lipoprotein lipase (Bei et al., 2012; Rotimi et al., 2022). Various compounds are evaluated on liver function using the HepG2 cell line to study lipid metabolism, hyperlipidemia, and the effects of lipids on liver function in vitro (Mao et al., 2019).
According to Table 2 of the in vitro studies, different concentrations of HPE, HCE, HAE, and HEE extracts were used to assess the viability of HepG2 cells. There was a range of concentrations between 10 and 500 µg/ml in the samples. HCE and HEE were found to be more cell viable in HepG2 cells at higher concentrations than the other extracts. It is common to routinely use the cell viability assay to assess compounds’ cytotoxic or growth-inhibitory effects on cells, even though it provides no insight into the specific mechanisms of action of the tested samples on HepG2 cells. HepG2 cells are relatively less cytotoxic to HCE and HEE, based on the observed cell viability at higher concentrations of these compounds. Also, compared to the other extracts, their IC50 values show more potency.
R. hypocrateriformis extracts (HCE and HEE) were compared to oleic acid (OA) and atorvastatin for their effects on lipid droplet accumulation in HepG2 cells. Triglycerides were accumulated and lipid droplets (LDs) were closer to mitochondria after exposure to OA. However, these LDs induced by OA were inactive, preventing mitochondrial fatty acid oxidation and providing little bioenergy to associated mitochondria (Eynaudi et al., 2021). HepG2 cells were treated with HCE and HEE extracts dose-dependently, and both extracts reduced lipid droplet accumulation significantly compared to the control group. Compared to the HCE extract, the HEE extract was more effective at lowering lipid levels. Despite being less potent than HEE extract, atorvastatin, a known lipid-lowering drug, was also effective at reducing lipid levels. Previously, R. hypocrateriformis extracts have been shown to possess antioxidant properties. Loganayaki et al. (2010) demonstrated that R. hypocrateriformis extract had robust antioxidant activity in vitro. Based on their ability to reduce lipid droplet accumulation and their antioxidant properties, R. hypocrateriformis extracts may be effective as natural lipid-lowering agents.
Several genes regulate lipid metabolism, including a-actin, AMPK, FAS, and LDL receptors. Its relatively stable expression across various tissues and experimental conditions makes it a standard reference gene in gene expression studies (Figure 8). Interestingly, hyperlipidemic mice were not significantly affected by lipid metabolism disorders in terms of actin expression in their liver, suggesting lipid metabolism disorders do not affect its expression. This enzyme regulates lipid metabolism, actively participating in maintaining cellular energy balance. Acetyl-CoA carboxylase (ACC) and fatty acid synthase (FAS) are suppressed by it, facilitating fatty acid oxidation while inhibiting lipid synthesis. The activation of AMPK has been demonstrated to improve lipid profiles in animal models by phosphorylating them (Kim et al., 2016; Zang et al., 2004).
Gene Expression Analysis in HepG2 Cells. (A) B-Actin; (B) AMPK; (C) FAS; (D) LDL receptor, and (E) HMC-CoA. 1. Ladder, 2. control sample, 3. oleic acid control, 4. HEE sample treated, 5. HEC treated sample, 6. atorvastatin treated.
An essential transmembrane protein for cholesterol homeostasis is the low-density lipoprotein receptor (LDLR). In hepatocytes, it aids the uptake of LDL particles from the bloodstream. Depletion of intracellular cholesterol activates the transcription factor SREBP-2, which is responsible for regulating LDL receptor expression. The absence of LDL receptors impairs LDL clearance, resulting in increased levels of LDL particles in the blood, contributing to hyperlipemia (Ho et al., 1978). Cholesterol biosynthesis is rate-limited by the enzyme 3-hydroxy-3-methylglutaryl-coenzyme A (HMG-CoA). A high level of HMG-CoA expression in the liver occurs in hyperlipidemic animals and humans, resulting in elevated levels of hepatic cholesterol synthesis (Marahatha et al., 2021).
In synthesizing fatty acids from acetyl-CoA and malonyl-CoA, the enzyme FAS is essential. Swierczynski et al. (2014) and Wang et al. (2020) demonstrate that FAS expression is upregulated in the livers of hyperlipidemic animals and humans. As a result of FAS activation by HCE and atorvastatin, cells may have been fasting, which has resulted in some degree of fat synthesis. As a result, HEE suppressed FAS expression, confirming its lipid-disrupting mechanism.
Thus, on account of all the studied expressions of various genes, FAS suppression is attributed to the antihyperlipidemic activity of the extracts, where disruption of lipogenesis and lipid accumulation are possible mechanisms of action. This is also evident from the microscopic studies of the cell lines, which showed reduced lipid accumulation in the cells. Some studies suggest the synergetic action of the extracts in treating diseases (Anwar et al., 2022), which also supports the fact that HEE and HEC extracts of the selected plant might contain more chemical constituents that are potent to prevent hyperlipidemia and their synergistic activity gave better results with HEE and compared to HEC and standard drug in suppression of FAS gene expression.
Conclusion
A study conducted on HepG2 cells showed that R. hypocrateriformis extracts reduced the accumulation of lipid droplets dose-dependently. As a natural agent for lowering lipid levels, R. hypocrateriformis extracts may prove helpful. Further, the study demonstrates the usefulness of HepG2 cells for investigating liver function and lipid metabolism in vitro. Although the results shed light on the effects of R. hypocrateriformis extracts on lipid metabolism, further research is needed to fully understand their mechanism of action and assess their safety and effectiveness in vivo. In conclusion, this study contributes valuable insights to the growing body of knowledge regarding natural compounds and their potential role in treating hyperlipidemia.
Footnotes
Acknowledgments
The authors thank VISTAS, Pallavaram for their necessary support during this tenure of work.
Declaration of Conflicting Interests
The authors declared no potential conflicts of interest with respect to the research, authorship, and/or publication of this article.
Funding
The authors received no financial support for the research, authorship, and/or publication of this article.